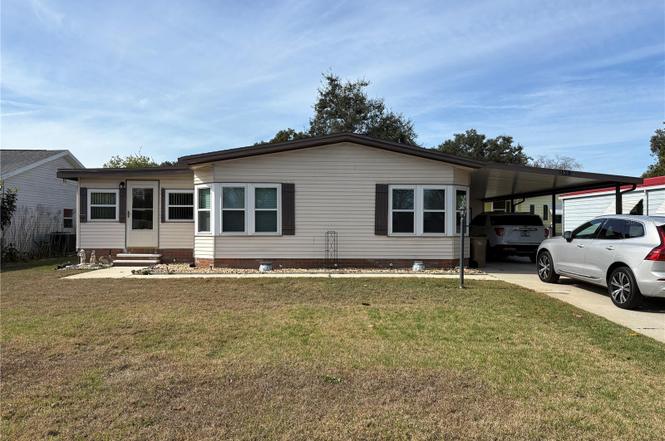
25051 Betton Hl · Leesburg, FL
Flood risk 1/10 · Minimal
- FEMA flood zone
- X (unshaded)
- Chance of flooding over 30 yrs
- 0.0%
- Est. flood insurance / yr
- $507 – $1,088
Fire risk 5/10 · Moderate
- Est. fire insurance / yr
- $947 – $1,759
Heat risk 8/10 · Major
- Hot days now (above 108°F)
- 7 days/yr
- Hot days in 30 yrs
- 22 days/yr
Wind risk 9/10 · Severe
- Chance of severe wind over 30 yrs
- 99.0%
Air-quality risk 2/10 · Minimal
- Unhealthy air days now
- 1 days/yr
- Unhealthy air days in 30 yrs
- 2 days/yr
Risk factors via First Street. Map © Google.
Why this score? — see what drove the C grade
The composite is a weighted blend of 9 inputs, each scored 0–100. Each bar is that input's sub-score; the figure is the points it added to the 100-point composite (weight × sub-score).
- Cash flow +27.1/30.0
- DSCR +9.4/10.0
- 1% rule +8.4/10.0
- Schools +4.2/10.0
- Livability +3.1/5.0
- Condition / age +2.5/5.0
- Rent growth +2.3/5.0
- ARV discount +1.4/15.0
- Appreciation +0.0/10.0
$154,900
🖨 Deal sheet 📄 Offer letter ✓ Due diligence
Listing remarks
* * * THE PLANTATION OF LEESBURG * * * 55PLUS COMMUNITY * * * This is truly an amazing opportunity to purchase a very well maintained home in a premier gated community in Leesburg. Current owner has taken great care of this home over the past 20 years. This 2-Bedroom 2-bathroom home with an additional Florida room, which has wonderful natural light flooding the space; perfect for a craft room or gathering with friends. Another great bonus is a 100sf detached storage room off the carport. Most current improvements are as follows: ROOF (2015), AC (2024), DUAL PANE WINDOWS (2015), WATER HEATER (2023) & BRAND NEW SS REFRIGERATOR (1/26) This community is ideally located less than an
Key facts
- Gated community
- 18 hole golf courses
- Florida room
Tags
Property features AI
Finance
- Other: Irrigation equipment included; Unfurnished; Homestead exemption indicated
- Financial info: Total monthly fees $180; Total annual fees $2,160; Lease restrictions apply
- HOA & community: Monthly HOA $180; Association fee includes 24-hour guard, pool, escrow reserves, management, recreational facilities; Clubhouse, pool, pickleball courts, fitness center, golf, community mailbox; Deed-restricted, buyer approval required; Senior community; Pets allowed
Exterior
- Parking: Covered parking; Driveway; Open parking; 1-car carport
- Security: Gated community (community amenity)
- Utilities: Public water; Public sewer; Cable available and connected; Electricity connected; Water connected; Sewer connected
- Home design: Manufactured home (double wide); Single-story; Faces east; One-level entry
- Construction: Metal siding and frame construction; Metal and shingle roof; Pillar/Post/Pier foundation; Built as double wide manufactured home
- Exterior features: Rain gutters; Paved road access
Interior
- Kitchen: Dishwasher; Disposal; Microwave; Refrigerator; Electric water heater
- Bedrooms: 2 bedrooms
- Flooring: Carpet; Laminate
- Bathrooms: 2 full bathrooms
- Heating & cooling: Central heating (electric); Central air
- Interior features: Ceiling fans; Thermostat; Window treatments; Skylight(s)
- Laundry & utility: Washer; Dryer; Inside laundry
Neighborhood map
What this means for you Summary
Snapshot
- This is a 2-bed/2.0-bath manufactured listed at $155k.
Deal economics
- At list price, monthly cash flow is $438 ($5k/yr) — positive.
- The deal already cash-flows at list — no discount required.
- Meets the 1% rule at list price ($2k rent vs $155k).
- Recommended offer: $136k (12.0% below list) — sets the bar for market timing.
- Cap rate 9.7% vs local median 4.5% in Leesburg — top-decile yield for the area; either an underpriced asset or a hidden risk that comps aren't pricing in. Stress-test before assuming the spread holds.
Location & tenants
- Location reads 62/100 on livability (#751 in FL) — a middle-class / working-renter tenant base. Strengths: cost of living A+, housing A+; Watch: schools D+, crime D, amenities F.
- Lake (suburban): math 49% / reading 50% proficiency, ranked #37 of 73 in FL (top 51%) — families likely to look elsewhere, expect single-tenant / working-renter base with shorter leases.
- Market conditions: Rents soft (-0.9%/yr); 783 active listings in the ZIP; 7 comparable units currently listed for rent nearby; rentals at typical pace (median 24d on market — plan ~3-4 weeks tenant-placement turnaround); 4,799 units permitted in Lake County in 2024 (814 in 5+ unit buildings).
- This rent runs 43% of the median local income ($58k/yr) — at the standard rent-burdened threshold; future hikes will face affordability resistance.
Forward outlook
- Local home prices are declining (-3.0%/yr); year-one equity from $1k of loan paydown is wiped out by about $5k of value loss. Plan a longer hold.
- Lake County population projected at +37% by 2050 — long-run rental-demand tailwind backs the buy-and-hold thesis.
Negotiation context
- It's been on market 155 days — a 12% lower offer ($136k) is reasonable based on typical stale-listing flexibility.
- Current owner paid $90k; list at $155k implies a 72% gain — meaningful room to come down on a strong offer.
Risks & watch-outs
- Climate carrying-cost: severe wind risk, 99% chance of damaging wind over 30y; moderate wildfire risk; extreme-heat days projected 7→22/yr by 2055 (HVAC capex compounding) — expect insurance premiums to compound above CPI over the hold.
Questions for the listing agent
- It's been on market 155 days. Have you received any prior offers? Is the seller open to a 12% concession, seller financing, or rate buy-down credit?
- What does the HOA fee cover, when was the last increase, and are there any pending special assessments or reserve-fund shortfalls?
- Why hasn't it sold? Are there any deal-killer items the seller is aware of (foundation, flood, title, zoning, code violations)?
- Is there a deadline driving the sale (1031 exchange, divorce, estate, relocation)? That informs how much negotiation room exists.
- Schools are D-rated, which usually means shorter tenancies and higher turnover. Who's the typical renter profile here, and what's been the actual vacancy rate?
- Crime grade is D in this area — have there been break-ins, vandalism, or insurance claims at this property in the last 3 years? What carrier currently insures it and at what premium?
- What's the average days-on-market for RENTAL listings here right now (not sales)? A rising rental-DOM trend means longer vacancies and softer asking-rent achievability than the comps imply.
- What's the recent tenant-quality profile in this submarket — average credit score on applications, eviction rate, late-payment / NSF rate, and stable-employment percentage? A property-management company in the area should have these aggregated.
- How much new for-sale + rental construction is in the pipeline within 1–3 miles? Heavy new supply typically softens prices + rents 12–24 months out; constrained supply supports both.
Investment metrics
- 1% rule
- 1.34% ✓
- Cap rate
- 9.68%
- Cash-on-cash
- 12.11%
- DSCR
- 1.54
- GRM
- 6.2
CMA / ARV
- ARV (on-the-fly)
- $136,524
- Comps found
- 1
Show comp detail 1 sale within ~0.75 mi
| Address | Dist | Beds/Ba | Sqft | Sold | Price | $/sf | Match |
|---|---|---|---|---|---|---|---|
| 25101 Barrow Hl | 0.04mi | 2/2.0 | 1,446 (-2%) | 10mo | $135,000 | $93 | 87 |
Match score weights: distance 35% · size 25% · config 20% · recency 20%. Top-matched comps best support the ARV.
Projected returns pro-forma
-3.0% appreciation · 0.0% rent growth · sell at horizon
- IRR
- -2.0%
- Equity multiple
- 0.93×
- Total profit
- $-3,184
- Equity at exit
- $23,096
- IRR
- 3.8%
- Equity multiple
- 1.23×
- Total profit
- $10,101
- Equity at exit
- $13,393
Cash invested: $43,372 (down + closing). Projections, not guarantees.
Landlord ↔ Tenant lean methodology
- Overall (STATE)
- 87 Strongly Landlord-Friendly
- State Florida
- 87 Strongly Landlord-Friendly · R+3
- County
- — inherits STATE
- City
- — inherits STATE
ZIP-level market 34748
- Home prices YoY
- -25.3%
- Rents YoY
- -0.9%
- Active inventory
- 783
- Price-to-rent
- 6.2×
Monthly cashflow live
- Estimated rent
- $2,073 high interval (Pro) →
- Mortgage (P&I)
- −$812
- Tax from tax record
- −$143 /mo · $1,717/yr
- Insurance
- −$65
- HOA
- −$180
- Vacancy / Maint / Mgmt
- −$435
- Net cashflow
- $438
Break-even live
UW: 25.0% down · 7.5% · 30yr · 1.5% tax · 5.0% vac · 8.0% maint · 8.0% mgmt
Financing live
Cash to close
- Down payment
- $38,725
- Closing costs
- $4,647
- Reserves months
- —
- Total cash needed
- —
Loan-product check · same deal, 3 products live
Conventional
25% down · 7.5% · 30yr
- Down + closing
- —
- Monthly P&I
- —
- Monthly cashflow
- —
- DSCR
- —
- Eligible?
- —
Personal DTI + credit; lowest rate.
DSCR
20% down · 8.5% · 30yr
- Down + closing
- —
- Monthly P&I
- —
- Monthly cashflow
- —
- DSCR
- —
- Eligible?
- —
No personal income docs; deal must DSCR.
Hard money
10% down · 12.0% · 12mo
- Down + closing
- —
- Monthly P&I
- —
- Monthly cashflow
- —
- DSCR
- —
- Eligible?
- —
Short-term bridge; refi at stabilization.
Rent comps 7 comps
| Address | Beds | Baths | Sqft | Rent | $/sqft | DOM | Units | Dist |
|---|---|---|---|---|---|---|---|---|
| 5009 El Destino Dr Leesburg, FL | 2.0 | 2.0 | 1428 | $2,450 | $1.72 | 24d | 1 | 0.11mi |
| 25049 Navel Ave Leesburg, FL | 2.0 | 2.0 | 1430 | $2,800 | $1.96 | 24d | 1 | 0.42mi |
| 25533 Belle Helene Leesburg, FL | 2.0 | 2.0 | 1352 | $1,650 | $1.22 | 5d | 1 | 0.55mi |
| 4728 Belle Grv Leesburg, FL | 2.0 | 2.0 | 1480 | $1,700 | $1.15 | 24d | 1 | 0.58mi |
| 4501 River Ridge Dr Leesburg, FL | 2.0 | 2.0 | 1467 | $1,725 | $1.18 | 5d | 1 | 1.03mi |
| 10140 Huntingnet Way Leesburg, FL | 3.0 | 2.0 | 1589 | $2,250 | $1.42 | 24d | 1 | 1.22mi |
| 3690 Arlington Ridge Blvd Leesburg, FL | 3.0 | 2.0 | 1699 | $2,200 | $1.29 | 18d | 1 | 1.46mi |
HOA detail
- Monthly dues
- $180 · $2,160/yr
- Likely covers
- watersecurity
Listing history 18 events
-
2026-06-18days on market $154,900 Active 155 DOM
-
2026-06-17days on market $154,900 Active 154 DOM
-
2026-06-16days on market $154,900 Active 153 DOM
-
2026-06-15days on market $154,900 Active 152 DOM
-
2026-06-13days on market $154,900 Active 150 DOM
-
2026-06-09days on market $154,900 Active 146 DOM
-
2026-06-08days on market $154,900 Active 145 DOM
-
2026-06-07days on market $154,900 Active 144 DOM
-
2026-06-04days on market $154,900 Active 141 DOM
-
2026-06-03days on market $154,900 Active 140 DOM
-
2026-06-02days on market $154,900 Active 139 DOM
-
2026-06-02days on market $154,900 Active 138 DOM
-
2026-05-31days on market $154,900 Active 137 DOM
-
2026-04-17price $154,900
-
2026-01-14$159,900 Active
-
2005-06-17soldstatus $90,000
-
2003-03-24soldstatus $70,000
-
1987-12-01soldstatus $15,000
ⓘ Source: listings_history table (triggers on properties + properties_extension) + one-shot
backfill from property_details.listing_events for pre-trigger history.
Tax reassessment forecast FL · Resets to sale price
- Current annual tax
- $1,717 · $143/mo
- Projected year-2 tax
- $1,717 · $143/mo
- Expected delta
- $0/yr ($0/mo · 0.0%)
ⓘ Screening estimate from a state-policy table — verify with the county assessor before closing.
Climate risk First Street
- Flood 1/10 Low FEMA zone X (unshaded) · 0% chance over 30 yrs
- Wildfire 5/10 Major
- Heat 8/10 Severe 7 d/yr ≥108°F today · 22 d/yr by 30 yrs out
- Wind 9/10 Extreme 99% chance of damaging wind over 30 yrs
- Air quality 2/10 Low 1 unhealthy d/yr today · 2 by 30 yrs out
Nearby sold comps map
Loading sold comps map…
Walkable amenities ~0.75 mi
Loading nearby amenities…
Taxation est. · year 1
- Rental income
- $24,876
- − Mortgage interest
- −$8,677
- − Property taxes
- −$1,717
- − Insurance
- −$774
- − Repairs & maintenance
- −$1,990
- − Management
- −$1,990
- − HOA
- −$2,160
- − Depreciation
- −$4,506
- Taxable income
- $3,062
- Est. tax owed @ 24.0%
- −$735
- After-tax cash flow
- $4,518/yr
For passive investors: Depreciation is non-cash, so a rental often shows a tax loss while cash-flowing — sheltering income. Rental losses are passive: they offset passive income freely, and up to $25,000/yr can offset ordinary (W-2) income if you actively participate and your MAGI is under $100k (phasing out to $0 by $150k); unused losses carry forward. On sale, claimed depreciation is recaptured at up to 25%, and gains may owe capital-gains tax (a 1031 exchange can defer both). Figures are a year-1 estimate at your 24.0% rate — not tax advice; consult a CPA.
Schools (NCES district)
- District
- Lake
- NCES district ID
- 1201050
- Math proficiency
- 49% ▼ -7.00%
- Reading proficiency
- 50% ▼ -4.00%
- Median HH income
- $46,632
- Composite
- 42.05/100
- National rank
- #3327
- State rank
- #37 of 73 in FL
Livability — Leesburg
- Score
- 62/100
- State rank
- #751
- US rank
- #16429
Category grades
Schools grade is shown separately in the Schools card above.
Census & demographics
- County
- Lake County · 364,602 people
- City population
- 70,232
- Metro
- Orlando-Kissimmee-Sanford, FL
- Population (ZIP)
- 48,095
- Household income
- $58,192
- Rent vs Own
- Severe rent burden
- 1745.0
Population outlook (Lake County) Hauer SSP2
- Today (2025)
- 386,640 people
- By 2030
- 417,107 · +7.9%
- By 2040
- 476,676 · +23.3%
- By 2050
- 531,296 · +37.4%
- By 2075
- 648,303 · +67.7%
- By 2100
- 698,530 · +80.7%
Race, ethnicity, and origin ACS 2023
- Neighborhood character
- Majority White (64%)
- Race & ethnicity
- White 64% Black 16% Hispanic / Latino 15% Two or more races 9% Asian 1%
- Hispanic origin (detail)
- Mexican 4% Puerto Rican 5% Cuban 3%
- Common ancestry
- Romanian 3% Lithuanian 3% Slovak 2%
- Foreign-born
- 9% · Canada, Vietnam, Jamaica
- Languages at home
- 88% English-only · Spanish 10% French/Haitian/Cajun 1%
Political lean MEDSL · Lake
- 2024 margin
- Strong R (+24.7) · D 37.3% · R 62.0%
- 2008→2024 swing
- -11.2pp toward R · 2008: -13.5pp · 2024: -24.7pp
- All cycles
- 2024: R+24.7 2020: R+20.0 2016: R+23.1 2012: R+17.1 2008: R+13.5
Not yet ingested
- Civics
- —
Market trends
- HPI YoY
- ▼ -88.97%
- Current HPI
- 262.1766
- Rent YoY
- ▼ -0.95%
- Metro
- Orlando-Kissimmee-Sanford, FL
- State GDP YoY
- ▲ 3.28%
- F500 in state
- 36
Industry mix (Fortune 500 HQ in FL)
| Industry | F500 HQs | Revenue |
|---|---|---|
| Industrial Technology | 2 | $29B |
|
||
| Insurance | 2 | $17B |
|
||
| Retail | 1 | $60B |
|
||
| Technology Distribution | 1 | $58B |
|
||
| Homebuilding | 1 | $35B |
|
||
| Technology Manufacturing | 1 | $35B |
|
||
Price history
+932.7% since first listed5 events — show timeline
- 2026-04-17 Price Changed $154,900 Stellar MLS as Distributed by MLS Grid
- 2026-01-14 Listed $159,900 Stellar MLS as Distributed by MLS Grid
- 2005-06-17 Sold (Public Records) $90,000 Public Records
- 2003-03-24 Sold (Public Records) $70,000 Public Records
- 1987-12-01 Sold (Public Records) $15,000 Public Records
Property tax history
+12.1%/yrLatest (2025): $1,717 · +2.7% YoY. Source: county tax records.
Cash-flow waterfall
monthlySold comps — $/sqft
last 12 mo · ≤1 miLoading sold comps…