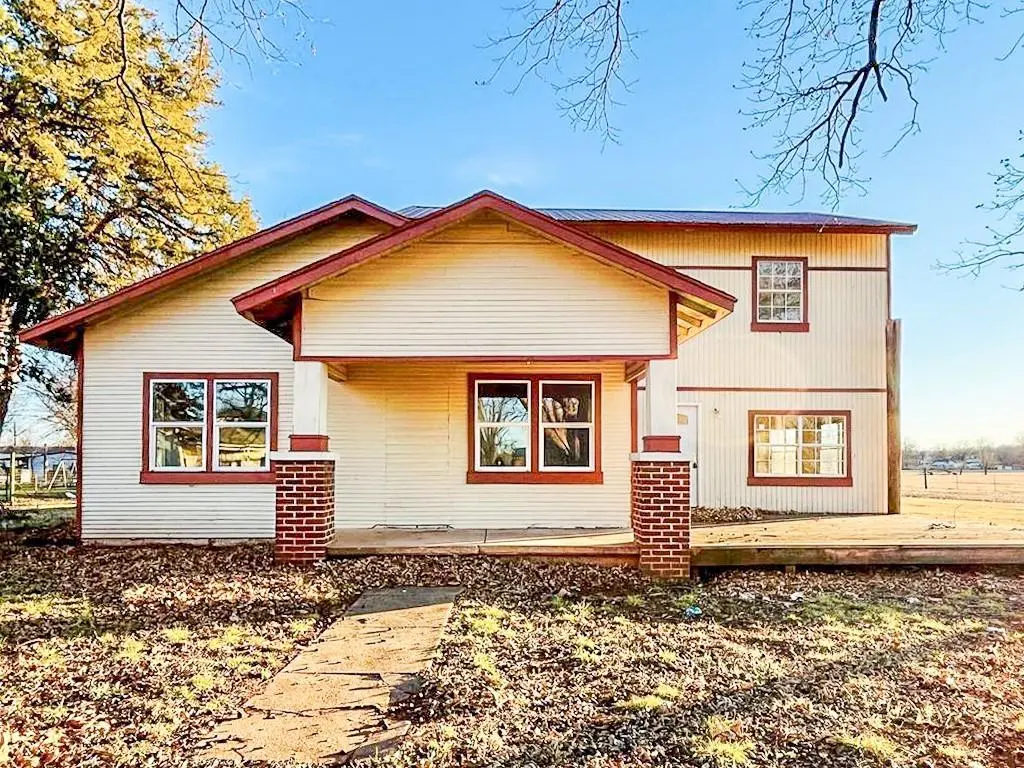
312 W C St · Alex, OK
Flood risk 6/10 · Moderate
- FEMA flood zone
- AE
- Chance of flooding over 30 yrs
- 0.75%
- Est. flood insurance / yr
- $1,737 – $8,500
Fire risk 5/10 · Moderate
- Est. fire insurance / yr
- $2,463 – $4,575
Heat risk 6/10 · Moderate
- Hot days now (above 109°F)
- 7 days/yr
- Hot days in 30 yrs
- 19 days/yr
Wind risk 3/10 · Minor
- Chance of severe wind over 30 yrs
- 7.0%
Air-quality risk 2/10 · Minimal
- Unhealthy air days now
- 1 days/yr
- Unhealthy air days in 30 yrs
- 2 days/yr
Risk factors via First Street. Map © Google.
Why this score? — see what drove the B- grade
The composite is a weighted blend of 9 inputs, each scored 0–100. Each bar is that input's sub-score; the figure is the points it added to the 100-point composite (weight × sub-score).
- Cash flow +26.9/30.0
- DSCR +9.3/10.0
- ARV discount +7.5/15.0
- 1% rule +7.3/10.0
- Appreciation +5.0/10.0
- Schools +4.4/10.0
- Livability +2.9/5.0
- Rent growth +2.5/5.0
- Condition / age +2.5/5.0
$114,240
🖨 Deal sheet (PDF) 📄 Offer letter ✓ Due diligence
Listing remarks
Tucked away in the heart of Alex, this charming two-story home offers timeless character, generous space, and peaceful views backing up to open land. With five bedrooms and two bathrooms, the layout provides flexibility for a variety of living arrangements, featuring three bedrooms downstairs and two upstairs, along with a bathroom on each level. Built with classic charm and ready for new life, this home is full of opportunity for someone with vision. A large front porch welcomes you in, while inside you’ll find unique details like a cozy nook beneath the staircase. The spacious floor plan offers room to gather, grow, and make it your own. This property does need some TLC and is being
Key facts
- Large front porch
- 0.74 acre lot
- Built 1936
Tags
Property features AI
Finance
- Other: Lot size about 0.7392 acres; Living area approximately 2,332 (assessor); Directions: From Main Street in Alex, turn west on to C Street. Property is at the end of the street on the left (south) side. GPS will NOT take you directly to property.
- Financial info: Not assumable; Loan qualification: Unknown; REO / Bank Owned
- HOA & community: No mandatory association dues
Exterior
- Utilities: Homestead not claimed
- Home design: Two-level single family residence; Residential property; Existing property
- Construction: Frame construction; Other construction materials; Composition roof; Conventional foundation; Built prior to or by assessor (living area source: assessor)
- Exterior features: Covered porch; Porch; Outbuildings; Corner lot
Interior
- Bedrooms: Five bedrooms
- Bathrooms: Two full bathrooms
- Heating & cooling: Other heating; Other cooling
- Interior features: One living area; No fireplace; No study
Neighborhood map
What this means for you Summary
Snapshot
- This is a 4-bed/2.0-bath single-family listed at $114k.
Deal economics
- At list price, monthly cash flow is $-112 ($-1k/yr) — negative.
- To cash-flow at today's rent, offer at most $94k (17.3% below list).
- Meets the 1% rule at list price ($1k rent vs $114k).
- Recommended offer: $94k (17.3% below list) — sets the bar for cash-flow.
Location & tenants
- Location reads 57/100 on livability (#474 in OK) — a working-class tenant base; expect higher turnover. Strengths: cost of living A+, housing A-; Watch: employment D+, crime F, amenities F.
- Alex (rural): math 50% / reading 50% proficiency, ranked #36 of 513 in OK (top 7%) — acceptable for families but not a draw, mixed tenant base, ~2y average lease; 68% free/reduced lunch — lower-income household profile, screen leases tightly.
- Zoned schools: Alex Es (math 42% / reading 32%, grade F, #132 of 845 statewide, top 19%, 218 students, 0% FRL); Alex Hs (math 10% / reading 10%, grade F, #361 of 447 statewide, top 94%, 86 students, 0% FRL) — zoned schools average 0% FRL vs 68% district-wide (68 pts lower); this property's tenant base skews higher-income than the district average.
- Zoned-school proficiency averages 24% at this address vs 50% district-wide (-26 pts) — the specific schools serving this property underperform the Alex average; the district grade overstates school quality for this exact location.
- Market conditions: 8 active listings in the ZIP; 224 units permitted in Grady County in 2024 (0 in 5+ unit buildings).
Forward outlook
- In year one you build about $4k of equity ($790 loan paydown + $3k appreciation (3.0% local appreciation)).
- Grady County population projected at +20% by 2050 — long-run rental-demand tailwind backs the buy-and-hold thesis.
- By year 8, paydown + projected appreciation supports a ~$31k cash-out refi (75% LTV) — recoverable capital for the next deal without selling this one.
Negotiation context
- It's been on market 38 days — a 3% lower offer ($111k) is reasonable based on typical stale-listing flexibility.
- 6 sale attempts since 4y ago with the ask held roughly flat each time — persistent listings suggest the price (not the market) is what's stuck; bring a comps-based counter.
Risks & watch-outs
- Watch-outs: flood insurance adds $427/mo; built in 1936 — expect roof / HVAC / electrical / plumbing capex.
- Climate carrying-cost: in FEMA flood zone AE (mandatory federal flood insurance); moderate wildfire risk; extreme-heat days projected 7→19/yr by 2055 (HVAC capex compounding) — expect insurance premiums to compound above CPI over the hold.
Questions for the listing agent
- What do current leases actually rent for vs. the listed asking? Can we see a recent rent roll and the last 12 months of T-12 income?
- It's been on market 38 days. Have you received any prior offers? Is the seller open to a 17% concession, seller financing, or rate buy-down credit?
- Built in 1936 — when were the roof, HVAC, electrical panel, plumbing, and water heater last replaced?
- What's the actual annual flood-insurance premium (NFIP or private), and is the property in a SFHA with mandatory coverage?
- Is there a deadline driving the sale (1031 exchange, divorce, estate, relocation)? That informs how much negotiation room exists.
- Schools are D-rated, which usually means shorter tenancies and higher turnover. Who's the typical renter profile here, and what's been the actual vacancy rate?
- Crime grade is F in this area — have there been break-ins, vandalism, or insurance claims at this property in the last 3 years? What carrier currently insures it and at what premium?
- What's the average days-on-market for RENTAL listings here right now (not sales)? A rising rental-DOM trend means longer vacancies and softer asking-rent achievability than the comps imply.
- What's the recent tenant-quality profile in this submarket — average credit score on applications, eviction rate, late-payment / NSF rate, and stable-employment percentage? A property-management company in the area should have these aggregated.
- How much new for-sale + rental construction is in the pipeline within 1–3 miles? Heavy new supply typically softens prices + rents 12–24 months out; constrained supply supports both.
Investment metrics
- 1% rule
- 1.23% ✓
- Cap rate
- 9.60%
- Cash-on-cash
- 11.80%
- DSCR
- 1.53
- GRM
- 6.8
CMA / ARV
No comps found within radius.
Projected returns pro-forma
3.0% appreciation · 3.0% rent growth · sell at horizon
- IRR
- 3.8%
- Equity multiple
- 1.22×
- Total profit
- $6,918
- Equity at exit
- $51,367
- IRR
- 7.2%
- Equity multiple
- 2.10×
- Total profit
- $35,033
- Equity at exit
- $79,163
Cash invested: $31,987 (down + closing). Projections, not guarantees.
Landlord ↔ Tenant lean methodology
- Overall (STATE)
- 83 Strongly Landlord-Friendly
- State Oklahoma
- 83 Strongly Landlord-Friendly · R+20
- County
- — inherits STATE
- City
- — inherits STATE
ZIP-level market 73002
- Active inventory
- 8
- Price-to-rent
- 6.8×
Monthly cashflow live
- Estimated rent
- $1,405 medium interval (Pro) →
- Mortgage (P&I)
- −$599
- Tax from tax record
- −$149 /mo · $1,787/yr
- Insurance
- −$48
- Flood insurance flood zone
- −$427 /mo · $5,118/yr
- HOA
- −$0
- Vacancy / Maint / Mgmt
- −$295
- Net cashflow
- $-112
Break-even live
Sensitivity live
| Price | -10% $-47 | -5% $-80 | +0% $-112 | +5% $-144 | +10% $-177 |
|---|---|---|---|---|---|
| Rent | -10% $-223 | -5% $-167 | +0% $-112 | +5% $-56 | +10% $-1 |
| Rate | -1.0pp $-54 | -0.5pp $-83 | base $-112 | +0.5pp $-142 | +1.0pp $-172 |
UW: 25.0% down · 7.5% · 30yr · 1.5% tax · 5.0% vac · 8.0% maint · 8.0% mgmt
Financing live
Cash to close
- Down payment
- $28,560
- Closing costs
- $3,427
- Reserves months
- —
- Total cash needed
- —
Loan-product check · same deal, 3 products live
Conventional
25% down · 7.5% · 30yr
- Down + closing
- —
- Monthly P&I
- —
- Monthly cashflow
- —
- DSCR
- —
- Eligible?
- —
Personal DTI + credit; lowest rate.
DSCR
20% down · 8.5% · 30yr
- Down + closing
- —
- Monthly P&I
- —
- Monthly cashflow
- —
- DSCR
- —
- Eligible?
- —
No personal income docs; deal must DSCR.
Hard money
10% down · 12.0% · 12mo
- Down + closing
- —
- Monthly P&I
- —
- Monthly cashflow
- —
- DSCR
- —
- Eligible?
- —
Short-term bridge; refi at stabilization.
Listing history 40 events
-
2026-06-21days on market $114,240 Active 38 DOM
-
2026-06-18days on market $114,240 Active 35 DOM
-
2026-06-17days on market $114,240 Active 34 DOM
-
2026-06-16days on market $114,240 Active 33 DOM
-
2026-06-15days on market $114,240 Active 32 DOM
-
2026-06-13days on market $114,240 Active 30 DOM
-
2026-06-09days on market $114,240 Active 26 DOM
-
2026-06-08days on market $114,240 Active 25 DOM
-
2026-06-07days on market $114,240 Active 24 DOM
-
2026-06-03days on market $114,240 Active 20 DOM
-
2026-06-02days on market $114,240 Active 19 DOM
-
2026-06-01days on market $114,240 Active 18 DOM
-
2026-05-31days on market $114,240 Active 17 DOM
-
2026-05-14$114,240 Active
-
2026-04-14historical
-
2026-04-02price $114,240
-
2026-01-26status Active
-
2026-01-09status Pending
-
2025-10-18price $119,000
-
2025-10-13$122,709 Active
-
2025-09-19historical
-
2025-06-27price $122,709
-
2025-03-31price $126,503
-
2025-02-08price $133,161
-
2024-12-18price $138,710
-
2024-11-27price $143,000
-
2024-10-15price $149,000
-
2024-09-24$153,780 Active
-
2024-09-07historical
-
2024-08-28price $153,780
-
2024-07-12price $157,780
-
2024-04-01price $161,000
-
2024-02-14price $167,000
-
2023-12-19$170,500 Active
-
2022-07-05soldstatus $150,000
-
2022-07-01soldstatus $150,000 Sold
-
2022-04-30status Pending
-
2022-04-25$149,900 Active
-
2007-12-14soldstatus $40,000
-
2001-08-24soldstatus $14,000
ⓘ Source: listings_history table (triggers on properties + properties_extension) + one-shot
backfill from property_details.listing_events for pre-trigger history.
Tax reassessment forecast OK · Resets to sale price
- Current annual tax
- $1,787 · $149/mo
- Projected year-2 tax
- $1,787 · $149/mo
- Expected delta
- $0/yr ($0/mo · 0.0%)
ⓘ Screening estimate from a state-policy table — verify with the county assessor before closing.
Climate risk First Street
- Flood 6/10 Major FEMA zone AE · 75% chance over 30 yrs
- Wildfire 5/10 Major
- Heat 6/10 Major 7 d/yr ≥109°F today · 19 d/yr by 30 yrs out
- Wind 3/10 Moderate 7% chance of damaging wind over 30 yrs
- Air quality 2/10 Low 1 unhealthy d/yr today · 2 by 30 yrs out
Nearby sold comps map
Loading sold comps map…
Walkable amenities ~0.75 mi
Loading nearby amenities…
Taxation est. · year 1
- Rental income
- $16,863
- − Mortgage interest
- −$6,399
- − Property taxes
- −$1,787
- − Insurance
- −$5,690
- − Repairs & maintenance
- −$1,349
- − Management
- −$1,349
- − Depreciation
- −$3,323
- Taxable loss
- −$3,034
- Est. tax savings @ 24.0%
- +$728
- After-tax cash flow
- $-615/yr
For passive investors: Depreciation is non-cash, so a rental often shows a tax loss while cash-flowing — sheltering income. Rental losses are passive: they offset passive income freely, and up to $25,000/yr can offset ordinary (W-2) income if you actively participate and your MAGI is under $100k (phasing out to $0 by $150k); unused losses carry forward. On sale, claimed depreciation is recaptured at up to 25%, and gains may owe capital-gains tax (a 1031 exchange can defer both). Figures are a year-1 estimate at your 24.0% rate — not tax advice; consult a CPA.
Schools (NCES district)
- District
- Alex
- NCES district ID
- 4002670
- Math proficiency
- 50% ▲ 10.00%
- Reading proficiency
- 50% ▲ 10.00%
- Median HH income
- $45,715
- Composite
- 44.4/100
- National rank
- #6116
- State rank
- #36 of 513 in OK
Livability — Alex
- Score
- 57/100
- State rank
- #474
- US rank
- #21996
Category grades
Schools grade is shown separately in the Schools card above.
Census & demographics
- Census place
- Alex, OK
- Population (ZIP)
- 1,123
Population outlook (Grady County) Hauer SSP2
- Today (2025)
- 59,962 people
- By 2030
- 62,513 · +4.3%
- By 2040
- 67,338 · +12.3%
- By 2050
- 71,719 · +19.6%
- By 2075
- 82,684 · +37.9%
- By 2100
- 89,387 · +49.1%
Race, ethnicity, and origin ACS 2023
- Neighborhood character
- Predominantly White (78%)
- Race & ethnicity
- White 78% Two or more races 14% Native American 4% Hispanic / Latino 2% Black 1% Asian 1%
- Common ancestry
- Lithuanian 7% Romanian 2% Portuguese 1%
- Foreign-born
- 2% · China, Canada
- Languages at home
- 98% English-only · Chinese 1% Spanish 1%
Political lean MEDSL · Grady
- 2024 margin
- Solid R (+62.7) · D 17.9% · R 80.6% · Other 1.5%
- 2008→2024 swing
- -16.0pp toward R · 2008: -46.7pp · 2024: -62.7pp
- All cycles
- 2024: R+62.7 2020: R+62.3 2016: R+60.3 2012: R+51.2 2008: R+46.7
Not yet ingested
- Civics
- —
Market trends
- HPI YoY
- —
- Current HPI
- —
- Rent YoY
- —
- Metro
- —
- State GDP YoY
- ▲ 1.55%
- F500 in state
- 6
Industry mix (Fortune 500 HQ in OK)
| Industry | F500 HQs | Revenue |
|---|---|---|
| Energy | 3 | $48B |
|
||
Price history
+716.0% since first listed27 events — show timeline
- 2026-05-14 Listed $114,240 MLSOK
- 2026-04-14 Listing Removed — MLSOK
- 2026-04-02 Price Changed $114,240 MLSOK
- 2026-01-26 Relisted — MLSOK
- 2026-01-09 Pending — MLSOK
- 2025-10-18 Price Changed $119,000 MLSOK
- 2025-10-13 Listed $122,709 MLSOK
- 2025-09-19 Listing Removed — MLSOK
- 2025-06-27 Price Changed $122,709 MLSOK
- 2025-03-31 Price Changed $126,503 MLSOK
- 2025-02-08 Price Changed $133,161 MLSOK
- 2024-12-18 Price Changed $138,710 MLSOK
- 2024-11-27 Price Changed $143,000 MLSOK
- 2024-10-15 Price Changed $149,000 MLSOK
- 2024-09-24 Listed $153,780 MLSOK
- 2024-09-07 Listing Removed — MLSOK
- 2024-08-28 Price Changed $153,780 MLSOK
- 2024-07-12 Price Changed $157,780 MLSOK
- 2024-04-01 Price Changed $161,000 MLSOK
- 2024-02-14 Price Changed $167,000 MLSOK
- 2023-12-19 Listed $170,500 MLSOK
- 2022-07-05 Sold (Public Records) $150,000 Public Records
- 2022-07-01 Sold (MLS) $150,000 MLSOK
- 2022-04-30 Pending — MLSOK
- 2022-04-25 Listed $149,900 MLSOK
- 2007-12-14 Sold (Public Records) $40,000 Public Records
- 2001-08-24 Sold (Public Records) $14,000 Public Records
Property tax history
+13.8%/yrLatest (2025): $1,787 · +5.2% YoY. Source: county tax records.
Cash-flow waterfall
monthlySold comps — $/sqft
last 12 mo · ≤1 miLoading sold comps…