129 Corner Aly · Bristol, VA
Flood risk 1/10 · Minimal
- FEMA flood zone
- X (unshaded)
- Chance of flooding over 30 yrs
- 0.0%
- Est. flood insurance / yr
- $507 – $1,088
Fire risk 3/10 · Minor
- Est. fire insurance / yr
- $666 – $1,236
Heat risk 5/10 · Moderate
- Hot days now (above 98°F)
- 8 days/yr
- Hot days in 30 yrs
- 24 days/yr
Wind risk 2/10 · Minimal
- Chance of severe wind over 30 yrs
- —
Air-quality risk 2/10 · Minimal
- Unhealthy air days now
- 1 days/yr
- Unhealthy air days in 30 yrs
- 2 days/yr
Risk factors via First Street. Map © Google.
Why this score? — see what drove the D+ grade
The composite is a weighted blend of 9 inputs, each scored 0–100. Each bar is that input's sub-score; the figure is the points it added to the 100-point composite (weight × sub-score).
- Cash flow +15.0/30.0
- ARV discount +7.5/15.0
- Schools +5.2/10.0
- 1% rule +5.0/10.0
- DSCR +5.0/10.0
- Livability +3.7/5.0
- Rent growth +2.5/5.0
- Condition / age +2.5/5.0
- Appreciation +0.0/10.0
$28,000
🖨 Deal sheet (PDF) 📄 Offer letter ✓ Due diligence
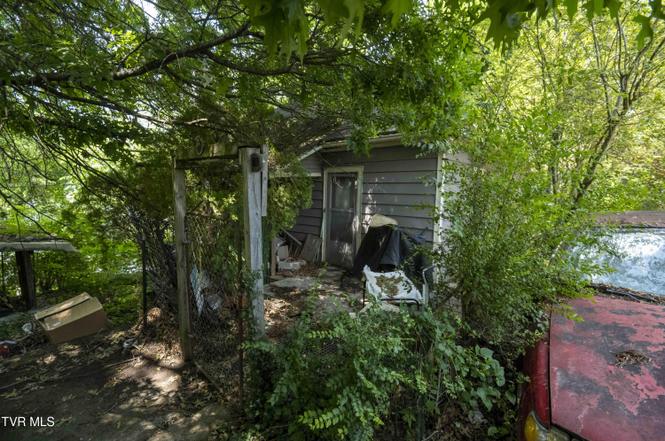
Listing remarks
Sold as is with all remaining contents-- Bring your imagination your work gloves and get ready to fill the dumpster. Located on quiet back alley in downtown Bristol just off Euclid Avenue convenient to shopping, casino and all of downtown Bristol. Potential for a small rental or flip.
Key facts
- 3,920 sq ft lot
- Built 1911
- Listed 3 days
Property features AI
Finance
- Other: Lot dimensions approximately 82 x 47; Lot area about 0.09 acres
- Financial info: No financial details provided
- HOA & community: No HOA information provided
Exterior
- Parking: No parking details provided
- Security: No security details provided
- Utilities: Public water; Public sewer
- Home design: Single-family residence; One story; Residential property; Not in a subdivision; Zoned residential
- Construction: House with vinyl siding and plaster; Built with traditional foundation (not specified); Year built not provided
- Exterior features: Shingle roof; Sloped topography
Interior
- Kitchen: No kitchen appliance details provided
- Bedrooms: Not specified
- Flooring: No flooring details provided
- Bathrooms: 1 full bathroom
- Heating & cooling: Has cooling (type listed as Other); No heating
- Interior features: Total of 4 rooms; Fixer condition
- Laundry & utility: No laundry details provided
Neighborhood map
What this means for you Summary
Snapshot
- This is a 2-bed/1.0-bath single-family listed at $28k.
Deal economics
- At list price, monthly cash flow is $1k ($13k/yr) — positive.
- The deal already cash-flows at list — no discount required.
- Meets the 1% rule at list price ($2k rent vs $28k).
- Cap rate 52.0% vs local median 4.9% in Bristol — top-decile yield for the area; either an underpriced asset or a hidden risk that comps aren't pricing in. Stress-test before assuming the spread holds.
Location & tenants
- Location reads 74/100 on livability (#140 in VA, #4,544 nationally) — a middle-class / working-renter tenant base. Strengths: cost of living A+, housing A+, health & safety A+; Watch: crime F, commute F, employment F.
- Bristol City Public School District (urban): math 57% / reading 70% proficiency, ranked #53 of 131 in VA (top 40%) — acceptable for families but not a draw, mixed tenant base, ~2y average lease.
- Zoned schools: Washington-Lee Elementary (math 62% / reading 62%, grade B, #480 of 1,108 statewide, top 46%, 224 students, 98% FRL); Virginia High (math 62% / reading 77%, grade B, #159 of 319 statewide, top 53%, 637 students, 100% FRL) — zoned schools average 99% FRL vs 58% district-wide (41 pts higher); higher-poverty schools than district average — tighter screening recommended.
- Market conditions: 156 active listings in the ZIP; 14 comparable units currently listed for rent nearby; rentals at typical pace (median 14d on market — plan ~3-4 weeks tenant-placement turnaround); 15 units permitted in Bristol city in 2024 (5 in 5+ unit buildings).
Forward outlook
- Local home prices are declining (-3.0%/yr); year-one equity from $194 of loan paydown is wiped out by about $840 of value loss. Plan a longer hold.
- Bristol County population projected at -20% by 2050 — secular population decline; favor cash flow + early exit over multi-decade hold.
- At projected returns (-3.0% appreciation + 3.0% rent growth), your $8k cash investment doubles in ~1 year — after that, you're playing with house money.
Negotiation context
- Only 4 days on market — expect competitive offers; lowballing is unlikely to land.
- Current owner paid $18k; list at $28k implies a 56% gain — meaningful room to come down on a strong offer.
Risks & watch-outs
- Watch-outs: built in 1911 — expect roof / HVAC / electrical / plumbing capex.
- Climate carrying-cost: extreme-heat days projected 8→24/yr by 2055 (HVAC capex compounding) — expect insurance premiums to compound above CPI over the hold.
Questions for the listing agent
- Built in 1911 — when were the roof, HVAC, electrical panel, plumbing, and water heater last replaced?
- Is there a deadline driving the sale (1031 exchange, divorce, estate, relocation)? That informs how much negotiation room exists.
- Schools are A-rated — typically a magnet for longer-tenancy family renters. What's the average tenant stay here, and is there a school-zone premium baked into asking?
- Crime grade is F in this area — have there been break-ins, vandalism, or insurance claims at this property in the last 3 years? What carrier currently insures it and at what premium?
- The area grade is low — what's the realistic commute time and amenity access for the typical tenant pool here? Any planned neighborhood developments (good or bad) we should know about?
- What's the average days-on-market for RENTAL listings here right now (not sales)? A rising rental-DOM trend means longer vacancies and softer asking-rent achievability than the comps imply.
- What's the recent tenant-quality profile in this submarket — average credit score on applications, eviction rate, late-payment / NSF rate, and stable-employment percentage? A property-management company in the area should have these aggregated.
- How much new for-sale + rental construction is in the pipeline within 1–3 miles? Heavy new supply typically softens prices + rents 12–24 months out; constrained supply supports both.
Investment metrics
- 1% rule
- 5.63% ✓
- Cap rate
- 52.02%
- Cash-on-cash
- 163.30%
- DSCR
- 8.27
- GRM
- 1.5
CMA / ARV
- ARV (on-the-fly)
- $179,832
- Comps found
- 12
Show comp detail 12 sales within ~0.75 mi
| Address | Dist | Beds/Ba | Sqft | Sold | Price | $/sf | Match |
|---|---|---|---|---|---|---|---|
| 146 Cades Aly | 0.06mi | 2/1.0 | 939 (-8%) | 0mo | $182,000 | $194 | 84 |
| 815 Vernon St | 0.25mi | 2/1.0 | 1,053 (+4%) | 4mo | $193,700 | $184 | 79 |
| 146 Westin Dr | 0.26mi | 2/1.0 | 955 (-6%) | 6mo | $100,000 | $105 | 73 |
| 608 Pearl St | 0.13mi | 2/1.0 | 946 (-7%) | 18mo | $167,000 | $177 | 68 |
| 416 Randolph St | 0.57mi | 2/1.0 | 962 (-5%) | 2mo | $205,000 | $213 | 62 |
| 329 Magnolia Dr | 0.68mi | 2/1.0 | 945 (-7%) | 1mo | $144,000 | $152 | 56 |
| 144 Crescent Dr | 0.48mi | 3/1.5 (+1) | 1,098 (+8%) | 8mo | $126,800 | $115 | 50 |
| 276 Spurgeon Ln | 0.61mi | 2/1.0 | 911 (-10%) | 9mo | $60,000 | $66 | 47 |
| 1505 Norway St | 0.65mi | 3/1.0 (+1) | 1,120 (+10%) | 1mo | $165,000 | $147 | 46 |
| 213 Hill Dr | 0.57mi | 2/1.0 | 921 (-9%) | 15mo | $205,000 | $223 | 45 |
| 138 Keys St | 0.65mi | 2/2.0 | 1,076 (+6%) | 16mo | $190,000 | $177 | 43 |
| 728 Randolph St | 0.73mi | 3/1.0 (+1) | 1,104 (+9%) | 5mo | $144,000 | $130 | 42 |
Match score weights: distance 35% · size 25% · config 20% · recency 20%. Top-matched comps best support the ARV.
Projected returns pro-forma
-3.0% appreciation · 3.0% rent growth · sell at horizon
- IRR
- —
- Equity multiple
- 9.09×
- Total profit
- $63,429
- Equity at exit
- $4,175
- IRR
- —
- Equity multiple
- 19.21×
- Total profit
- $142,789
- Equity at exit
- $2,421
Cash invested: $7,840 (down + closing). Projections, not guarantees.
Landlord ↔ Tenant lean methodology
- Overall (STATE)
- 55 Moderately Landlord-Leaning
- State Virginia
- 55 Moderately Landlord-Leaning · D+2
- County
- — inherits STATE
- City
- — inherits STATE
ZIP-level market 24201
- Active inventory
- 156
- Price-to-rent
- 1.5×
Monthly cashflow live
- Estimated rent
- $1,576 high interval (Pro) →
- Mortgage (P&I)
- −$147
- Tax from tax record
- −$20 /mo · $235/yr
- Insurance
- −$12
- HOA
- −$0
- Vacancy / Maint / Mgmt
- −$331
- Net cashflow
- $1,067
Break-even live
Sensitivity live
| Price | -10% $1,083 | -5% $1,075 | +0% $1,067 | +5% $1,059 | +10% $1,051 |
|---|---|---|---|---|---|
| Rent | -10% $942 | -5% $1,005 | +0% $1,067 | +5% $1,129 | +10% $1,191 |
| Rate | -1.0pp $1,081 | -0.5pp $1,074 | base $1,067 | +0.5pp $1,060 | +1.0pp $1,052 |
UW: 25.0% down · 7.5% · 30yr · 1.5% tax · 5.0% vac · 8.0% maint · 8.0% mgmt
Financing live
Cash to close
- Down payment
- $7,000
- Closing costs
- $840
- Reserves months
- —
- Total cash needed
- —
Loan-product check · same deal, 3 products live
Conventional
25% down · 7.5% · 30yr
- Down + closing
- —
- Monthly P&I
- —
- Monthly cashflow
- —
- DSCR
- —
- Eligible?
- —
Personal DTI + credit; lowest rate.
DSCR
20% down · 8.5% · 30yr
- Down + closing
- —
- Monthly P&I
- —
- Monthly cashflow
- —
- DSCR
- —
- Eligible?
- —
No personal income docs; deal must DSCR.
Hard money
10% down · 12.0% · 12mo
- Down + closing
- —
- Monthly P&I
- —
- Monthly cashflow
- —
- DSCR
- —
- Eligible?
- —
Short-term bridge; refi at stabilization.
Rent comps 14 comps
| Address | Beds | Baths | Sqft | Rent | $/sqft | DOM | Units | Dist |
|---|---|---|---|---|---|---|---|---|
| 1216 Norway St Unit 102 Bristol, VA | 2.0 | 1.0 | 1215 | $1,600 | $1.32 | 14d | 1 | 0.53mi |
| 816 Goode St Bristol, VA | 1.0 | 1.0 | 822 | $2,000 | $2.43 | 14d | 1 | 0.54mi |
| 1405 Newton St Bristol, VA | 3.0 | 1.0 | 1200 | $1,600 | $1.33 | 14d | 1 | 0.64mi |
| 1136 Moorland Ave Bristol, VA | 2.0 | 1.0 | 936 | $1,250 | $1.34 | 44d | 1 | 0.88mi |
| 203 Opal Ln Unit 4 Bristol, VA | 2.0 | 1.5 | 1200 | $1,500 | $1.25 | 22d | 1 | 0.97mi |
| 308 Emerald Dr Unit 308 Bristol, VA | 2.0 | 1.5 | 970 | $1,200 | $1.24 | 44d | 1 | 1.01mi |
| 1156 Bristol View Dr Bristol, VA | 2.0 | 2.5 | 1152 | $1,650 | $1.43 | 14d | 2 | 1.13mi |
| 135 Kingsolver St Bristol, VA | 2.0 | 1.0 | 1000 | $1,400 | $1.40 | 22d | 1 | 1.20mi |
| 2114 Broad St Bristol, TN | 2.0 | 1.0 | 1000 | $1,600 | $1.60 | 14d | 1 | 1.24mi |
| 2505 Catherine St Bristol, VA | 2.0 | 1.0 | 849 | $1,600 | $1.88 | 14d | 1 | 1.34mi |
| 2510 Catherine St Bristol, VA | 3.0 | 2.0 | 1418 | $2,500 | $1.76 | 14d | 1 | 1.35mi |
| 145 Midway St Unit 1397968P Bristol, VA | 3.0 | 2.0 | 1388 | $5,335 | $3.84 | 22d | 1 | 1.39mi |
| 279 Reservoir St Bristol, VA | 3.0 | 1.5 | 1300 | $1,600 | $1.23 | 14d | 1 | 1.46mi |
| 235 Carson Ct Bristol, TN | 1.0 | 1.0 | 800 | $850 | $1.06 | 45d | 1 | 1.46mi |
Listing history 5 events
-
2026-06-19days on market $28,000 Active 4 DOM
-
2026-06-18days on market $28,000 Active 3 DOM
-
2026-06-17days on market $28,000 Active 2 DOM
-
2026-06-15remarks 286-char remark
-
2026-06-15$28,000 Active 1 DOM
ⓘ Source: listings_history table (triggers on properties + properties_extension) + one-shot
backfill from property_details.listing_events for pre-trigger history.
Tax reassessment forecast VA · Resets to sale price
- Current annual tax
- $235 · $20/mo
- Projected year-2 tax
- $235 · $20/mo
- Expected delta
- $0/yr ($0/mo · 0.0%)
ⓘ Screening estimate from a state-policy table — verify with the county assessor before closing.
Climate risk First Street
- Flood 1/10 Low FEMA zone X (unshaded) · 0% chance over 30 yrs
- Wildfire 3/10 Moderate
- Heat 5/10 Major 8 d/yr ≥98°F today · 24 d/yr by 30 yrs out
- Wind 2/10 Low
- Air quality 2/10 Low 1 unhealthy d/yr today · 2 by 30 yrs out
Nearby sold comps map
Loading sold comps map…
Walkable amenities ~0.75 mi
Loading nearby amenities…
Taxation est. · year 1
- Rental income
- $18,911
- − Mortgage interest
- −$1,568
- − Property taxes
- −$235
- − Insurance
- −$140
- − Repairs & maintenance
- −$1,513
- − Management
- −$1,513
- − Depreciation
- −$815
- Taxable income
- $13,127
- Est. tax owed @ 24.0%
- −$3,151
- After-tax cash flow
- $9,652/yr
For passive investors: Depreciation is non-cash, so a rental often shows a tax loss while cash-flowing — sheltering income. Rental losses are passive: they offset passive income freely, and up to $25,000/yr can offset ordinary (W-2) income if you actively participate and your MAGI is under $100k (phasing out to $0 by $150k); unused losses carry forward. On sale, claimed depreciation is recaptured at up to 25%, and gains may owe capital-gains tax (a 1031 exchange can defer both). Figures are a year-1 estimate at your 24.0% rate — not tax advice; consult a CPA.
Schools (NCES district)
- District
- Bristol City Public School District
- NCES district ID
- 5100450
- Math proficiency
- 57% ▼ -24.00%
- Reading proficiency
- 70% ▼ -6.00%
- Median HH income
- $33,978
- Composite
- 52.4/100
- National rank
- #1579
- State rank
- #53 of 131 in VA
Livability — Bristol
- Score
- 74/100
- State rank
- #140
- US rank
- #4544
Category grades
Schools grade is shown separately in the Schools card above.
Census & demographics
- Census place
- Bristol, VA
- City population
- 16,039
- Population (ZIP)
- 16,039
Population outlook (Bristol County) Hauer SSP2
- Today (2025)
- 16,113 people
- By 2030
- 15,510 · -3.7%
- By 2040
- 14,121 · -12.4%
- By 2050
- 12,847 · -20.3%
- By 2075
- 9,870 · -38.7%
- By 2100
- 7,883 · -51.1%
Race, ethnicity, and origin ACS 2023
- Neighborhood character
- Predominantly White (85%)
- Race & ethnicity
- White 85% Black 7% Two or more races 6% Hispanic / Latino 3%
- Common ancestry
- Slovak 4% Serbian 1% Iranian 0%
- Foreign-born
- 1% · Canada
- Languages at home
- 98% English-only · Spanish 2%
Political lean MEDSL · Bristol
- 2024 margin
- Solid R (+39.7) · D 29.8% · R 69.5%
- 2008→2024 swing
- -13.6pp toward R · 2008: -26.0pp · 2024: -39.7pp
- All cycles
- 2024: R+39.7 2020: R+38.9 2016: R+43.8 2012: R+31.1 2008: R+26.0
Not yet ingested
- Civics
- —
Market trends
- HPI YoY
- ▼ -206.40%
- Current HPI
- 196.2099
- Rent YoY
- —
- Metro
- —
- State GDP YoY
- ▲ 2.40%
- F500 in state
- 50
Industry mix (Fortune 500 HQ in VA)
| Industry | F500 HQs | Revenue |
|---|---|---|
| Aerospace / Defense | 4 | $236B |
|
||
| Technology / Defense | 3 | $32B |
|
||
| Financial Services | 2 | $176B |
|
||
| Utilities | 2 | $27B |
|
||
| Insurance | 2 | $25B |
|
||
| Technology | 2 | $15B |
|
||
Price history
+55.6% since first listed2 events — show timeline
- 2026-06-12 Listed $28,000 TVRMLS
- 1994-10-01 Sold (Public Records) $18,000 Public Records
Cash-flow waterfall
monthlySold comps — $/sqft
last 12 mo · ≤1 miLoading sold comps…