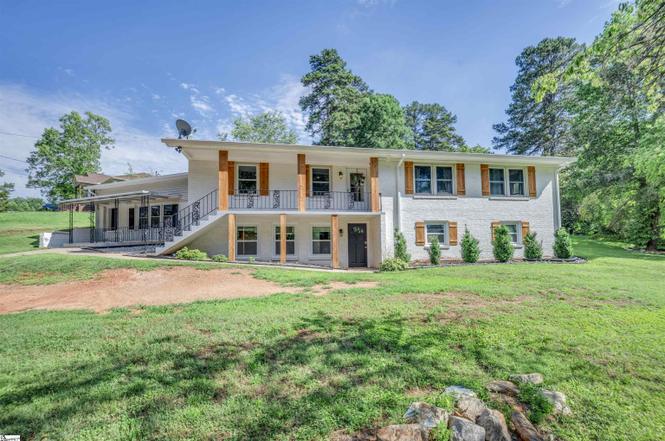
301 Fairmont Dr · Gantt, SC
Flood risk 1/10 · Minimal
- FEMA flood zone
- X (unshaded)
- Chance of flooding over 30 yrs
- 0.0%
- Est. flood insurance / yr
- $473 – $860
Fire risk 1/10 · Minimal
- Est. fire insurance / yr
- $783 – $1,453
Heat risk 5/10 · Moderate
- Hot days now (above 102°F)
- 7 days/yr
- Hot days in 30 yrs
- 17 days/yr
Wind risk 2/10 · Minimal
- Chance of severe wind over 30 yrs
- 1.0%
Air-quality risk 4/10 · Minor
- Unhealthy air days now
- 4 days/yr
- Unhealthy air days in 30 yrs
- 4 days/yr
Risk factors via First Street. Map © Google.
Why this score? — see what drove the D+ grade
The composite is a weighted blend of 9 inputs, each scored 0–100. Each bar is that input's sub-score; the figure is the points it added to the 100-point composite (weight × sub-score).
- Cash flow +14.8/30.0
- ARV discount +7.5/15.0
- Appreciation +5.0/10.0
- DSCR +4.5/10.0
- Schools +4.2/10.0
- Livability +3.5/5.0
- 1% rule +3.1/10.0
- Rent growth +2.5/5.0
- Condition / age +2.5/5.0
$285,000
🖨 Deal sheet 📄 Offer letter ✓ Due diligence
Listing remarks MLS
This house has a new roof and new thermal windows. Beautiful basement for a get away, tons of space with three fireplaces and one outside. Must see to appreciate. This property is way under prices for the square footage - great established neighborhood. Agent to verify square footage.
Key facts
- Walkout lower level
- Fenced backyard
- Corner lot
Tags
Property features AI
Finance
- HOA & community: No HOA fees or community amenities
Exterior
- Parking: Driveway parking; Circular paved concrete driveway
- Utilities: Public water; Public sewer; Electric power; Private garbage pickup
- Home design: One story with basement; Built around 1960; Partial brick veneer and vinyl siding exterior; Architectural roof; Residential property disclosures required (including lead-based paint discovery)
- Construction: Sump pump and basement foundation
- Exterior features: Front porch; Patio; Corner lot with some trees; Fenced yard; Lot slopes gently
Interior
- Kitchen: Cooktop (gas); Gas oven; Range hood; Dishwasher; Disposal; Microwave; Refrigerator; Kitchen size about 15 x 12; Second kitchen/kitchenette in finished basement
- Bedrooms: Three main-level bedrooms; Primary bedroom on main level with full bath and shower-only; Primary bedroom approximately 12 x 14; Second bedroom approximately 12 x 12; Third bedroom approximately 12 x 12; Additional bedroom-sized room 16 x 10
- Flooring: Hardwood floors; Ceramic tile
- Bathrooms: Three full bathrooms total; Two full bathrooms on the main level
- Heating & cooling: Electric heating; Central forced air cooling (electric); Electric water heater
- Interior features: Attic stairs (permanent and disappearing); Cable available; Ceiling fans; Smooth ceilings; Granite countertops; Open floor plan; In-law suite; Dual master bedrooms; Second living quarters in basement with separate entrance and kitchenette; Basement interior access with sump pump and walkout; Unfinished space available; Attic and outbuilding storage
- Laundry & utility: Main-level laundry with walk-in layout
Neighborhood map
What this means for you Summary
Snapshot
- This is a 4-bed/3.0-bath single-family listed at $285k.
Deal economics
- At list price, monthly cash flow is $77 ($923/yr) — positive.
- The deal already cash-flows at list — no discount required.
- To meet the 1% rule (rent ≥ 1% of price), the offer needs to be $230k (19.3% below list).
- Recommended offer: $230k (19.3% below list) — sets the bar for 1% rule.
Location & tenants
- Location reads 69/100 on livability (#73 in SC) — a middle-class / working-renter tenant base. Strengths: cost of living A+, housing A+, commute B+; Watch: crime D+, amenities F, employment F.
- Greenville 01 (suburban): math 44% / reading 54% proficiency, ranked #10 of 80 in SC (top 12%) — families likely to look elsewhere, expect single-tenant / working-renter base with shorter leases.
- Zoned schools: Grove Elementary (math 27% / reading 26%, grade F, #435 of 597 statewide, top 73%, 639 students, 100% FRL) — zoned schools average 100% FRL vs 42% district-wide (58 pts higher); higher-poverty schools than district average — tighter screening recommended.
- Zoned-school proficiency averages 26% at this address vs 49% district-wide (-22 pts) — the specific schools serving this property underperform the Greenville 01 average; the district grade overstates school quality for this exact location.
- Market conditions: 1 active listings in the ZIP; 1 comparable units currently listed for rent nearby; 5,595 units permitted in Greenville County in 2024 (566 in 5+ unit buildings).
Forward outlook
- In year one you build about $11k of equity ($2k loan paydown + $9k appreciation (3.0% local appreciation)).
- Greenville County population projected at +34% by 2050 — long-run rental-demand tailwind backs the buy-and-hold thesis.
- At projected returns (3.0% appreciation + 3.0% rent growth), your $80k cash investment doubles in ~6 years — after that, you're playing with house money.
- By year 4, paydown + projected appreciation supports a ~$36k cash-out refi (75% LTV) — recoverable capital for the next deal without selling this one.
Negotiation context
- Only 1 days on market — expect competitive offers; lowballing is unlikely to land.
- 2 sale attempts since 10y ago with the ask held roughly flat each time — persistent listings suggest the price (not the market) is what's stuck; bring a comps-based counter.
- Current owner paid $149k; list at $285k implies a 91% gain — meaningful room to come down on a strong offer.
Risks & watch-outs
- Climate carrying-cost: extreme-heat days projected 7→17/yr by 2055 (HVAC capex compounding) — expect insurance premiums to compound above CPI over the hold.
Questions for the listing agent
- Built in 1960 — when were the roof, HVAC, electrical panel, plumbing, and water heater last replaced?
- Is there a deadline driving the sale (1031 exchange, divorce, estate, relocation)? That informs how much negotiation room exists.
- Schools are F-rated, which usually means shorter tenancies and higher turnover. Who's the typical renter profile here, and what's been the actual vacancy rate?
- Crime grade is D in this area — have there been break-ins, vandalism, or insurance claims at this property in the last 3 years? What carrier currently insures it and at what premium?
- The area grade is low — what's the realistic commute time and amenity access for the typical tenant pool here? Any planned neighborhood developments (good or bad) we should know about?
- What's the average days-on-market for RENTAL listings here right now (not sales)? A rising rental-DOM trend means longer vacancies and softer asking-rent achievability than the comps imply.
- What's the recent tenant-quality profile in this submarket — average credit score on applications, eviction rate, late-payment / NSF rate, and stable-employment percentage? A property-management company in the area should have these aggregated.
- How much new for-sale + rental construction is in the pipeline within 1–3 miles? Heavy new supply typically softens prices + rents 12–24 months out; constrained supply supports both.
Investment metrics
- 1% rule
- 0.81% ✗
- Cap rate
- 6.62%
- Cash-on-cash
- 1.16%
- DSCR
- 1.05
- GRM
- 10.3
CMA / ARV
No comps found within radius.
Projected returns pro-forma
3.0% appreciation · 3.0% rent growth · sell at horizon
- IRR
- 8.6%
- Equity multiple
- 1.49×
- Total profit
- $39,124
- Equity at exit
- $128,148
- IRR
- 11.1%
- Equity multiple
- 2.66×
- Total profit
- $132,313
- Equity at exit
- $197,492
Cash invested: $79,800 (down + closing). Projections, not guarantees.
Landlord ↔ Tenant lean methodology
- Overall (STATE)
- 90 Strongly Landlord-Friendly
- State South Carolina
- 90 Strongly Landlord-Friendly · R+6
- County
- — inherits STATE
- City
- — inherits STATE
ZIP-level market 29605-2538
- Active inventory
- 1
- Price-to-rent
- 10.3×
Monthly cashflow live
- Estimated rent
- $2,300 medium interval (Pro) →
- Mortgage (P&I)
- −$1,495
- Tax from tax record
- −$127 /mo · $1,521/yr
- Insurance
- −$119
- HOA
- −$0
- Vacancy / Maint / Mgmt
- −$483
- Net cashflow
- $77
Break-even live
UW: 25.0% down · 7.5% · 30yr · 1.5% tax · 5.0% vac · 8.0% maint · 8.0% mgmt
Financing live
Cash to close
- Down payment
- $71,250
- Closing costs
- $8,550
- Reserves months
- —
- Total cash needed
- —
Loan-product check · same deal, 3 products live
Conventional
25% down · 7.5% · 30yr
- Down + closing
- —
- Monthly P&I
- —
- Monthly cashflow
- —
- DSCR
- —
- Eligible?
- —
Personal DTI + credit; lowest rate.
DSCR
20% down · 8.5% · 30yr
- Down + closing
- —
- Monthly P&I
- —
- Monthly cashflow
- —
- DSCR
- —
- Eligible?
- —
No personal income docs; deal must DSCR.
Hard money
10% down · 12.0% · 12mo
- Down + closing
- —
- Monthly P&I
- —
- Monthly cashflow
- —
- DSCR
- —
- Eligible?
- —
Short-term bridge; refi at stabilization.
Rent comps 1 comps
| Address | Beds | Baths | Sqft | Rent | $/sqft | DOM | Units | Dist |
|---|---|---|---|---|---|---|---|---|
| 140 Clairvale Ct , SC | 5.0 | 3.0 | 2400 | $2,300 | $0.96 | 23d | 1 | 0.40mi |
Listing history 2 events
-
2026-06-18remarks 699-char remark
-
2026-06-18$285,000 Active 1 DOM
ⓘ Source: listings_history table (triggers on properties + properties_extension) + one-shot
backfill from property_details.listing_events for pre-trigger history.
Tax reassessment forecast SC · Resets to sale price
- Current annual tax
- $1,521 · $127/mo
- Projected year-2 tax
- $1,624 · $135/mo
- Expected delta
- +$103/yr (+$9/mo · 6.8%)
ⓘ Screening estimate from a state-policy table — verify with the county assessor before closing.
Climate risk First Street
- Flood 1/10 Low FEMA zone X (unshaded) · 0% chance over 30 yrs
- Wildfire 1/10 Low
- Heat 5/10 Major 7 d/yr ≥102°F today · 17 d/yr by 30 yrs out
- Wind 2/10 Low 100% chance of damaging wind over 30 yrs
- Air quality 4/10 Moderate 4 unhealthy d/yr today · 4 by 30 yrs out
Nearby sold comps map
Loading sold comps map…
Walkable amenities ~0.75 mi
Loading nearby amenities…
Taxation est. · year 1
- Rental income
- $27,600
- − Mortgage interest
- −$15,964
- − Property taxes
- −$1,521
- − Insurance
- −$1,425
- − Repairs & maintenance
- −$2,208
- − Management
- −$2,208
- − Depreciation
- −$8,291
- Taxable loss
- −$4,018
- Est. tax savings @ 24.0%
- +$964
- After-tax cash flow
- $1,887/yr
For passive investors: Depreciation is non-cash, so a rental often shows a tax loss while cash-flowing — sheltering income. Rental losses are passive: they offset passive income freely, and up to $25,000/yr can offset ordinary (W-2) income if you actively participate and your MAGI is under $100k (phasing out to $0 by $150k); unused losses carry forward. On sale, claimed depreciation is recaptured at up to 25%, and gains may owe capital-gains tax (a 1031 exchange can defer both). Figures are a year-1 estimate at your 24.0% rate — not tax advice; consult a CPA.
Schools (NCES district)
- District
- Greenville 01
- NCES district ID
- 4502310
- Math proficiency
- 44% ▼ -10.00%
- Reading proficiency
- 54% ▼ -2.00%
- Median HH income
- $49,596
- Composite
- 41.88/100
- National rank
- #3370
- State rank
- #10 of 80 in SC
Livability — Gantt
- Score
- 69/100
- State rank
- #73
- US rank
- #8663
Category grades
Schools grade is shown separately in the Schools card above.
Census & demographics
- Census place
- Gantt, SC
Population outlook (Greenville County) Hauer SSP2
- Today (2025)
- 574,580 people
- By 2030
- 615,615 · +7.1%
- By 2040
- 695,373 · +21.0%
- By 2050
- 769,367 · +33.9%
- By 2075
- 933,296 · +62.4%
- By 2100
- 1,029,196 · +79.1%
Not yet ingested
- Political lean
- —
- Race & ethnicity
- —
- Common origin
- —
- Civics
- —
Market trends
- HPI YoY
- —
- Current HPI
- —
- Rent YoY
- —
- Metro
- —
- State GDP YoY
- ▲ 4.51%
- F500 in state
- 2
Industry mix (Fortune 500 HQ in SC)
| Industry | F500 HQs | Revenue |
|---|---|---|
| Packaging | 1 | $7B |
|
||
Price history
+520.2% since first listed9 events — show timeline
- 2026-06-18 Listed $285,000 Greater Greenville MLS
- 2019-09-19 Sold (Public Records) $149,000 Public Records
- 2016-08-29 Sold (Public Records) $115,100 Public Records
- 2016-08-23 Sold (MLS) $115,000 Greater Greenville MLS
- 2016-06-20 Pending — Greater Greenville MLS
- 2016-06-09 Listed $115,000 Greater Greenville MLS
- 1989-05-04 Sold (Public Records) $49,900 Public Records
- 1983-08-26 Sold (Public Records) $32,900 Public Records
- 1978-10-01 Sold (Public Records) $45,950 Public Records
Property tax history
+2.8%/yrLatest (2025): $1,521 · +4.9% YoY. Source: county tax records.
Cash-flow waterfall
monthlySold comps — $/sqft
last 12 mo · ≤1 miLoading sold comps…