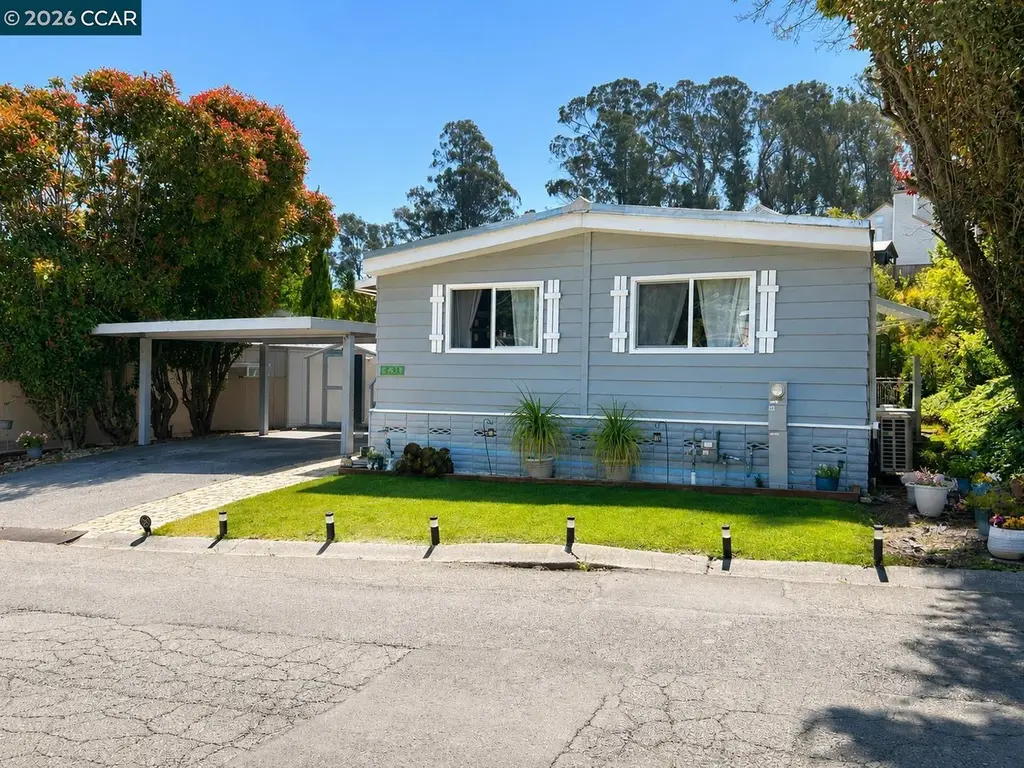
54 Kay Dr · Vallejo, CA
Flood risk 1/10 · Minimal
- FEMA flood zone
- X (unshaded)
- Chance of flooding over 30 yrs
- 0.0%
- Est. flood insurance / yr
- $507 – $1,088
Fire risk 1/10 · Minimal
- Est. fire insurance / yr
- $659 – $1,223
Heat risk 4/10 · Minor
- Hot days now (above 93°F)
- 7 days/yr
- Hot days in 30 yrs
- 14 days/yr
Wind risk 1/10 · Minimal
- Chance of severe wind over 30 yrs
- —
Air-quality risk 9/10 · Severe
- Unhealthy air days now
- 16 days/yr
- Unhealthy air days in 30 yrs
- 17 days/yr
Risk factors via First Street. Map © Google.
Why this score? — see what drove the D+ grade
The composite is a weighted blend of 9 inputs, each scored 0–100. Each bar is that input's sub-score; the figure is the points it added to the 100-point composite (weight × sub-score).
- Cash flow +21.2/30.0
- DSCR +6.8/10.0
- 1% rule +5.6/10.0
- Condition / age +4.0/5.0
- Livability +3.4/5.0
- Rent growth +2.7/5.0
- Schools +2.6/10.0
- ARV discount +0.0/15.0
- Appreciation +0.0/10.0
$235,000
🖨 Deal sheet (PDF) 📄 Offer letter ✓ Due diligence
Listing remarks MLS
You will love this manufactured home located in highly desirable Carquinez Highlands Mobile Home Park. Beautifully remolded 2 bedroom 2 bathroom, with brand new open concept kitchen with island, newer flooring throughout home, fresh paint, beautiful sunroom great for reading/storage, washer & dryer hookups, spacious living room, dining room & bedrooms, parking can fit up to 4 cars comfortably.
Key facts
- Quartz countertops
- Remodeled kitchen
- Abundant storage
Tags
Property features AI
Finance
- HOA & community: Pets allowed; Community clubhouse; Community pool
Exterior
- Parking: Carport
- Utilities: Public water; Public sewer
- Home design: Manufactured in park (mobile home); Double wide
- Construction: Aluminum siding
- Exterior features: Front yard; Back yard; Level lot
Interior
- Kitchen: Stone counters; Kitchen island; Garbage disposal; Gas range / cooktop; Updated kitchen
- Bedrooms: 2 bedrooms
- Flooring: Laminate flooring
- Bathrooms: 2 full bathrooms
- Heating & cooling: Heat pump heating; Heat pump cooling
- Interior features: Updated kitchen; Window coverings; No additional bonus rooms
- Laundry & utility: Laundry room with washer and dryer; Gas water heater
Neighborhood map
What this means for you Summary
Snapshot
- This is a 2-bed/2.0-bath manufactured listed at $235k. Condition is rated good.
Deal economics
- At list price, monthly cash flow is $341 ($4k/yr) — positive.
- The deal already cash-flows at list — no discount required.
- Meets the 1% rule at list price ($2k rent vs $235k).
- Recommended offer: $231k (1.5% below list) — sets the bar for market timing.
- Cap rate 8.0% vs local median 3.1% in Vallejo — top-decile yield for the area; either an underpriced asset or a hidden risk that comps aren't pricing in. Stress-test before assuming the spread holds.
Location & tenants
- Location reads 67/100 on livability (#304 in CA) — a middle-class / working-renter tenant base. Strengths: commute A+, housing A+, health & safety A+; Watch: schools D-, crime F, cost of living F.
- Vallejo City Unified (urban): math 20% / reading 30% proficiency, ranked #1,124 of 1,400 in CA (top 80%) — low school quality limits family demand, transient renter base, plan for 1-2y turnover; 62% free/reduced lunch — lower-income household profile, screen leases tightly.
- Market conditions: Rents flat; 176 active listings in the ZIP; 18 comparable units currently listed for rent nearby; rentals at typical pace (median 24d on market — plan ~3-4 weeks tenant-placement turnaround); 1,472 units permitted in Solano County in 2024 (131 in 5+ unit buildings).
- At $2,487/mo this rent would consume 46% of the median local household income ($65k/yr) (locally 2972% of renters already pay >50% of income on rent) — very limited rent-growth headroom before tenants either downsize or default.
Forward outlook
- Local home prices are declining (-3.0%/yr); year-one equity from $2k of loan paydown is wiped out by about $7k of value loss. Plan a longer hold.
- Solano County population projected at +15% by 2050 — modest demand growth; plan on rents tracking national, not racing it.
Negotiation context
- It's been on market 17 days — a 2% lower offer ($231k) is reasonable based on typical stale-listing flexibility.
- 2 sale attempts since 4y ago with the ask held roughly flat each time — persistent listings suggest the price (not the market) is what's stuck; bring a comps-based counter.
Questions for the listing agent
- Is there a deadline driving the sale (1031 exchange, divorce, estate, relocation)? That informs how much negotiation room exists.
- Schools are D-rated, which usually means shorter tenancies and higher turnover. Who's the typical renter profile here, and what's been the actual vacancy rate?
- Crime grade is F in this area — have there been break-ins, vandalism, or insurance claims at this property in the last 3 years? What carrier currently insures it and at what premium?
- The area grade is low — what's the realistic commute time and amenity access for the typical tenant pool here? Any planned neighborhood developments (good or bad) we should know about?
- What's the average days-on-market for RENTAL listings here right now (not sales)? A rising rental-DOM trend means longer vacancies and softer asking-rent achievability than the comps imply.
- What's the recent tenant-quality profile in this submarket — average credit score on applications, eviction rate, late-payment / NSF rate, and stable-employment percentage? A property-management company in the area should have these aggregated.
- How much new for-sale + rental construction is in the pipeline within 1–3 miles? Heavy new supply typically softens prices + rents 12–24 months out; constrained supply supports both.
Investment metrics
- 1% rule
- 1.06% ✓
- Cap rate
- 8.03%
- Cash-on-cash
- 6.21%
- DSCR
- 1.28
- GRM
- 7.9
CMA / ARV
- ARV (on-the-fly)
- $181,440
- Comps found
- 12
Show comp detail 12 sales within ~0.75 mi
| Address | Dist | Beds/Ba | Sqft | Sold | Price | $/sf | Match |
|---|---|---|---|---|---|---|---|
| 116 Kay Dr | 0.06mi | 2/2.0 | 1,440 (+7%) | 1mo | $192,000 | $133 | 84 |
| 87 Gloria Ct | 0.18mi | 2/2.0 | 1,440 (+7%) | 2mo | $255,000 | $177 | 78 |
| 92 Karen Ct | 0.07mi | 3/2.0 (+1) | 1,400 (+4%) | 10mo | $215,000 | $154 | 76 |
| 175 Freida Cir | 0.23mi | 2/2.0 | 1,440 (+7%) | 2mo | $235,000 | $163 | 76 |
| 173 Frieda Cir | 0.24mi | 2/2.0 | 1,440 (+7%) | 2mo | $199,000 | $138 | 75 |
| 20 Constance Dr | 0.26mi | 2/2.0 | 1,440 (+7%) | 1mo | $190,000 | $132 | 75 |
| 24 Constance Dr | 0.28mi | 2/2.0 | 1,440 (+7%) | 2mo | $115,000 | $80 | 73 |
| 123 Phyllis Ct #123 | 0.05mi | 3/2.0 (+1) | 1,440 (+7%) | 10mo | $195,000 | $135 | 72 |
| 30 Constance Dr | 0.27mi | 2/2.0 | 1,440 (+7%) | 4mo | $185,000 | $128 | 72 |
| 80 Gloria Ct | 0.12mi | 2/2.0 | 1,440 (+7%) | 13mo | $170,000 | $118 | 72 |
| 145 Ann Ct | 0.10mi | 2/2.0 | 1,152 (-14%) | 7mo | $189,000 | $164 | 66 |
| 83 Gloria Ct | 0.15mi | 2/2.0 | 1,536 (+14%) | 11mo | $128,500 | $84 | 60 |
Match score weights: distance 35% · size 25% · config 20% · recency 20%. Top-matched comps best support the ARV.
Projected returns pro-forma
-3.0% appreciation · 0.71% rent growth · sell at horizon
- IRR
- -9.3%
- Equity multiple
- 0.67×
- Total profit
- $-21,944
- Equity at exit
- $35,039
- IRR
- -3.3%
- Equity multiple
- 0.80×
- Total profit
- $-12,971
- Equity at exit
- $20,319
Cash invested: $65,800 (down + closing). Projections, not guarantees.
Landlord ↔ Tenant lean methodology
- Overall (STATE)
- 18 Strongly Tenant-Friendly
- State California
- 18 Strongly Tenant-Friendly · D+13
- County
- — inherits STATE
- City
- — inherits STATE
ZIP-level market 94590
- Rents YoY
- 0.7%
- Active inventory
- 176
- Price-to-rent
- 7.9×
Monthly cashflow live
- Estimated rent
- $2,487 high interval (Pro) →
- Mortgage (P&I)
- −$1,232
- Tax est. 1.5%
- −$294 /mo · $3,525/yr
- Insurance
- −$98
- HOA
- −$0
- Vacancy / Maint / Mgmt
- −$522
- Net cashflow
- $341
Break-even live
Sensitivity live
| Price | -10% $503 | -5% $422 | +0% $341 | +5% $260 | +10% $178 |
|---|---|---|---|---|---|
| Rent | -10% $144 | -5% $242 | +0% $341 | +5% $439 | +10% $537 |
| Rate | -1.0pp $459 | -0.5pp $400 | base $341 | +0.5pp $280 | +1.0pp $218 |
UW: 25.0% down · 7.5% · 30yr · 1.5% tax · 5.0% vac · 8.0% maint · 8.0% mgmt
Financing live
Cash to close
- Down payment
- $58,750
- Closing costs
- $7,050
- Reserves months
- —
- Total cash needed
- —
Loan-product check · same deal, 3 products live
Conventional
25% down · 7.5% · 30yr
- Down + closing
- —
- Monthly P&I
- —
- Monthly cashflow
- —
- DSCR
- —
- Eligible?
- —
Personal DTI + credit; lowest rate.
DSCR
20% down · 8.5% · 30yr
- Down + closing
- —
- Monthly P&I
- —
- Monthly cashflow
- —
- DSCR
- —
- Eligible?
- —
No personal income docs; deal must DSCR.
Hard money
10% down · 12.0% · 12mo
- Down + closing
- —
- Monthly P&I
- —
- Monthly cashflow
- —
- DSCR
- —
- Eligible?
- —
Short-term bridge; refi at stabilization.
Rent comps 18 comps
| Address | Beds | Baths | Sqft | Rent | $/sqft | DOM | Units | Dist |
|---|---|---|---|---|---|---|---|---|
| 136 Sea Crest Cir Vallejo, CA | 2.0 | 1.0 | 900 | $2,350 | $2.61 | 44d | 1 | 0.35mi |
| 206 Sea Crest Cir Vallejo, CA | 2.0 | 2.5 | 1464 | $2,595 | $1.77 | 44d | 1 | 0.38mi |
| 706 La Canyada Dr Vallejo, CA | 3.0 | 2.0 | 1075 | $2,799 | $2.60 | 14d | 1 | 0.58mi |
| 1201 Glen Cove Pkwy Vallejo, CA | 2.0 | 2.0 | 1038 | $2,150 | $2.07 | 44d | 2 | 0.73mi |
| 1201 Glen Cove Pkwy Vallejo, CA | 2.0 | 2.0 | 1100 | $2,350 | $2.14 | 24d | 2 | 0.73mi |
| 532 Magazine St Vallejo, CA | 1.0–2.0 | 1.0–2.0 | 792 | $2,888 | $3.65 | 25d | 12 | 0.74mi |
| 532 Magazine St Vallejo, CA | 2.0 | 2.0 | 762 | $3,188 | $4.18 | 0d | 9 | 0.74mi |
| 532 Magazine St Vallejo, CA | 2.0 | 1.0–2.0 | 792 | $2,988 | $3.77 | 4d | 11 | 0.74mi |
| 115 James River Rd Vallejo, CA | 3.0 | 2.5 | 1472 | $2,850 | $1.94 | 13d | 1 | 0.74mi |
| 961 Porter St Vallejo, CA | 2.0–3.0 | 1.0–3.0 | 1159 | $2,406 | $2.08 | 0d | 11 | 0.74mi |
| 924 Palou St Vallejo, CA | 3.0 | 1.0 | 966 | $2,500 | $2.59 | 24d | 1 | 0.78mi |
| 1201 Glen Cove Pkwy #1407 Vallejo, CA | 2.0 | 2.0 | 1101 | $2,400 | $2.18 | 17d | 1 | 0.78mi |
| 1201 Glen Cove Pkwy #1407 Vallejo, CA | 2.0 | 2.0 | 1101 | $2,400 | $2.18 | 0d | 1 | 0.78mi |
| 929 6th St Vallejo, CA | 3.0 | 2.0 | 1414 | $2,600 | $1.84 | 44d | 1 | 0.84mi |
| 962 Pine St Vallejo, CA | 3.0 | 2.0 | 1000 | $3,200 | $3.20 | 44d | 1 | 0.85mi |
| 108 Esa Dr Vallejo, CA | 3.0 | 2.0 | 1196 | $2,200 | $1.84 | 44d | 1 | 0.91mi |
| 551 5th St Vallejo, CA | 3.0 | 1.0 | 1000 | $2,550 | $2.55 | 24d | 1 | 1.23mi |
| 217 Foulkstone Way Vallejo, CA | 3.0 | 2.0 | 1514 | $3,250 | $2.15 | 44d | 1 | 1.32mi |
Listing history 13 events
-
2026-06-18days on market $235,000 Active 17 DOM
-
2026-06-17days on market $235,000 Active 16 DOM
-
2026-06-16days on market $235,000 Active 15 DOM
-
2026-06-15days on market $235,000 Active 14 DOM
-
2026-06-14days on market $235,000 Active 12 DOM
-
2026-06-10days on market $235,000 Active 9 DOM
-
2026-06-09days on market $235,000 Active 8 DOM
-
2026-06-08days on market $235,000 Active 7 DOM
-
2026-06-07days on market $235,000 Active 6 DOM
-
2026-06-05days on market $235,000 Active 3 DOM
-
2026-06-03days on market $235,000 Active 2 DOM
-
2026-06-02remarks 699-char remark
-
2026-06-02$235,000 Active 1 DOM
ⓘ Source: listings_history table (triggers on properties + properties_extension) + one-shot
backfill from property_details.listing_events for pre-trigger history.
Climate risk First Street
- Flood 1/10 Low FEMA zone X (unshaded) · 0% chance over 30 yrs
- Wildfire 1/10 Low
- Heat 4/10 Moderate 7 d/yr ≥93°F today · 14 d/yr by 30 yrs out
- Wind 1/10 Low
- Air quality 9/10 Extreme 16 unhealthy d/yr today · 17 by 30 yrs out
Nearby sold comps map
Loading sold comps map…
Walkable amenities ~0.75 mi
Loading nearby amenities…
Taxation est. · year 1
- Rental income
- $29,844
- − Mortgage interest
- −$13,164
- − Property taxes
- −$3,525
- − Insurance
- −$1,175
- − Repairs & maintenance
- −$2,388
- − Management
- −$2,388
- − Depreciation
- −$6,836
- Taxable income
- $369
- Est. tax owed @ 24.0%
- −$89
- After-tax cash flow
- $4,000/yr
For passive investors: Depreciation is non-cash, so a rental often shows a tax loss while cash-flowing — sheltering income. Rental losses are passive: they offset passive income freely, and up to $25,000/yr can offset ordinary (W-2) income if you actively participate and your MAGI is under $100k (phasing out to $0 by $150k); unused losses carry forward. On sale, claimed depreciation is recaptured at up to 25%, and gains may owe capital-gains tax (a 1031 exchange can defer both). Figures are a year-1 estimate at your 24.0% rate — not tax advice; consult a CPA.
Condition & rehab AI · 12 photos
This beautifully updated 2-bedroom, 2-bathroom home offers a bright, open floor plan with modern finishes and low-maintenance living in a desirable Vallejo community.
Value-add opportunities
- Both Painting exterior and interior walls — Fresh paint can enhance curb appeal and interior aesthetics
- Both Landscaping improvements — Enhanced landscaping can improve curb appeal and attract potential buyers
- Rental HVAC system maintenance — A well-maintained HVAC system can attract renters and reduce utility costs
Renovation cost estimate screening
Value-add ROI direction
- Both Painting exterior and interior walls — Fresh paint can enhance curb appeal and interior aesthetics ↑
- Both Landscaping improvements — Enhanced landscaping can improve curb appeal and attract potential buyers ↑
- Rental HVAC system maintenance — A well-maintained HVAC system can attract renters and reduce utility costs ↑
ⓘ Cost ranges are severity-bucket heuristics (US national rule-of-thumb). Get contractor quotes + a written scope before underwriting a rehab budget.
Schools (NCES district)
- District
- Vallejo City Unified
- NCES district ID
- 0640740
- Math proficiency
- 20% ▬ 0.00%
- Reading proficiency
- 30% ▬ 0.00%
- Median HH income
- $59,919
- Composite
- 26.02/100
- National rank
- #12743
- State rank
- #1124 of 1400 in CA
Livability — Vallejo
- Score
- 67/100
- State rank
- #304
- US rank
- #10215
Category grades
Schools grade is shown separately in the Schools card above.
Census & demographics
- Census place
- Vallejo, CA
- County
- Solano County · 433,239 people
- City population
- 125,311
- Metro
- Vallejo, CA
- Population (ZIP)
- 37,128
- Household income
- $65,290
- Rent vs Own
- Severe rent burden
- 2972.0
Population outlook (Solano County) Hauer SSP2
- Today (2025)
- 478,685 people
- By 2030
- 497,974 · +4.0%
- By 2040
- 528,515 · +10.4%
- By 2050
- 549,115 · +14.7%
- By 2075
- 587,229 · +22.7%
- By 2100
- 571,378 · +19.4%
Race, ethnicity, and origin ACS 2023
- Neighborhood character
- Highly diverse neighborhood (Simpson 0.77)
- Race & ethnicity
- Hispanic / Latino 32% White 26% Black 21% Two or more races 14% Asian 13% Native American 1%
- Hispanic origin (detail)
- Mexican 23%
- Common ancestry
- Lithuanian 2% Italian 1% Romanian 1%
- Foreign-born
- 25% · Canada, South Korea, China
- Languages at home
- 65% English-only · Spanish 21% Tagalog/Filipino 9% Other Indo-European 1%
Political lean MEDSL · Solano
- 2024 margin
- Strong D (+23.0) · D 60.0% · R 37.1% · Other 2.9%
- 2008→2024 swing
- -5.6pp toward R · 2008: 28.6pp · 2024: 23.0pp
- All cycles
- 2024: D+23.0 2020: D+30.3 2016: D+30.5 2012: D+28.1 2008: D+28.6
Not yet ingested
- Civics
- —
Market trends
- HPI YoY
- ▼ -530.45%
- Current HPI
- 321.0365
- Rent YoY
- ▲ 0.71%
- Metro
- Vallejo, CA
- State GDP YoY
- ▲ 3.21%
- F500 in state
- 116
Industry mix (Fortune 500 HQ in CA)
| Industry | F500 HQs | Revenue |
|---|---|---|
| Technology | 27 | $1,492B |
|
||
| Financial Services | 3 | $174B |
|
||
| Retail | 3 | $44B |
|
||
| Insurance | 3 | $26B |
|
||
| Media / Entertainment | 2 | $115B |
|
||
| Pharmaceuticals / Biotech | 2 | $62B |
|
||
Price history
-9.6% since first listed6 events — show timeline
- 2026-06-01 Listed $235,000 bridgeMLS, Bay East AOR, or Contra Costa AOR
- 2023-01-04 Price Changed $2,000 BAREIS
- 2023-01-04 Sold (MLS) $220,000 BAREIS
- 2022-11-08 Pending — BAREIS
- 2022-11-08 Price Changed $220,000 BAREIS
- 2022-10-23 Listed $260,000 BAREIS
Cash-flow waterfall
monthlySold comps — $/sqft
last 12 mo · ≤1 miLoading sold comps…