1358 Oakland Rd #78 · San Jose, CA
Flood risk 5/10 · Moderate
- FEMA flood zone
- AO
- Chance of flooding over 30 yrs
- 0.26%
- Est. flood insurance / yr
- $848 – $2,087
Fire risk 1/10 · Minimal
- Est. fire insurance / yr
- $659 – $1,223
Heat risk 5/10 · Moderate
- Hot days now (above 93°F)
- 7 days/yr
- Hot days in 30 yrs
- 14 days/yr
Wind risk 1/10 · Minimal
- Chance of severe wind over 30 yrs
- —
Air-quality risk 8/10 · Major
- Unhealthy air days now
- 14 days/yr
- Unhealthy air days in 30 yrs
- 16 days/yr
Risk factors via First Street. Map © Google.
Why this score? — see what drove the C grade
The composite is a weighted blend of 9 inputs, each scored 0–100. Each bar is that input's sub-score; the figure is the points it added to the 100-point composite (weight × sub-score).
- Cash flow +25.6/30.0
- DSCR +8.5/10.0
- 1% rule +6.8/10.0
- Schools +5.5/10.0
- Livability +3.9/5.0
- Rent growth +3.6/5.0
- ARV discount +2.5/15.0
- Condition / age +2.5/5.0
- Appreciation +0.0/10.0
$349,000
🖨 Deal sheet 📄 Offer letter ✓ Due diligence
Listing remarks MLS
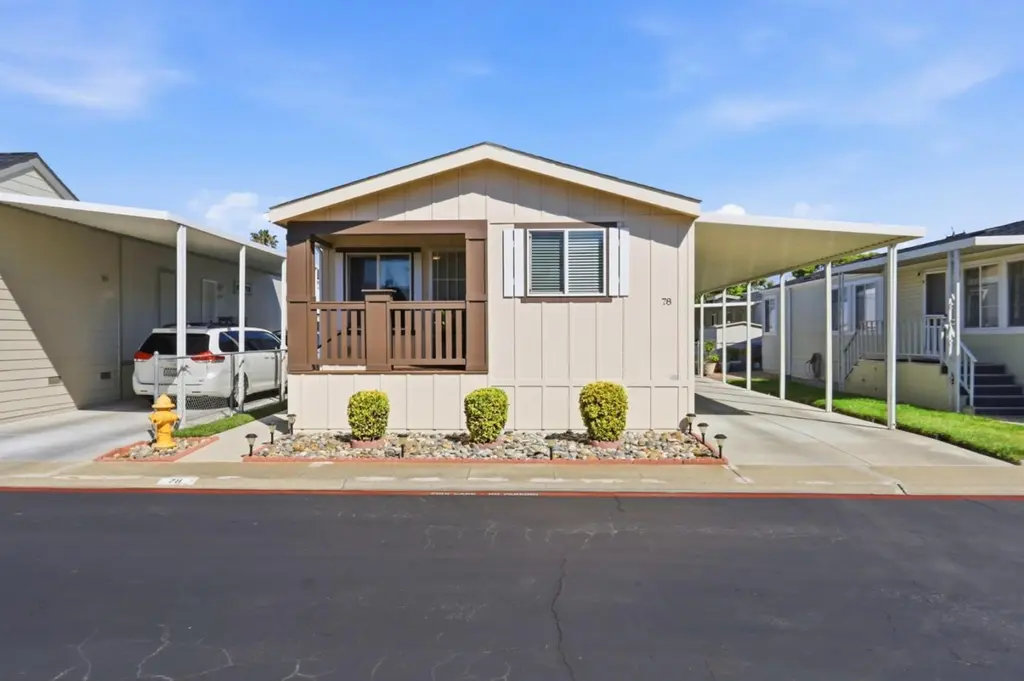
This stunning San Jose home offers 1,284 sq ft of thoughtfully designed living space with three bedrooms and two full bathrooms. The functional layout features a kitchen and family room combination, with a dining area that flows seamlessly into the main living space, creating an open and inviting environment. This home offers both comfort and convenience in a desirable location.
Key facts
- Built 2014
- Listed 43 days
Property features AI
Finance
- Other: Lot size source: Assessor; Local property tax (LPT)
- HOA & community: Clubhouse; Community pool; Park located in a family park with board approval required
Exterior
- Parking: 2 carport spaces (space #78); Assigned space with rent
- Utilities: Public water; Public sewer; Individual electric meters; Individual gas meters; Public utilities
- Home design: Manufactured home (park model)
- Exterior features: Shingle roof; Leased land (park home site)
Interior
- Bedrooms: 3 bedrooms
- Bathrooms: 2 full bathrooms
- Heating & cooling: Central forced-air heating; Evaporative cooling
- Interior features: Kitchen and family room combined; Dining area in family room
Neighborhood map
What this means for you Summary
Snapshot
- This is a 3-bed/2.0-bath manufactured listed at $349k.
Deal economics
- At list price, monthly cash flow is $707 ($8k/yr) — positive.
- The deal already cash-flows at list — no discount required.
- Meets the 1% rule at list price ($4k rent vs $349k).
- Recommended offer: $339k (3.0% below list) — sets the bar for market timing.
- Cap rate 9.1% vs local median 1.6% in San Jose — top-decile yield for the area; either an underpriced asset or a hidden risk that comps aren't pricing in. Stress-test before assuming the spread holds.
Location & tenants
- Location reads 78/100 on livability (#68 in CA, #2,559 nationally) — a middle-class / working-renter tenant base. Strengths: amenities A+, commute A+, employment A+; Watch: crime F, cost of living F.
- Orchard Elementary (urban): math 51% / reading 60% proficiency, ranked #225 of 1,400 in CA (top 16%) — acceptable for families but not a draw, mixed tenant base, ~2y average lease.
- Market conditions: Rents rising fast (+4.2%/yr); 106 active listings in the ZIP; 22 comparable units currently listed for rent nearby; rentals leasing fast (median 2d on market — plan ~1-2 weeks tenant-placement turnaround); solid renter incomes; 3,838 units permitted in Santa Clara County in 2024 (1,886 in 5+ unit buildings).
- At $4,102/mo this rent would consume 55% of the median local household income ($89k/yr) (locally 4364% of renters already pay >50% of income on rent) — very limited rent-growth headroom before tenants either downsize or default.
Forward outlook
- Local home prices are declining (-3.0%/yr); year-one equity from $2k of loan paydown is wiped out by about $10k of value loss. Plan a longer hold.
- Santa Clara County population projected at +24% by 2050 — long-run rental-demand tailwind backs the buy-and-hold thesis.
- At projected returns (-3.0% appreciation + 4.2% rent growth), your $98k cash investment doubles in ~10 years — after that, you're playing with house money.
Negotiation context
- It's been on market 43 days — a 3% lower offer ($339k) is reasonable based on typical stale-listing flexibility.
- 2 sale attempts; this cycle's ask is 17% above the opening price — seller raised mid-cycle; expect resistance to lowballs.
Risks & watch-outs
- Watch-outs: flood insurance adds $122/mo.
- Climate carrying-cost: in FEMA flood zone AO (mandatory federal flood insurance); extreme-heat days projected 7→14/yr by 2055 (HVAC capex compounding) — expect insurance premiums to compound above CPI over the hold.
Questions for the listing agent
- It's been on market 43 days. Have you received any prior offers? Is the seller open to a 3% concession, seller financing, or rate buy-down credit?
- What's the actual annual flood-insurance premium (NFIP or private), and is the property in a SFHA with mandatory coverage?
- Is there a deadline driving the sale (1031 exchange, divorce, estate, relocation)? That informs how much negotiation room exists.
- Crime grade is F in this area — have there been break-ins, vandalism, or insurance claims at this property in the last 3 years? What carrier currently insures it and at what premium?
- What's the average days-on-market for RENTAL listings here right now (not sales)? A rising rental-DOM trend means longer vacancies and softer asking-rent achievability than the comps imply.
- What's the recent tenant-quality profile in this submarket — average credit score on applications, eviction rate, late-payment / NSF rate, and stable-employment percentage? A property-management company in the area should have these aggregated.
- How much new for-sale + rental construction is in the pipeline within 1–3 miles? Heavy new supply typically softens prices + rents 12–24 months out; constrained supply supports both.
Investment metrics
- 1% rule
- 1.18% ✓
- Cap rate
- 9.14%
- Cash-on-cash
- 10.18%
- DSCR
- 1.45
- GRM
- 7.1
CMA / ARV
- ARV (median comp)
- $314,397
- List price
- $349,000
- Delta
- 11.01%
- Verdict
- OVERPRICED
- Comps
- 20 within 1.0 mi
Show comp detail 5 sales within ~0.75 mi
| Address | Dist | Beds/Ba | Sqft | Sold | Price | $/sf | Match |
|---|---|---|---|---|---|---|---|
| 1350 Oakland Rd #152 | 0.21mi | 3/2.0 | 1,248 (-3%) | 13mo | $412,000 | $330 | 75 |
| 1358 Oakland Rd #85 | 0.13mi | 3/2.0 | 1,332 (+4%) | 17mo | $355,000 | $267 | 74 |
| 1358 Oakland Rd #109 | 0.00mi | 3/2.0 | 1,120 (-13%) | 15mo | $325,000 | $290 | 66 |
| 900 Golden Wheel Park Dr Spc 29 | 0.19mi | 3/2.0 | 1,100 (-14%) | 6mo | $300,000 | $273 | 62 |
| 1358 Oakland Rd #79 | 0.15mi | 3/2.0 | 1,465 (+14%) | 14mo | $429,900 | $293 | 58 |
Match score weights: distance 35% · size 25% · config 20% · recency 20%. Top-matched comps best support the ARV.
Projected returns pro-forma
-3.0% appreciation · 4.25% rent growth · sell at horizon
- IRR
- -1.7%
- Equity multiple
- 0.94×
- Total profit
- $-6,185
- Equity at exit
- $52,037
- IRR
- 9.4%
- Equity multiple
- 1.77×
- Total profit
- $75,114
- Equity at exit
- $30,175
Cash invested: $97,720 (down + closing). Projections, not guarantees.
Landlord ↔ Tenant lean methodology
- Overall (CITY)
- 0 Strongly Tenant-Friendly
- State California
- 18 Strongly Tenant-Friendly · D+13
- County
- — inherits STATE
- City San Jose
- 0 Strongly Tenant-Friendly · D+24
ZIP-level market 95112
- Rents YoY
- 4.2%
- Active inventory
- 106
- Price-to-rent
- 7.1×
Monthly cashflow live
- Estimated rent
- $4,102 high interval (Pro) →
- Mortgage (P&I)
- −$1,830
- Tax est. 1.5%
- −$436 /mo · $5,235/yr
- Insurance
- −$145
- Flood insurance flood zone
- −$122 /mo · $1,468/yr
- HOA
- −$0
- Vacancy / Maint / Mgmt
- −$861
- Net cashflow
- $707
Break-even live
UW: 25.0% down · 7.5% · 30yr · 1.5% tax · 5.0% vac · 8.0% maint · 8.0% mgmt
Financing live
Cash to close
- Down payment
- $87,250
- Closing costs
- $10,470
- Reserves months
- —
- Total cash needed
- —
Loan-product check · same deal, 3 products live
Conventional
25% down · 7.5% · 30yr
- Down + closing
- —
- Monthly P&I
- —
- Monthly cashflow
- —
- DSCR
- —
- Eligible?
- —
Personal DTI + credit; lowest rate.
DSCR
20% down · 8.5% · 30yr
- Down + closing
- —
- Monthly P&I
- —
- Monthly cashflow
- —
- DSCR
- —
- Eligible?
- —
No personal income docs; deal must DSCR.
Hard money
10% down · 12.0% · 12mo
- Down + closing
- —
- Monthly P&I
- —
- Monthly cashflow
- —
- DSCR
- —
- Eligible?
- —
Short-term bridge; refi at stabilization.
Rent comps 22 comps
| Address | Beds | Baths | Sqft | Rent | $/sqft | DOM | Units | Dist |
|---|---|---|---|---|---|---|---|---|
| 1542 Thornleaf Way San Jose, CA | 2.0 | 2.0 | 922 | $3,700 | $4.01 | 1d | 1 | 0.58mi |
| 1087 Bigleaf Pl #1526 San Jose, CA | 3.0 | 3.0 | 1850 | $4,180 | $2.26 | 1d | 1 | 0.60mi |
| 1625 Parkview Green Cir San Jose, CA | 2.0 | 1.0 | 940 | $3,295 | $3.51 | 1d | 1 | 0.63mi |
| 1323 Pebble Ct San Jose, CA | 2.0 | 2.0 | 1093 | $3,500 | $3.20 | 17d | 1 | 0.65mi |
| 1025 Gabbiano Ln San Jose, CA | 4.0 | 4.0 | 1847 | $4,950 | $2.68 | 3d | 1 | 0.68mi |
| 1025 Gabbiano Ln #1 San Jose, CA | 4.0 | 3.5 | 1847 | $4,750 | $2.57 | 7d | 1 | 0.68mi |
| 1501 Berryessa Rd San Jose, CA | 2.0 | 1.0–2.0 | 966 | $4,734 | $4.90 | 1d | 31 | 0.69mi |
| 725 Modern Ice Dr #1590 San Jose, CA | 3.0 | 2.5 | 1391 | $3,820 | $2.75 | 43d | 1 | 0.76mi |
| 1331 Lakeshore Cir San Jose, CA | 1.0–3.0 | 1.0–3.0 | 1017 | $4,767 | $4.69 | 1d | 28 | 0.80mi |
| 636 Boardwalk San Jose, CA | 3.0 | 2.5 | 1507 | $3,600 | $2.39 | 4d | 1 | 0.84mi |
| 1600 Whitewood Dr San Jose, CA | 1.0–2.0 | 1.0–2.0 | 977 | $3,806 | $3.89 | 1d | 12 | 0.92mi |
| 1067 McKay Dr San Jose, CA | 3.0 | 3.0 | 1657 | $4,800 | $2.90 | 1d | 1 | 1.04mi |
| 750 N 23rd St San Jose, CA | 1.0–3.0 | 1.0 | 875 | $3,199 | $3.66 | 12d | 1 | 1.08mi |
| 923 Sakura Dr San Jose, CA | 3.0 | 3.0 | 1404 | $4,150 | $2.96 | 12d | 1 | 1.16mi |
| 817 N 10th St San Jose, CA | 2.0 | 1.0–2.0 | 851 | $3,749 | $4.40 | 1d | 10 | 1.16mi |
| 1700 N 1st St San Jose, CA | 1.0–2.0 | 1.0–2.0 | 941 | $3,667 | $3.90 | 1d | 8 | 1.18mi |
| 263 E Hedding St #1535 San Jose, CA | 1.0–4.0 | 1.0–3.5 | 1629 | $4,770 | $2.93 | 3d | 2 | 1.21mi |
| 415 E Taylor St San Jose, CA | 2.0 | 1.0–2.0 | 900 | $4,595 | $5.11 | 1d | 11 | 1.27mi |
| 978 N 3rd St San Jose, CA | 2.0 | 1.0 | 1032 | $4,500 | $4.36 | 1d | 1 | 1.33mi |
| 1729 N 1st St San Jose, CA | 1.0–2.0 | 1.0–2.0 | 887 | $4,707 | $5.31 | 1d | 12 | 1.36mi |
| 1700 Newbury Park Dr San Jose, CA | 2.0 | 1.0–2.0 | 793 | $3,999 | $5.04 | 1d | 10 | 1.41mi |
| 350 E Taylor St San Jose, CA | 1.0–3.0 | 1.0–3.0 | 1116 | $5,409 | $4.85 | 1d | 10 | 1.45mi |
Listing history 18 events
-
2026-06-18days on market $349,000 Active 43 DOM
-
2026-06-17days on market $349,000 Active 42 DOM
-
2026-06-16days on market $349,000 Active 41 DOM
-
2026-06-15days on market $349,000 Active 40 DOM
-
2026-06-13days on market $349,000 Active 38 DOM
-
2026-06-13days on market $349,000 Active 37 DOM
-
2026-06-09days on market $349,000 Active 34 DOM
-
2026-06-08days on market $349,000 Active 33 DOM
-
2026-06-07days on market $349,000 Active 32 DOM
-
2026-06-05days on market $349,000 Active 29 DOM
-
2026-06-03days on market $349,000 Active 28 DOM
-
2026-06-02days on market $349,000 Active 27 DOM
-
2026-06-01days on market $349,000 Active 26 DOM
-
2026-05-31days on market $349,000 Active 25 DOM
-
2026-05-08price $349,000 381-char remark
Show marketing remark (381 chars)
This stunning San Jose home offers 1,284 sq ft of thoughtfully designed living space with three bedrooms and two full bathrooms. The functional layout features a kitchen and family room combination, with a dining area that flows seamlessly into the main living space, creating an open and inviting environment. This home offers both comfort and convenience in a desirable location.
-
2026-05-06$299,000 Active 381-char remark
Show marketing remark (381 chars)
This stunning San Jose home offers 1,284 sq ft of thoughtfully designed living space with three bedrooms and two full bathrooms. The functional layout features a kitchen and family room combination, with a dining area that flows seamlessly into the main living space, creating an open and inviting environment. This home offers both comfort and convenience in a desirable location.
ⓘ Source: listings_history table (triggers on properties + properties_extension) + one-shot
backfill from property_details.listing_events for pre-trigger history.
Climate risk First Street
- Flood 5/10 Major FEMA zone AO · 26% chance over 30 yrs
- Wildfire 1/10 Low
- Heat 5/10 Major 7 d/yr ≥93°F today · 14 d/yr by 30 yrs out
- Wind 1/10 Low
- Air quality 8/10 Severe 14 unhealthy d/yr today · 16 by 30 yrs out
Nearby sold comps map
Loading sold comps map…
Walkable amenities ~0.75 mi
Loading nearby amenities…
Taxation est. · year 1
- Rental income
- $49,228
- − Mortgage interest
- −$19,549
- − Property taxes
- −$5,235
- − Insurance
- −$3,212
- − Repairs & maintenance
- −$3,938
- − Management
- −$3,938
- − Depreciation
- −$10,153
- Taxable income
- $3,202
- Est. tax owed @ 24.0%
- −$768
- After-tax cash flow
- $7,712/yr
For passive investors: Depreciation is non-cash, so a rental often shows a tax loss while cash-flowing — sheltering income. Rental losses are passive: they offset passive income freely, and up to $25,000/yr can offset ordinary (W-2) income if you actively participate and your MAGI is under $100k (phasing out to $0 by $150k); unused losses carry forward. On sale, claimed depreciation is recaptured at up to 25%, and gains may owe capital-gains tax (a 1031 exchange can defer both). Figures are a year-1 estimate at your 24.0% rate — not tax advice; consult a CPA.
Schools (NCES district)
- District
- Orchard Elementary
- NCES district ID
- 0628680
- Math proficiency
- 51% ▲ 1.00%
- Reading proficiency
- 60% ▲ 5.00%
- Median HH income
- $108,165
- Composite
- 54.67/100
- National rank
- #2853
- State rank
- #225 of 1400 in CA
Livability — San Jose
- Score
- 78/100
- State rank
- #68
- US rank
- #2559
Category grades
Schools grade is shown separately in the Schools card above.
Census & demographics
- Census place
- San Jose, CA
- County
- Santa Clara County · 1,806,974 people
- City population
- 954,479
- Metro
- San Jose-Sunnyvale-Santa Clara, CA
- Population (ZIP)
- 57,373
- Household income
- $89,103
- Rent vs Own
- Severe rent burden
- 4364.0
Population outlook (Santa Clara County) Hauer SSP2
- Today (2025)
- 2,179,074 people
- By 2030
- 2,301,297 · +5.6%
- By 2040
- 2,528,195 · +16.0%
- By 2050
- 2,712,135 · +24.5%
- By 2075
- 2,998,701 · +37.6%
- By 2100
- 2,931,429 · +34.5%
Race, ethnicity, and origin ACS 2023
- Neighborhood character
- Highly diverse neighborhood (Simpson 0.71)
- Race & ethnicity
- Hispanic / Latino 41% Asian 27% White 22% Two or more races 18% Black 5% Native American 2%
- Hispanic origin (detail)
- Mexican 33%
- Common ancestry
- Slovak 1% Lithuanian 1% Scotch-Irish 1%
- Foreign-born
- 34% · Canada, Vietnam, China
- Languages at home
- 48% English-only · Spanish 29% Vietnamese 9% Chinese 6%
Political lean MEDSL · Santa Clara
- 2024 margin
- Solid D (+40.0) · D 68.1% · R 28.1% · Other 3.8%
- 2008→2024 swing
- -0.9pp no change · 2008: 40.9pp · 2024: 40.0pp
- All cycles
- 2024: D+40.0 2020: D+47.4 2016: D+52.5 2012: D+42.1 2008: D+40.9
Not yet ingested
- Civics
- —
Market trends
- HPI YoY
- ▼ -1025.61%
- Current HPI
- 297.1788
- Rent YoY
- ▲ 4.25%
- Metro
- San Jose-Sunnyvale-Santa Clara, CA
- State GDP YoY
- ▲ 3.21%
- F500 in state
- 116
Industry mix (Fortune 500 HQ in CA)
| Industry | F500 HQs | Revenue |
|---|---|---|
| Technology | 27 | $1,492B |
|
||
| Financial Services | 3 | $174B |
|
||
| Retail | 3 | $44B |
|
||
| Insurance | 3 | $26B |
|
||
| Media / Entertainment | 2 | $115B |
|
||
| Pharmaceuticals / Biotech | 2 | $62B |
|
||
Price history
+16.7% since first listed4 events — show timeline
- 2026-05-08 Price Changed $349,000 bridgeMLS, Bay East AOR, or Contra Costa AOR
- 2026-05-08 Price Changed $349,000 MLSListings
- 2026-05-06 Listed $299,000 MLSListings
- 2026-05-06 Listed $299,000 bridgeMLS, Bay East AOR, or Contra Costa AOR
Property tax history
-9.1%/yrLatest (2011): $283 · -10.7% YoY. Source: county tax records.
Cash-flow waterfall
monthlySold comps — $/sqft
last 12 mo · ≤1 miLoading sold comps…