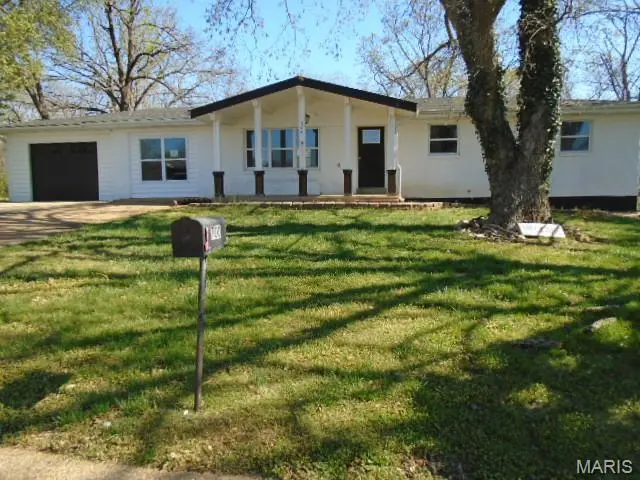
700 Westwood Dr · Park Hills, MO
Flood risk 1/10 · Minimal
- FEMA flood zone
- X (unshaded)
- Chance of flooding over 30 yrs
- 0.0%
- Est. flood insurance / yr
- $473 – $860
Fire risk 4/10 · Minor
- Est. fire insurance / yr
- $1,054 – $1,958
Heat risk 4/10 · Minor
- Hot days now (above 104°F)
- 7 days/yr
- Hot days in 30 yrs
- 20 days/yr
Wind risk 2/10 · Minimal
- Chance of severe wind over 30 yrs
- 1.0%
Air-quality risk 1/10 · Minimal
- Unhealthy air days now
- 0 days/yr
- Unhealthy air days in 30 yrs
- 0 days/yr
Risk factors via First Street. Map © Google.
Why this score? — see what drove the D grade
The composite is a weighted blend of 9 inputs, each scored 0–100. Each bar is that input's sub-score; the figure is the points it added to the 100-point composite (weight × sub-score).
- Cash flow +11.4/30.0
- ARV discount +11.4/15.0
- Schools +3.4/10.0
- DSCR +3.3/10.0
- Livability +2.9/5.0
- 1% rule +2.6/10.0
- Rent growth +2.5/5.0
- Condition / age +2.5/5.0
- Appreciation +1.3/10.0
$162,500
🖨 Deal sheet 📄 Offer letter ✓ Due diligence
Listing remarks MLS
A delightful ranch-style home with 4 bedrooms and 2 bathrooms, offering a comfortable and functional layout. The large, open yard provides plenty of space for relaxing or entertaining, all set within a quiet, peaceful neighborhood. This inviting property combines space and comfort, making it a wonderful place to call home—schedule your showing today!
Key facts
- 0.34 acre lot
- Garage
- Built 1966
Neighborhood map
What this means for you Summary
Snapshot
- This is a 3-bed/2.0-bath other listed at $162k.
Deal economics
- At list price, monthly cash flow is $-56 ($-667/yr) — negative.
- To cash-flow at today's rent, offer at most $153k (6.0% below list).
- To meet the 1% rule (rent ≥ 1% of price), the offer needs to be $123k (24.1% below list).
- Recommended offer: $123k (24.1% below list) — sets the bar for 1% rule.
Location & tenants
- Location reads 58/100 on livability (#585 in MO) — a working-class tenant base; expect higher turnover. Strengths: cost of living A+, housing A+, crime B; Watch: schools D, amenities F, commute F.
- Central R-III (town): math 36% / reading 45% proficiency, ranked #150 of 324 in MO (top 46%) — families likely to look elsewhere, expect single-tenant / working-renter base with shorter leases.
- Market conditions: 73 active listings in the ZIP; 134 units permitted in St. Francois County in 2024 (32 in 5+ unit buildings).
Forward outlook
- Local home prices are declining (-3.0%/yr); year-one equity from $1k of loan paydown is wiped out by about $5k of value loss. Plan a longer hold.
Negotiation context
- It's been on market 65 days — a 6% lower offer ($153k) is reasonable based on typical stale-listing flexibility.
- 3 sale attempts since 7y ago; this cycle's ask has dropped $10k (6%) from the opening price — seller is motivated, your offer sets the floor, not the list.
Questions for the listing agent
- What do current leases actually rent for vs. the listed asking? Can we see a recent rent roll and the last 12 months of T-12 income?
- It's been on market 65 days. Have you received any prior offers? Is the seller open to a 24% concession, seller financing, or rate buy-down credit?
- Built in 1966 — when were the roof, HVAC, electrical panel, plumbing, and water heater last replaced?
- Why hasn't it sold? Are there any deal-killer items the seller is aware of (foundation, flood, title, zoning, code violations)?
- Is there a deadline driving the sale (1031 exchange, divorce, estate, relocation)? That informs how much negotiation room exists.
- Schools are D-rated, which usually means shorter tenancies and higher turnover. Who's the typical renter profile here, and what's been the actual vacancy rate?
- The area grade is low — what's the realistic commute time and amenity access for the typical tenant pool here? Any planned neighborhood developments (good or bad) we should know about?
- What's the average days-on-market for RENTAL listings here right now (not sales)? A rising rental-DOM trend means longer vacancies and softer asking-rent achievability than the comps imply.
- What's the recent tenant-quality profile in this submarket — average credit score on applications, eviction rate, late-payment / NSF rate, and stable-employment percentage? A property-management company in the area should have these aggregated.
- How much new for-sale + rental construction is in the pipeline within 1–3 miles? Heavy new supply typically softens prices + rents 12–24 months out; constrained supply supports both.
Investment metrics
- 1% rule
- 0.76% ✗
- Cap rate
- 5.88%
- Cash-on-cash
- -1.47%
- DSCR
- 0.93
- GRM
- 11.0
CMA / ARV
- ARV (median comp)
- $177,853
- List price
- $162,500
- Delta
- -8.63%
- Verdict
- FAIR
- Comps
- 20 within 1.0 mi
Projected returns pro-forma
-3.0% appreciation · 3.0% rent growth · sell at horizon
- IRR
- -18.7%
- Equity multiple
- 0.34×
- Total profit
- $-29,908
- Equity at exit
- $24,229
- IRR
- -11.3%
- Equity multiple
- 0.32×
- Total profit
- $-30,755
- Equity at exit
- $14,050
Cash invested: $45,500 (down + closing). Projections, not guarantees.
Landlord ↔ Tenant lean methodology
- Overall (STATE)
- 81 Strongly Landlord-Friendly
- State Missouri
- 81 Strongly Landlord-Friendly · R+10
- County
- — inherits STATE
- City
- — inherits STATE
ZIP-level market 63601
- Home prices YoY
- -2.6%
- Active inventory
- 73
- Price-to-rent
- 11.0×
Monthly cashflow live
- Estimated rent
- $1,234 medium interval (Pro) →
- Mortgage (P&I)
- −$852
- Tax from tax record
- −$111 /mo · $1,326/yr
- Insurance
- −$68
- HOA
- −$0
- Vacancy / Maint / Mgmt
- −$259
- Net cashflow
- $-56
Break-even live
UW: 25.0% down · 7.5% · 30yr · 1.5% tax · 5.0% vac · 8.0% maint · 8.0% mgmt
Financing live
Cash to close
- Down payment
- $40,625
- Closing costs
- $4,875
- Reserves months
- —
- Total cash needed
- —
Loan-product check · same deal, 3 products live
Conventional
25% down · 7.5% · 30yr
- Down + closing
- —
- Monthly P&I
- —
- Monthly cashflow
- —
- DSCR
- —
- Eligible?
- —
Personal DTI + credit; lowest rate.
DSCR
20% down · 8.5% · 30yr
- Down + closing
- —
- Monthly P&I
- —
- Monthly cashflow
- —
- DSCR
- —
- Eligible?
- —
No personal income docs; deal must DSCR.
Hard money
10% down · 12.0% · 12mo
- Down + closing
- —
- Monthly P&I
- —
- Monthly cashflow
- —
- DSCR
- —
- Eligible?
- —
Short-term bridge; refi at stabilization.
Listing history 24 events
-
2026-06-18days on market $162,500 Active 65 DOM
-
2026-06-17days on market $162,500 Active 64 DOM
-
2026-06-17price $162,500 Active 63 DOM
-
2026-06-16days on market $172,500 Active 63 DOM
-
2026-06-15days on market $172,500 Active 62 DOM
-
2026-06-13days on market $172,500 Active 60 DOM
-
2026-06-12days on market $172,500 Active 59 DOM
-
2026-06-09days on market $172,500 Active 56 DOM
-
2026-06-08days on market $172,500 Active 55 DOM
-
2026-06-07days on market $172,500 Active 54 DOM
-
2026-06-05days on market $172,500 Active 52 DOM
-
2026-06-04days on market $172,500 Active 50 DOM
-
2026-06-02days on market $172,500 Active 49 DOM
-
2026-06-01days on market $172,500 Active 48 DOM
-
2026-05-31days on market $172,500 Active 47 DOM
-
2026-04-14$172,500 Active 358-char remark
Show marketing remark (358 chars)
A delightful ranch-style home with 4 bedrooms and 2 bathrooms, offering a comfortable and functional layout. The large, open yard provides plenty of space for relaxing or entertaining, all set within a quiet, peaceful neighborhood. This inviting property combines space and comfort, making it a wonderful place to call home—schedule your showing today!
-
2021-05-13status Pending 16-char remark
Show marketing remark (16 chars)
ONE TIME SHOWING
-
2021-05-13$229,600 Active 16-char remark
Show marketing remark (16 chars)
ONE TIME SHOWING
-
2021-05-10soldstatus
-
2021-05-06soldstatus Closed 16-char remark
Show marketing remark (16 chars)
ONE TIME SHOWING
-
2019-08-16soldstatus Closed
-
2019-07-09historical Active Under Contract
-
2019-07-02$74,500 Active
-
2000-11-16soldstatus
ⓘ Source: listings_history table (triggers on properties + properties_extension) + one-shot
backfill from property_details.listing_events for pre-trigger history.
Tax reassessment forecast MO · Resets to sale price
- Current annual tax
- $1,326 · $111/mo
- Projected year-2 tax
- $1,576 · $131/mo
- Expected delta
- +$250/yr (+$21/mo · 18.8%)
ⓘ Screening estimate from a state-policy table — verify with the county assessor before closing.
Climate risk First Street
- Flood 1/10 Low FEMA zone X (unshaded) · 0% chance over 30 yrs
- Wildfire 4/10 Moderate
- Heat 4/10 Moderate 7 d/yr ≥104°F today · 20 d/yr by 30 yrs out
- Wind 2/10 Low 100% chance of damaging wind over 30 yrs
- Air quality 1/10 Low 0 unhealthy d/yr today · 0 by 30 yrs out
Nearby sold comps map
Loading sold comps map…
Walkable amenities ~0.75 mi
Loading nearby amenities…
Taxation est. · year 1
- Rental income
- $14,808
- − Mortgage interest
- −$9,103
- − Property taxes
- −$1,326
- − Insurance
- −$812
- − Repairs & maintenance
- −$1,185
- − Management
- −$1,185
- − Depreciation
- −$4,727
- Taxable loss
- −$3,530
- Est. tax savings @ 24.0%
- +$847
- After-tax cash flow
- $181/yr
For passive investors: Depreciation is non-cash, so a rental often shows a tax loss while cash-flowing — sheltering income. Rental losses are passive: they offset passive income freely, and up to $25,000/yr can offset ordinary (W-2) income if you actively participate and your MAGI is under $100k (phasing out to $0 by $150k); unused losses carry forward. On sale, claimed depreciation is recaptured at up to 25%, and gains may owe capital-gains tax (a 1031 exchange can defer both). Figures are a year-1 estimate at your 24.0% rate — not tax advice; consult a CPA.
Schools (NCES district)
- District
- Central R-III
- NCES district ID
- 2929170
- Math proficiency
- 36% ▼ -6.00%
- Reading proficiency
- 45% ▼ -4.00%
- Median HH income
- $36,745
- Composite
- 33.61/100
- National rank
- #5410
- State rank
- #150 of 324 in MO
Livability — Park Hills
- Score
- 58/100
- State rank
- #585
- US rank
- #20779
Category grades
Schools grade is shown separately in the Schools card above.
Census & demographics
- Census place
- Park Hills, MO
- Population (ZIP)
- 16,434
Population outlook (St. Francois County) Hauer SSP2
- Today (2025)
- 68,683 people
- By 2030
- 69,574 · +1.3%
- By 2040
- 70,665 · +2.9%
- By 2050
- 70,708 · +2.9%
- By 2075
- 67,917 · -1.1%
- By 2100
- 56,563 · -17.6%
Race, ethnicity, and origin ACS 2023
- Neighborhood character
- Predominantly White (92%)
- Race & ethnicity
- White 92% Two or more races 6% Hispanic / Latino 3%
- Common ancestry
- Lithuanian 2% Italian 2% Romanian 2%
- Foreign-born
- 0%
Political lean MEDSL · St. Francois
- 2024 margin
- Solid R (+51.4) · D 23.8% · R 75.2%
- 2008→2024 swing
- -46.8pp toward R · 2008: -4.6pp · 2024: -51.4pp
- All cycles
- 2024: R+51.4 2020: R+48.1 2016: R+45.4 2012: R+19.5 2008: R+4.6
Not yet ingested
- Civics
- —
Market trends
- HPI YoY
- ▼ -7.30%
- Current HPI
- 278.5365
- Rent YoY
- —
- Metro
- —
- State GDP YoY
- ▲ 1.84%
- F500 in state
- 20
Industry mix (Fortune 500 HQ in MO)
| Industry | F500 HQs | Revenue |
|---|---|---|
| Healthcare | 1 | $163B |
|
||
| Insurance | 1 | $21B |
|
||
| Industrial Technology | 1 | $17B |
|
||
| Retail | 1 | $16B |
|
||
| Industrial Distribution | 1 | $10B |
|
||
| Utilities | 1 | $9B |
|
||
Price history
+131.5% since first listed9 events — show timeline
- 2026-04-14 Listed $172,500 MARIS as Distributed by MLS Grid
- 2021-05-13 Pending — MARIS as Distributed by MLS Grid
- 2021-05-13 Listed $229,600 MARIS as Distributed by MLS Grid
- 2021-05-10 Sold (Public Records) — Public Records
- 2021-05-06 Sold (MLS) — MARIS as Distributed by MLS Grid
- 2019-08-16 Sold (MLS) — MARIS as Distributed by MLS Grid
- 2019-07-09 Contingent — MARIS as Distributed by MLS Grid
- 2019-07-02 Listed $74,500 MARIS as Distributed by MLS Grid
- 2000-11-16 Sold (Public Records) — Public Records
Property tax history
+2.1%/yrLatest (2025): $1,326 · +3.9% YoY. Source: county tax records.
Cash-flow waterfall
monthlySold comps — $/sqft
last 12 mo · ≤1 miLoading sold comps…