7010 Wildwood Cir Apt 65 · Louisville/Jefferson County metro government (balance), KY
Flood risk 1/10 · Minimal
- FEMA flood zone
- X (unshaded)
- Chance of flooding over 30 yrs
- 0.0%
- Est. flood insurance / yr
- $507 – $1,088
Fire risk 1/10 · Minimal
- Est. fire insurance / yr
- $839 – $1,559
Heat risk 5/10 · Moderate
- Hot days now (above 104°F)
- 7 days/yr
- Hot days in 30 yrs
- 20 days/yr
Wind risk 2/10 · Minimal
- Chance of severe wind over 30 yrs
- 3.0%
Air-quality risk 3/10 · Minor
- Unhealthy air days now
- 2 days/yr
- Unhealthy air days in 30 yrs
- 5 days/yr
Risk factors via First Street. Map © Google.
Why this score? — see what drove the D grade
The composite is a weighted blend of 9 inputs, each scored 0–100. Each bar is that input's sub-score; the figure is the points it added to the 100-point composite (weight × sub-score).
- Cash flow +11.7/30.0
- ARV discount +7.5/15.0
- 1% rule +5.3/10.0
- Rent growth +5.0/5.0
- DSCR +3.4/10.0
- Livability +2.5/5.0
- Condition / age +2.5/5.0
- Schools +2.3/10.0
- Appreciation +0.0/10.0
$129,000
🖨 Deal sheet (PDF) 📄 Offer letter ✓ Due diligence
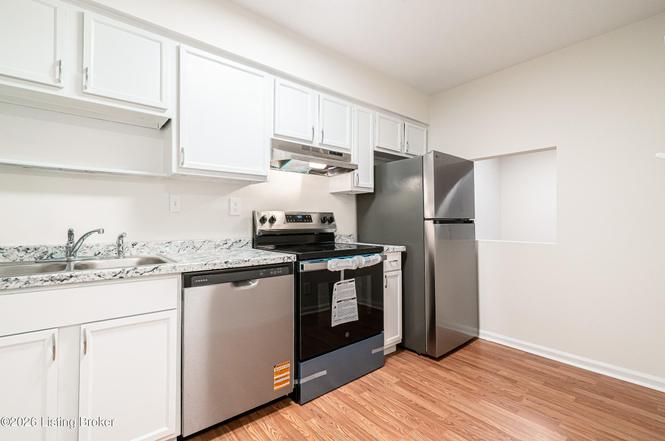
Listing remarks
Discover the perfect blend of comfort and convenience in this charming condo at 7010 Wildwood Circle, Unit 65. Ideally situated in the Wildwood Condominiums of Louisville (40291), this home offers a fantastic opportunity for downsizers, investors, and those who just want the convenience of ownership with a low maintenance lifestyle. Enjoy easy access to local shopping, dining, and expressways. This well-maintained unit is ready for your personal touch. Experience the best of Wildwood living at an exceptional price point. Schedule your showing today to see the potential this lovely residence has to offer! The laundry utilities are in place, but would some work to in a closet.
Key facts
- Well maintained unit
- $250 HOA
- Built 1979
Tags
Property features AI
Finance
- Other: Part of Wildwood Condominiums (65 units); Building number 7010
- HOA & community: Monthly maintenance fee (approximately $250)
Exterior
- Parking: Surface parking available
- Utilities: Electricity connected; Natural gas service available
- Home design: Condominium; Traditional style; Single-story unit (1st floor location); Building has 2 floors
- Construction: Built in 1979; Wood frame and brick construction; Shingle roof; Slab foundation
- Exterior features: Level lot; No fencing; Surface parking
Interior
- Kitchen: Kitchen on the first floor
- Bedrooms: Two bedrooms (both on the first floor); Primary bedroom on the first floor
- Bathrooms: One full bathroom; One half bathroom; Primary bathroom on the first floor; Full bathroom on the first floor
- Heating & cooling: Forced air heating (natural gas); Central air conditioning; One HVAC unit
- Interior features: Five total rooms; Six closets; No basement; No fireplaces; First-floor laundry
- Laundry & utility: Laundry on the first floor
Neighborhood map
What this means for you Summary
Snapshot
- This is a 2-bed/1.5-bath condo listed at $129k.
Deal economics
- At list price, monthly cash flow is $-38 ($-462/yr) — negative.
- To cash-flow at today's rent, offer at most $122k (5.3% below list).
- Meets the 1% rule at list price ($1k rent vs $129k).
- Recommended offer: $117k (9.0% below list) — sets the bar for market timing.
- Cap rate 5.9% vs local median 4.0% in Louisville/Jefferson County metro government (balance) — top-decile yield for the area; either an underpriced asset or a hidden risk that comps aren't pricing in. Stress-test before assuming the spread holds.
Location & tenants
- Location reads: area grade D — affects rentability + tenant quality, not the cash-flow math above.
- Jefferson County (urban): math 19% / reading 35% proficiency, ranked #121 of 165 in KY (top 73%) — low school quality limits family demand, transient renter base, plan for 1-2y turnover.
- Market conditions: Rents rising fast (+15.0%/yr); 294 active listings in the ZIP; 13 comparable units currently listed for rent nearby; rentals leasing fast (median 13d on market — plan ~1-2 weeks tenant-placement turnaround); solid renter incomes; 2,836 units permitted in Jefferson County in 2024 (1,558 in 5+ unit buildings).
Forward outlook
- Local home prices are declining (-3.0%/yr); year-one equity from $892 of loan paydown is wiped out by about $4k of value loss. Plan a longer hold.
- Jefferson County population projected at +13% by 2050 — modest demand growth; plan on rents tracking national, not racing it.
Negotiation context
- It's been on market 118 days — a 9% lower offer ($117k) is reasonable based on typical stale-listing flexibility.
Risks & watch-outs
- Climate carrying-cost: extreme-heat days projected 7→20/yr by 2055 (HVAC capex compounding) — expect insurance premiums to compound above CPI over the hold.
Questions for the listing agent
- What do current leases actually rent for vs. the listed asking? Can we see a recent rent roll and the last 12 months of T-12 income?
- It's been on market 118 days. Have you received any prior offers? Is the seller open to a 9% concession, seller financing, or rate buy-down credit?
- Built in 1979 — when were the roof, HVAC, electrical panel, plumbing, and water heater last replaced?
- What does the HOA fee cover, when was the last increase, and are there any pending special assessments or reserve-fund shortfalls?
- Any open or pending special assessments — roof, HVAC, plumbing, elevator, façade? What's the per-unit balance and payoff schedule, and is the seller paying it off at close or rolling it to the buyer?
- Why hasn't it sold? Are there any deal-killer items the seller is aware of (foundation, flood, title, zoning, code violations)?
- Is there a deadline driving the sale (1031 exchange, divorce, estate, relocation)? That informs how much negotiation room exists.
- The area grade is low — what's the realistic commute time and amenity access for the typical tenant pool here? Any planned neighborhood developments (good or bad) we should know about?
- What's the average days-on-market for RENTAL listings here right now (not sales)? A rising rental-DOM trend means longer vacancies and softer asking-rent achievability than the comps imply.
- What's the recent tenant-quality profile in this submarket — average credit score on applications, eviction rate, late-payment / NSF rate, and stable-employment percentage? A property-management company in the area should have these aggregated.
- How much new apartment / multifamily construction is in the pipeline within 1–3 miles? Heavy new supply (>2% of stock underway) typically softens rents 12–24 months out; light construction supports rent growth.
Investment metrics
- 1% rule
- 1.03% ✓
- Cap rate
- 5.94%
- Cash-on-cash
- -1.28%
- DSCR
- 0.94
- GRM
- 8.1
CMA / ARV
No comps found within radius.
Projected returns pro-forma
-3.0% appreciation · 8.0% rent growth · sell at horizon
- IRR
- -11.7%
- Equity multiple
- 0.55×
- Total profit
- $-16,188
- Equity at exit
- $19,234
- IRR
- 4.6%
- Equity multiple
- 1.42×
- Total profit
- $15,295
- Equity at exit
- $11,154
Cash invested: $36,120 (down + closing). Projections, not guarantees.
Landlord ↔ Tenant lean methodology
- Overall (STATE)
- 83 Strongly Landlord-Friendly
- State Kentucky
- 83 Strongly Landlord-Friendly · R+16
- County
- — inherits STATE
- City
- — inherits STATE
ZIP-level market 40291
- Rents YoY
- 15.0%
- Active inventory
- 294
- Price-to-rent
- 8.1×
Monthly cashflow live
- Estimated rent
- $1,329 high interval (Pro) →
- Mortgage (P&I)
- −$676
- Tax from tax record
- −$108 /mo · $1,300/yr
- Insurance
- −$54
- HOA
- −$250
- Vacancy / Maint / Mgmt
- −$279
- Net cashflow
- $-38
Break-even live
Sensitivity live
| Price | -10% $35 | -5% $-2 | +0% $-38 | +5% $-75 | +10% $-111 |
|---|---|---|---|---|---|
| Rent | -10% $-143 | -5% $-91 | +0% $-38 | +5% $14 | +10% $67 |
| Rate | -1.0pp $26 | -0.5pp $-6 | base $-38 | +0.5pp $-72 | +1.0pp $-106 |
UW: 25.0% down · 7.5% · 30yr · 1.5% tax · 5.0% vac · 8.0% maint · 8.0% mgmt
Financing live
Cash to close
- Down payment
- $32,250
- Closing costs
- $3,870
- Reserves months
- —
- Total cash needed
- —
Loan-product check · same deal, 3 products live
Conventional
25% down · 7.5% · 30yr
- Down + closing
- —
- Monthly P&I
- —
- Monthly cashflow
- —
- DSCR
- —
- Eligible?
- —
Personal DTI + credit; lowest rate.
DSCR
20% down · 8.5% · 30yr
- Down + closing
- —
- Monthly P&I
- —
- Monthly cashflow
- —
- DSCR
- —
- Eligible?
- —
No personal income docs; deal must DSCR.
Hard money
10% down · 12.0% · 12mo
- Down + closing
- —
- Monthly P&I
- —
- Monthly cashflow
- —
- DSCR
- —
- Eligible?
- —
Short-term bridge; refi at stabilization.
Rent comps 13 comps
| Address | Beds | Baths | Sqft | Rent | $/sqft | DOM | Units | Dist |
|---|---|---|---|---|---|---|---|---|
| 4603 Roxann Blvd Louisville, KY | 1.0 | 1.0 | 576 | $1,025 | $1.78 | 3d | 6 | 0.43mi |
| 7025 Bronner Cir Louisville, KY | 1.0–2.0 | 1.0–2.5 | 1050 | $1,403 | $1.34 | 12d | 9 | 0.70mi |
| 4204 Breckenridge Ln Louisville, KY | 1.0 | 1.0 | 650 | $892 | $1.37 | 15d | 7 | 0.81mi |
| 4313 Norbrook Dr Unit 4 Louisville, KY | 2.0 | 1.0 | 725 | $950 | $1.31 | 24d | 1 | 0.98mi |
| 4311 Norbrook Dr Apt 4 Louisville, KY | 1.0 | 1.0 | 550 | $850 | $1.55 | 24d | 1 | 0.99mi |
| 226 Granvil Dr Louisville, KY | 3.0 | 1.0 | 1050 | $1,800 | $1.71 | 4d | 1 | 1.01mi |
| 6003 Jo Danielle Pl Louisville, KY | 1.0–2.0 | 1.0–2.0 | 888 | $1,250 | $1.41 | 17d | 7 | 1.10mi |
| 5312 Poindexter Dr Louisville, KY | 1.0–3.0 | 1.0–2.0 | 824 | $1,092 | $1.33 | 3d | 7 | 1.16mi |
| 8308 Watterson Trl Louisville, KY | 1.0 | 1.0 | 794 | $1,229 | $1.55 | 4d | 4 | 1.20mi |
| 7610 Chelsea Gardens Cir Louisville, KY | 2.0–3.0 | 2.0 | 1220 | $1,494 | $1.22 | 3d | 21 | 1.21mi |
| 2106 Buechel Bank Rd Louisville, KY | 1.0–3.0 | 1.0 | 1000 | $1,234 | $1.23 | 4d | 7 | 1.48mi |
| 6710 Six Mile Ln Louisville, KY | 2.0 | 1.0 | 1005 | $1,275 | $1.27 | 24d | 1 | 1.49mi |
| 6710 Six Mile Ln Louisville, KY | 2.0 | 1.0 | 1005 | $1,275 | $1.27 | 15d | 1 | 1.49mi |
HOA detail condo
- Monthly dues
- $250 · $3,000/yr
- Assessments
- None detected in remarks — confirm with the listing agent.
Listing history 15 events
-
2026-06-21days on market $129,000 Active 118 DOM
-
2026-06-18days on market $129,000 Active 115 DOM
-
2026-06-17days on market $129,000 Active 114 DOM
-
2026-06-16days on market $129,000 Active 113 DOM
-
2026-06-15days on market $129,000 Active 112 DOM
-
2026-06-13days on market $129,000 Active 110 DOM
-
2026-06-10days on market $129,000 Active 107 DOM
-
2026-06-09days on market $129,000 Active 106 DOM
-
2026-06-08days on market $129,000 Active 105 DOM
-
2026-06-07days on market $129,000 Active 104 DOM
-
2026-06-03days on market $129,000 Active 100 DOM
-
2026-06-02days on market $129,000 Active 99 DOM
-
2026-06-01days on market $129,000 Active 98 DOM
-
2026-05-31days on market $129,000 Active 97 DOM
-
2026-02-24$129,000 Active
ⓘ Source: listings_history table (triggers on properties + properties_extension) + one-shot
backfill from property_details.listing_events for pre-trigger history.
Tax reassessment forecast KY · Resets to sale price
- Current annual tax
- $1,300 · $108/mo
- Projected year-2 tax
- $1,300 · $108/mo
- Expected delta
- $0/yr ($0/mo · 0.0%)
ⓘ Screening estimate from a state-policy table — verify with the county assessor before closing.
Climate risk First Street
- Flood 1/10 Low FEMA zone X (unshaded) · 0% chance over 30 yrs
- Wildfire 1/10 Low
- Heat 5/10 Major 7 d/yr ≥104°F today · 20 d/yr by 30 yrs out
- Wind 2/10 Low 3% chance of damaging wind over 30 yrs
- Air quality 3/10 Moderate 2 unhealthy d/yr today · 5 by 30 yrs out
Nearby sold comps map
Loading sold comps map…
Walkable amenities ~0.75 mi
Loading nearby amenities…
Taxation est. · year 1
- Rental income
- $15,951
- − Mortgage interest
- −$7,226
- − Property taxes
- −$1,300
- − Insurance
- −$645
- − Repairs & maintenance
- −$1,276
- − Management
- −$1,276
- − HOA
- −$3,000
- − Depreciation
- −$3,753
- Taxable loss
- −$2,525
- Est. tax savings @ 24.0%
- +$606
- After-tax cash flow
- $144/yr
For passive investors: Depreciation is non-cash, so a rental often shows a tax loss while cash-flowing — sheltering income. Rental losses are passive: they offset passive income freely, and up to $25,000/yr can offset ordinary (W-2) income if you actively participate and your MAGI is under $100k (phasing out to $0 by $150k); unused losses carry forward. On sale, claimed depreciation is recaptured at up to 25%, and gains may owe capital-gains tax (a 1031 exchange can defer both). Figures are a year-1 estimate at your 24.0% rate — not tax advice; consult a CPA.
Schools (NCES district)
- District
- Jefferson County
- NCES district ID
- 2102990
- Math proficiency
- 19% ▼ -17.00%
- Reading proficiency
- 35% ▼ -11.00%
- Median HH income
- $47,885
- Composite
- 23.45/100
- National rank
- #7884
- State rank
- #121 of 165 in KY
Livability — Louisville/Jefferson County metro government (balance)
No livability data for this city. (Only ~50 U.S. cities are tracked.)
Census & demographics
- Census place
- Louisville/Jefferson County metro government (balance), KY
- County
- Jefferson County · 790,184 people
- City population
- 419,741
- Metro
- Louisville/Jefferson County, KY-IN
- Population (ZIP)
- 41,222
- Household income
- $81,267
- Rent vs Own
- Severe rent burden
- 790.0
Population outlook (Jefferson County) Hauer SSP2
- Today (2025)
- 823,112 people
- By 2030
- 849,343 · +3.2%
- By 2040
- 895,696 · +8.8%
- By 2050
- 933,630 · +13.4%
- By 2075
- 1,028,262 · +24.9%
- By 2100
- 1,072,675 · +30.3%
Race, ethnicity, and origin ACS 2023
- Neighborhood character
- Predominantly White (66%)
- Race & ethnicity
- White 66% Black 19% Two or more races 8% Hispanic / Latino 8% Asian 3%
- Hispanic origin (detail)
- Mexican 4%
- Common ancestry
- Italian 4% Slovak 3% Lithuanian 2%
- Foreign-born
- 7% · Canada, India, Vietnam
- Languages at home
- 89% English-only · Spanish 4% Russian/Polish/Slavic 1% French/Haitian/Cajun 1%
Political lean MEDSL · Jefferson
- 2024 margin
- D (+16.6) · D 57.4% · R 40.9% · Other 1.7%
- 2008→2024 swing
- +4.5pp toward D · 2008: 12.0pp · 2024: 16.6pp
- All cycles
- 2024: D+16.6 2020: D+20.1 2016: D+13.3 2012: D+11.1 2008: D+12.0
Not yet ingested
- Civics
- —
Market trends
- HPI YoY
- ▼ -279.15%
- Current HPI
- 218.0784
- Rent YoY
- ▲ 14.96%
- Metro
- Louisville/Jefferson County, KY-IN
- State GDP YoY
- ▲ 1.81%
- F500 in state
- 4
Industry mix (Fortune 500 HQ in KY)
| Industry | F500 HQs | Revenue |
|---|---|---|
| Healthcare | 1 | $118B |
|
||
| Food / Beverage | 1 | $7B |
|
||
Price history
1 event — show timeline
- 2026-02-24 Listed $129,000 Metro Search MLS
Property tax history
+5.8%/yrLatest (2025): $1,300 · +41.4% YoY. Source: county tax records.
Cash-flow waterfall
monthlySold comps — $/sqft
last 12 mo · ≤1 miLoading sold comps…