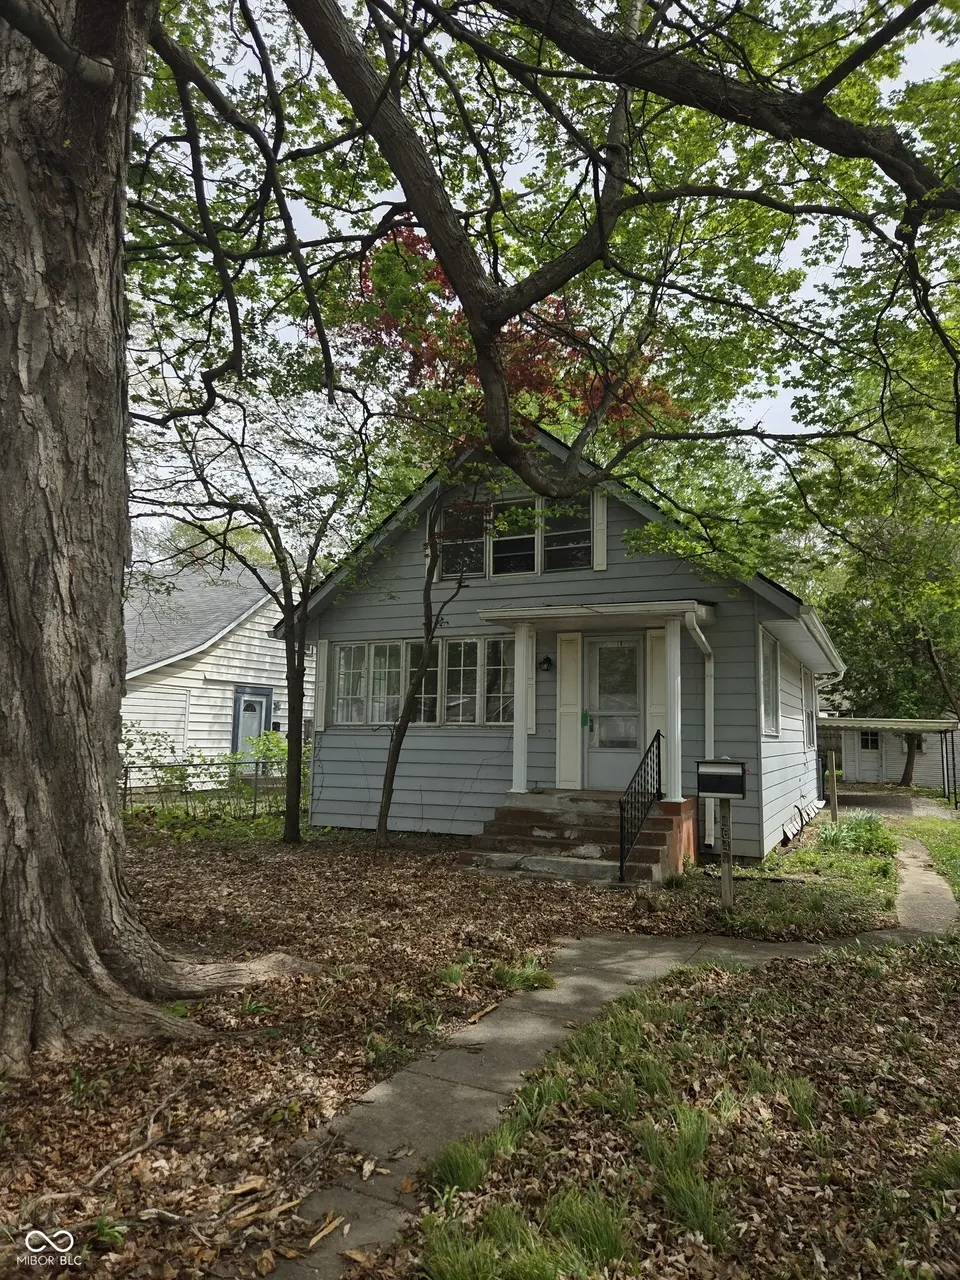
4645 Rookwood Ave · Indianapolis city (balance), IN
Flood risk 1/10 · Minimal
- FEMA flood zone
- X (unshaded)
- Chance of flooding over 30 yrs
- 0.0%
- Est. flood insurance / yr
- $507 – $1,088
Fire risk 1/10 · Minimal
- Est. fire insurance / yr
- $717 – $1,331
Heat risk 3/10 · Minor
- Hot days now (above 101°F)
- 7 days/yr
- Hot days in 30 yrs
- 17 days/yr
Wind risk 2/10 · Minimal
- Chance of severe wind over 30 yrs
- 0.0%
Air-quality risk 4/10 · Minor
- Unhealthy air days now
- 5 days/yr
- Unhealthy air days in 30 yrs
- 7 days/yr
Risk factors via First Street. Map © Google.
Why this score? — see what drove the D grade
The composite is a weighted blend of 9 inputs, each scored 0–100. Each bar is that input's sub-score; the figure is the points it added to the 100-point composite (weight × sub-score).
- ARV discount +15.0/15.0
- Cash flow +11.5/30.0
- Rent growth +4.1/5.0
- DSCR +3.4/10.0
- 1% rule +3.3/10.0
- Livability +2.5/5.0
- Condition / age +2.5/5.0
- Schools +1.4/10.0
- Appreciation +0.0/10.0
$274,900
🖨 Deal sheet (PDF) 📄 Offer letter ✓ Due diligence
Listing remarks MLS
Discover the blend of classic charm and modern convenience in this inviting bungalow just steps from Butler University. This 3-bedroom/ 1-bath home, located in the sought-after Butler Tarkington neighborhood, offers an ideal investment opportunity or a cozy personal residence. Inside, you'll find a warm atmosphere, accentuated rich hardwoods that grace the floors. The thoughtful layout includes a well-equipped kitchen and comfortable living spaces. Convenience meets privacy with the alley entrance behind the home, ensuring easy access and adding a touch of seclusion. Whether you're envisioning a smart investment venture or dreaming of your own home, this property is your canvas. Don't miss the chance to make this charming residence your own in this highly desirable location!
Key facts
- Upstairs area
- Plenty of parking
- Charming renovation
Tags
Property features AI
Exterior
- Parking: Detached carport; Detached 1-car garage (approx. 240 sq ft)
- Utilities: Public water; Municipal sewer connected
- Home design: Single-family residence; One and one-half stories; Property type: Residential; Lot under 1/4 acre (approx. 0.14 acre)
- Construction: Aluminum siding; Block foundation
- Exterior features: Covered patio/porch
Interior
- Kitchen: Microwave with hood; Gas oven; Refrigerator; Eat-in kitchen layout
- Bedrooms: Two bedrooms total — one on the main level and one on the upper level
- Bathrooms: One full bathroom
- Heating & cooling: Forced air heating; Central air conditioning
- Interior features: Attic access; Eat-in kitchen; Covered porch
- Laundry & utility: Laundry connections in the unit
Neighborhood map
What this means for you Summary
Snapshot
- This is a 3-bed/1.0-bath single-family listed at $275k.
Deal economics
- At list price, monthly cash flow is $-92 ($-1k/yr) — negative.
- To cash-flow at today's rent, offer at most $259k (5.9% below list).
- To meet the 1% rule (rent ≥ 1% of price), the offer needs to be $227k (17.5% below list).
- Recommended offer: $227k (17.5% below list) — sets the bar for 1% rule.
- Cap rate 5.9% vs local median 4.4% in Indianapolis city (balance) — top-decile yield for the area; either an underpriced asset or a hidden risk that comps aren't pricing in. Stress-test before assuming the spread holds.
Location & tenants
- Location reads: area grade D — affects rentability + tenant quality, not the cash-flow math above.
- Indianapolis Public Schools (urban): math 14% / reading 20% proficiency, ranked #286 of 301 in IN (top 95%) — low school quality limits family demand, transient renter base, plan for 1-2y turnover; 77% free/reduced lunch — lower-income household profile, screen leases tightly.
- Zoned schools: Center For Inquiry School 84 (math 64% / reading 69%, grade B+, #65 of 994 statewide, top 7%, 469 students, 8% FRL); H L Harshman Middle School (math 3% / reading 16%, grade F, #316 of 330 statewide, top 96%, 549 students, 84% FRL) — zoned schools average 46% FRL vs 77% district-wide (31 pts lower); this property's tenant base skews higher-income than the district average.
- Zoned-school proficiency averages 38% at this address vs 17% district-wide (+21 pts) — the actual schools serving this property are materially stronger than the Indianapolis Public Schools average implies; a family-tenant draw the district grade alone would hide.
- Market conditions: Rents rising fast (+6.4%/yr); 286 active listings in the ZIP; 31 comparable units currently listed for rent nearby; rentals at typical pace (median 16d on market — plan ~3-4 weeks tenant-placement turnaround); 1,906 units permitted in Marion County in 2024 (621 in 5+ unit buildings).
- At $2,269/mo this rent would consume 45% of the median local household income ($60k/yr) (locally 978% of renters already pay >50% of income on rent) — very limited rent-growth headroom before tenants either downsize or default.
Forward outlook
- Local home prices are declining (-3.0%/yr); year-one equity from $2k of loan paydown is wiped out by about $8k of value loss. Plan a longer hold.
- Marion County population projected at +18% by 2050 — long-run rental-demand tailwind backs the buy-and-hold thesis.
Negotiation context
- It's been on market 56 days — a 3% lower offer ($267k) is reasonable based on typical stale-listing flexibility.
- 5 sale attempts since 23y ago with the ask held roughly flat each time — persistent listings suggest the price (not the market) is what's stuck; bring a comps-based counter.
- Current owner paid $235k; 17% above their basis — modest negotiation headroom, anchor on the comps not their cost.
Risks & watch-outs
- Watch-outs: built in 1925 — expect roof / HVAC / electrical / plumbing capex.
Questions for the listing agent
- What do current leases actually rent for vs. the listed asking? Can we see a recent rent roll and the last 12 months of T-12 income?
- It's been on market 56 days. Have you received any prior offers? Is the seller open to a 17% concession, seller financing, or rate buy-down credit?
- Built in 1925 — when were the roof, HVAC, electrical panel, plumbing, and water heater last replaced?
- Is there a deadline driving the sale (1031 exchange, divorce, estate, relocation)? That informs how much negotiation room exists.
- The area grade is low — what's the realistic commute time and amenity access for the typical tenant pool here? Any planned neighborhood developments (good or bad) we should know about?
- What's the average days-on-market for RENTAL listings here right now (not sales)? A rising rental-DOM trend means longer vacancies and softer asking-rent achievability than the comps imply.
- What's the recent tenant-quality profile in this submarket — average credit score on applications, eviction rate, late-payment / NSF rate, and stable-employment percentage? A property-management company in the area should have these aggregated.
- How much new for-sale + rental construction is in the pipeline within 1–3 miles? Heavy new supply typically softens prices + rents 12–24 months out; constrained supply supports both.
Investment metrics
- 1% rule
- 0.83% ✗
- Cap rate
- 5.89%
- Cash-on-cash
- -1.44%
- DSCR
- 0.94
- GRM
- 10.1
CMA / ARV
- ARV (median comp)
- $349,980
- List price
- $274,900
- Delta
- -21.45%
- Verdict
- UNDERPRICED
- Comps
- 20 within 1.0 mi
Show comp detail 12 sales within ~0.75 mi
| Address | Dist | Beds/Ba | Sqft | Sold | Price | $/sf | Match |
|---|---|---|---|---|---|---|---|
| 423 Berkley Rd | 0.43mi | 2/2.0 (-1) | 1,680 (+4%) | 2mo | $338,900 | $202 | 62 |
| 530 W 41st St | 0.69mi | 3/2.5 | 1,618 (+1%) | 3mo | $345,000 | $213 | 58 |
| 4137 Rookwood Ave | 0.63mi | 2/1.0 (-1) | 1,512 (-6%) | 2mo | $270,000 | $179 | 54 |
| 4125 Clarendon Rd | 0.68mi | 2/1.5 (-1) | 1,681 (+4%) | 4mo | $132,000 | $79 | 50 |
| 4235 Rookwood Ave | 0.52mi | 2/1.5 (-1) | 1,769 (+10%) | 2mo | $130,000 | $73 | 50 |
| 4130 Rookwood Ave | 0.64mi | 2/1.5 (-1) | 1,752 (+9%) | 2mo | $215,000 | $123 | 46 |
| 5308 Boulevard Pl | 0.57mi | 3/2.0 | 1,816 (+13%) | 3mo | $335,000 | $184 | 46 |
| 637 Berkley Rd | 0.46mi | 3/1.0 | 1,848 (+15%) | 13mo | $235,000 | $127 | 43 |
| 401 W Westfield Blvd | 0.60mi | 2/1.0 (-1) | 1,485 (-8%) | 15mo | $330,000 | $222 | 42 |
| 4070 Cornelius Ave | 0.73mi | 2/1.0 (-1) | 1,560 (-3%) | 18mo | $187,000 | $120 | 41 |
| 4123 Graceland Ave | 0.72mi | 3/2.5 | 1,803 (+12%) | 2mo | $375,000 | $208 | 39 |
| 521 W 42nd St | 0.62mi | 3/2.0 | 1,491 (-7%) | 21mo | $280,000 | $188 | 37 |
Match score weights: distance 35% · size 25% · config 20% · recency 20%. Top-matched comps best support the ARV.
Projected returns pro-forma
-3.0% appreciation · 6.43% rent growth · sell at horizon
- IRR
- -14.9%
- Equity multiple
- 0.45×
- Total profit
- $-42,286
- Equity at exit
- $40,988
- IRR
- -1.4%
- Equity multiple
- 0.89×
- Total profit
- $-8,608
- Equity at exit
- $23,768
Cash invested: $76,972 (down + closing). Projections, not guarantees.
Landlord ↔ Tenant lean methodology
- Overall (STATE)
- 90 Strongly Landlord-Friendly
- State Indiana
- 90 Strongly Landlord-Friendly · R+11
- County
- — inherits STATE
- City
- — inherits STATE
ZIP-level market 46208
- Rents YoY
- 6.4%
- Active inventory
- 286
- Price-to-rent
- 10.1×
Monthly cashflow live
- Estimated rent
- $2,269 high interval (Pro) →
- Mortgage (P&I)
- −$1,442
- Tax from tax record
- −$328 /mo · $3,938/yr
- Insurance
- −$115
- HOA
- −$0
- Lot rent
- −$0
- Vacancy / Maint / Mgmt
- −$476
- Net cashflow
- $-92
Break-even live
Sensitivity live
| Price | -10% $64 | -5% $-14 | +0% $-92 | +5% $-170 | +10% $-248 |
|---|---|---|---|---|---|
| Rent | -10% $-271 | -5% $-182 | +0% $-92 | +5% $-2 | +10% $87 |
| Rate | -1.0pp $46 | -0.5pp $-22 | base $-92 | +0.5pp $-163 | +1.0pp $-236 |
UW: 25.0% down · 7.5% · 30yr · 1.5% tax · 5.0% vac · 8.0% maint · 8.0% mgmt
Financing live
Cash to close
- Down payment
- $68,725
- Closing costs
- $8,247
- Reserves months
- —
- Total cash needed
- —
Loan-product check · same deal, 3 products live
Conventional
25% down · 7.5% · 30yr
- Down + closing
- —
- Monthly P&I
- —
- Monthly cashflow
- —
- DSCR
- —
- Eligible?
- —
Personal DTI + credit; lowest rate.
DSCR
20% down · 8.5% · 30yr
- Down + closing
- —
- Monthly P&I
- —
- Monthly cashflow
- —
- DSCR
- —
- Eligible?
- —
No personal income docs; deal must DSCR.
Hard money
10% down · 12.0% · 12mo
- Down + closing
- —
- Monthly P&I
- —
- Monthly cashflow
- —
- DSCR
- —
- Eligible?
- —
Short-term bridge; refi at stabilization.
Rent comps 31 comps
| Address | Beds | Baths | Sqft | Rent | $/sqft | DOM | Units | Dist |
|---|---|---|---|---|---|---|---|---|
| 4623 Rookwood Ave Indianapolis, IN | 3.0 | 3.5 | 1792 | $3,200 | $1.79 | 18d | 1 | 0.06mi |
| 4631 Graceland Ave Indianapolis, IN | 4.0 | 2.0 | 2019 | $2,900 | $1.44 | 5d | 1 | 0.24mi |
| 402 W 52nd St Indianapolis, IN | 3.0 | 2.5 | 1328 | $2,200 | $1.66 | 16d | 1 | 0.42mi |
| 4930 N Illinois St Indianapolis, IN | 3.0 | 1.0 | 1400 | $2,195 | $1.57 | 1d | 1 | 0.42mi |
| 528 W 43rd St Indianapolis, IN | 4.0 | 2.0 | 2080 | $2,750 | $1.32 | 5d | 1 | 0.48mi |
| 206 W 43rd St Indianapolis, IN | 3.0 | 2.5 | 1544 | $2,500 | $1.62 | 26d | 1 | 0.54mi |
| 731 W 43rd St Indianapolis, IN | 4.0 | 4.0 | 1600 | $3,350 | $2.09 | 20d | 1 | 0.58mi |
| 4117 Byram Ave Indianapolis, IN | 4.0 | 2.0 | 1540 | $1,930 | $1.25 | 46d | 1 | 0.69mi |
| 608 Bernard Ave Indianapolis, IN | 3.0 | 2.0 | 1056 | $1,475 | $1.40 | 5d | 1 | 0.81mi |
| 319 W 40th St Indianapolis, IN | 3.0 | 1.0 | 1176 | $1,295 | $1.10 | 16d | 1 | 0.90mi |
| 320 W 39th St Indianapolis, IN | 4.0 | 2.0 | 1216 | $2,200 | $1.81 | 10d | 1 | 1.01mi |
| 525 E 52nd St Indianapolis, IN | 3.0 | 1.5 | 1080 | $1,600 | $1.48 | 26d | 1 | 1.03mi |
| 3965 N Meridian St Indianapolis, IN | 2.0 | 2.0 | 1360 | $1,650 | $1.21 | 26d | 1 | 1.06mi |
| 645 E 49th St Indianapolis, IN | 3.0 | 1.0 | 1082 | $1,750 | $1.62 | 6d | 1 | 1.09mi |
| 3827 Graceland Ave Indianapolis, IN | 4.0 | 2.0 | 2195 | $1,595 | $0.73 | 46d | 1 | 1.09mi |
| 4704 N College Ave Indianapolis, IN | 3.0 | 1.5 | 2049 | $1,695 | $0.83 | 1d | 1 | 1.14mi |
| 4704 N College Ave Indianapolis, IN | 3.0 | 1.5 | 2049 | $1,695 | $0.83 | 16d | 1 | 1.14mi |
| 4022 Central Ave Indianapolis, IN | 3.0 | 1.0 | 1288 | $1,500 | $1.16 | 24d | 1 | 1.21mi |
| 3801 N Meridian St Indianapolis, IN | 1.0–3.0 | 1.0–2.0 | 1057 | $2,022 | $1.91 | 22d | 35 | 1.23mi |
| 3729 N Kenwood Ave Indianapolis, IN | 2.0 | 1.0 | 1107 | $1,100 | $0.99 | 46d | 1 | 1.24mi |
| 3655 N Kenwood Ave Indianapolis, IN | 4.0 | 2.0 | 1700 | $1,700 | $1.00 | 26d | 1 | 1.31mi |
| 4340 Guilford Ave Indianapolis, IN | 2.0 | 1.0 | 1200 | $1,400 | $1.17 | 24d | 1 | 1.35mi |
| 5446 N College Ave Indianapolis, IN | 2.0 | 1.5 | 1064 | $1,800 | $1.69 | 26d | 1 | 1.35mi |
| 3622 N Capitol Ave Indianapolis, IN | 3.0 | 1.0 | 1300 | $1,300 | $1.00 | 10d | 1 | 1.36mi |
| 3621 N Kenwood Ave Indianapolis, IN | 3.0 | 1.5 | 1521 | $1,599 | $1.05 | 5d | 1 | 1.38mi |
| 4073 N College Ave Indianapolis, IN | 2.0 | 2.5 | 2000 | $2,500 | $1.25 | 46d | 1 | 1.40mi |
| 4040 N College Ave Indianapolis, IN | 3.0 | 1.5 | 1280 | $1,900 | $1.48 | 10d | 1 | 1.40mi |
| 4071 N College Ave Indianapolis, IN | 2.0 | 2.5 | 2000 | $2,200 | $1.10 | 6d | 1 | 1.40mi |
| 3707 N Meridian St Indianapolis, IN | 2.0 | 1.0–2.0 | 1042 | $1,199 | $1.15 | 46d | 1 | 1.40mi |
| 2135 Winthrop Ave Indianapolis, IN | 1.0–3.0 | 1.0–2.0 | 926 | $2,400 | $2.59 | 10d | 1 | 1.42mi |
| 3542 Graceland Ave Indianapolis, IN | 4.0 | 1.0 | 1114 | $1,395 | $1.25 | 1d | 1 | 1.42mi |
Listing history 25 events
-
2026-06-22days on market $274,900 Active 56 DOM
-
2026-06-21days on market $274,900 Active 55 DOM
-
2026-06-18days on market $274,900 Active 52 DOM
-
2026-06-17days on market $274,900 Active 51 DOM
-
2026-06-16days on market $274,900 Active 50 DOM
-
2026-06-15days on market $274,900 Active 49 DOM
-
2026-06-13days on market $274,900 Active 47 DOM
-
2026-06-13days on market $274,900 Active 46 DOM
-
2026-06-09days on market $274,900 Active 43 DOM
-
2026-06-08days on market $274,900 Active 42 DOM
-
2026-06-07days on market $274,900 Active 41 DOM
-
2026-06-03pricedays on market $274,900 Active 37 DOM
-
2026-06-02days on market $279,900 Active 36 DOM
-
2026-06-01days on market $279,900 Active 35 DOM
-
2026-05-31days on market $279,900 Active 34 DOM
-
2026-04-27$279,900 Active 536-char remark
-
2026-04-02historical
-
2026-02-19$330,000 Active
-
2023-11-17soldstatus $235,000 Closed
Show marketing remark (785 chars)
Discover the blend of classic charm and modern convenience in this inviting bungalow just steps from Butler University. This 3-bedroom/ 1-bath home, located in the sought-after Butler Tarkington neighborhood, offers an ideal investment opportunity or a cozy personal residence. Inside, you'll find a warm atmosphere, accentuated rich hardwoods that grace the floors. The thoughtful layout includes a well-equipped kitchen and comfortable living spaces. Convenience meets privacy with the alley entrance behind the home, ensuring easy access and adding a touch of seclusion. Whether you're envisioning a smart investment venture or dreaming of your own home, this property is your canvas. Don't miss the chance to make this charming residence your own in this highly desirable location!
-
2023-11-06status Pending
Show marketing remark (785 chars)
Discover the blend of classic charm and modern convenience in this inviting bungalow just steps from Butler University. This 3-bedroom/ 1-bath home, located in the sought-after Butler Tarkington neighborhood, offers an ideal investment opportunity or a cozy personal residence. Inside, you'll find a warm atmosphere, accentuated rich hardwoods that grace the floors. The thoughtful layout includes a well-equipped kitchen and comfortable living spaces. Convenience meets privacy with the alley entrance behind the home, ensuring easy access and adding a touch of seclusion. Whether you're envisioning a smart investment venture or dreaming of your own home, this property is your canvas. Don't miss the chance to make this charming residence your own in this highly desirable location!
-
2023-11-02status Active
Show marketing remark (785 chars)
Discover the blend of classic charm and modern convenience in this inviting bungalow just steps from Butler University. This 3-bedroom/ 1-bath home, located in the sought-after Butler Tarkington neighborhood, offers an ideal investment opportunity or a cozy personal residence. Inside, you'll find a warm atmosphere, accentuated rich hardwoods that grace the floors. The thoughtful layout includes a well-equipped kitchen and comfortable living spaces. Convenience meets privacy with the alley entrance behind the home, ensuring easy access and adding a touch of seclusion. Whether you're envisioning a smart investment venture or dreaming of your own home, this property is your canvas. Don't miss the chance to make this charming residence your own in this highly desirable location!
-
2023-10-19historical
Show marketing remark (785 chars)
Discover the blend of classic charm and modern convenience in this inviting bungalow just steps from Butler University. This 3-bedroom/ 1-bath home, located in the sought-after Butler Tarkington neighborhood, offers an ideal investment opportunity or a cozy personal residence. Inside, you'll find a warm atmosphere, accentuated rich hardwoods that grace the floors. The thoughtful layout includes a well-equipped kitchen and comfortable living spaces. Convenience meets privacy with the alley entrance behind the home, ensuring easy access and adding a touch of seclusion. Whether you're envisioning a smart investment venture or dreaming of your own home, this property is your canvas. Don't miss the chance to make this charming residence your own in this highly desirable location!
-
2023-10-18$235,000
Show marketing remark (785 chars)
Discover the blend of classic charm and modern convenience in this inviting bungalow just steps from Butler University. This 3-bedroom/ 1-bath home, located in the sought-after Butler Tarkington neighborhood, offers an ideal investment opportunity or a cozy personal residence. Inside, you'll find a warm atmosphere, accentuated rich hardwoods that grace the floors. The thoughtful layout includes a well-equipped kitchen and comfortable living spaces. Convenience meets privacy with the alley entrance behind the home, ensuring easy access and adding a touch of seclusion. Whether you're envisioning a smart investment venture or dreaming of your own home, this property is your canvas. Don't miss the chance to make this charming residence your own in this highly desirable location!
-
2003-04-28soldstatus $97,850
-
2003-03-25$97,850
ⓘ Source: listings_history table (triggers on properties + properties_extension) + one-shot
backfill from property_details.listing_events for pre-trigger history.
Tax reassessment forecast IN · Partial reset (capped growth)
- Current annual tax
- $3,938 · $328/mo
- Projected year-2 tax
- $3,938 · $328/mo
- Expected delta
- $0/yr ($0/mo · 0.0%)
ⓘ Screening estimate from a state-policy table — verify with the county assessor before closing.
Climate risk First Street
- Flood 1/10 Low FEMA zone X (unshaded) · 0% chance over 30 yrs
- Wildfire 1/10 Low
- Heat 3/10 Moderate 7 d/yr ≥101°F today · 17 d/yr by 30 yrs out
- Wind 2/10 Low 0% chance of damaging wind over 30 yrs
- Air quality 4/10 Moderate 5 unhealthy d/yr today · 7 by 30 yrs out
Nearby sold comps map
Loading sold comps map…
Walkable amenities ~0.75 mi
Loading nearby amenities…
Taxation est. · year 1
- Rental income
- $27,224
- − Mortgage interest
- −$15,399
- − Property taxes
- −$3,938
- − Insurance
- −$1,374
- − Repairs & maintenance
- −$2,178
- − Management
- −$2,178
- − Depreciation
- −$7,997
- Taxable loss
- −$5,840
- Est. tax savings @ 24.0%
- +$1,402
- After-tax cash flow
- $297/yr
For passive investors: Depreciation is non-cash, so a rental often shows a tax loss while cash-flowing — sheltering income. Rental losses are passive: they offset passive income freely, and up to $25,000/yr can offset ordinary (W-2) income if you actively participate and your MAGI is under $100k (phasing out to $0 by $150k); unused losses carry forward. On sale, claimed depreciation is recaptured at up to 25%, and gains may owe capital-gains tax (a 1031 exchange can defer both). Figures are a year-1 estimate at your 24.0% rate — not tax advice; consult a CPA.
Schools (NCES district)
- District
- Indianapolis Public Schools
- NCES district ID
- 1804770
- Math proficiency
- 14% ▼ -7.00%
- Reading proficiency
- 20% ▼ -3.00%
- Median HH income
- $32,034
- Composite
- 13.69/100
- National rank
- #9499
- State rank
- #286 of 301 in IN
Livability — Indianapolis city (balance)
No livability data for this city. (Only ~50 U.S. cities are tracked.)
Census & demographics
- Census place
- Indianapolis city (balance), IN
- County
- Marion County · 998,460 people
- City population
- 881,119
- Metro
- Indianapolis-Carmel-Anderson, IN
- Population (ZIP)
- 22,379
- Household income
- $60,062
- Rent vs Own
- Severe rent burden
- 978.0
Population outlook (Marion County) Hauer SSP2
- Today (2025)
- 1,025,572 people
- By 2030
- 1,065,727 · +3.9%
- By 2040
- 1,141,577 · +11.3%
- By 2050
- 1,208,920 · +17.9%
- By 2075
- 1,367,288 · +33.3%
- By 2100
- 1,438,201 · +40.2%
Race, ethnicity, and origin ACS 2023
- Neighborhood character
- Diverse neighborhood (Simpson 0.62)
- Race & ethnicity
- White 46% Black 40% Hispanic / Latino 8% Two or more races 6% Asian 2%
- Hispanic origin (detail)
- Mexican 4%
- Common ancestry
- Romanian 2% Slovak 2% Italian 1%
- Foreign-born
- 4% · Canada
- Languages at home
- 93% English-only · Spanish 5% French/Haitian/Cajun 1% Other Indo-European 1%
Political lean MEDSL · Marion
- 2024 margin
- Strong D (+27.7) · D 63.0% · R 35.3% · Other 1.7%
- 2008→2024 swing
- -0.7pp no change · 2008: 28.4pp · 2024: 27.7pp
- All cycles
- 2024: D+27.7 2020: D+29.1 2016: D+22.8 2012: D+22.2 2008: D+28.4
Not yet ingested
- Civics
- —
Market trends
- HPI YoY
- ▼ -324.63%
- Current HPI
- 319.7725
- Rent YoY
- ▲ 6.43%
- Metro
- Indianapolis-Carmel-Anderson, IN
- State GDP YoY
- ▲ 2.90%
- F500 in state
- 18
Industry mix (Fortune 500 HQ in IN)
| Industry | F500 HQs | Revenue |
|---|---|---|
| Industrial Machinery | 2 | $37B |
|
||
| Healthcare | 1 | $177B |
|
||
| Pharmaceuticals | 1 | $45B |
|
||
| Metals / Steel | 1 | $18B |
|
||
| Agriculture | 1 | $17B |
|
||
| Packaging | 1 | $12B |
|
||
Price history
+180.9% since first listed11 events — show timeline
- 2026-06-02 Price Changed $274,900 MIBOR as Distributed by MLS Grid
- 2026-04-27 Listed $279,900 MIBOR as Distributed by MLS Grid
- 2026-04-02 Listing Removed — MIBOR as Distributed by MLS Grid
- 2026-02-19 Listed $330,000 MIBOR as Distributed by MLS Grid
- 2023-11-17 Sold (MLS) $235,000 MIBOR as Distributed by MLS Grid
- 2023-11-06 Pending — MIBOR as Distributed by MLS Grid
- 2023-11-02 Relisted — MIBOR as Distributed by MLS Grid
- 2023-10-19 Listing Removed — MIBOR as Distributed by MLS Grid
- 2023-10-18 Listed $235,000 MIBOR as Distributed by MLS Grid
- 2003-04-28 Sold (MLS) $97,850 MIBOR as Distributed by MLS Grid
- 2003-03-25 Listed $97,850 MIBOR as Distributed by MLS Grid
Property tax history
+3.6%/yrLatest (2025): $3,938 · +2.2% YoY. Source: county tax records.
Cash-flow waterfall
monthlySold comps — $/sqft
last 12 mo · ≤1 miLoading sold comps…