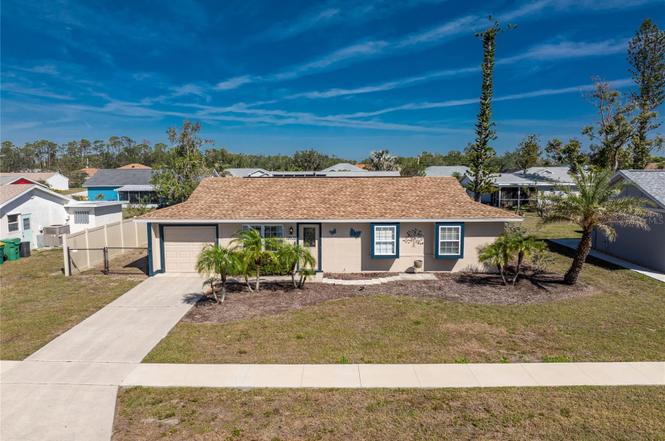
13532 Romford Ave · North Port, FL
Flood risk 9/10 · Severe
- FEMA flood zone
- AE
- Chance of flooding over 30 yrs
- 0.99%
- Est. flood insurance / yr
- $1,737 – $8,500
Fire risk 2/10 · Minimal
- Est. fire insurance / yr
- $947 – $1,759
Heat risk 10/10 · Severe
- Hot days now (above 106°F)
- 7 days/yr
- Hot days in 30 yrs
- 29 days/yr
Wind risk 10/10 · Severe
- Chance of severe wind over 30 yrs
- 99.0%
Air-quality risk 2/10 · Minimal
- Unhealthy air days now
- 1 days/yr
- Unhealthy air days in 30 yrs
- 1 days/yr
Risk factors via First Street. Map © Google.
Why this score? — see what drove the C+ grade
The composite is a weighted blend of 9 inputs, each scored 0–100. Each bar is that input's sub-score; the figure is the points it added to the 100-point composite (weight × sub-score).
- Cash flow +22.8/30.0
- ARV discount +14.6/15.0
- DSCR +7.3/10.0
- 1% rule +5.3/10.0
- Schools +4.6/10.0
- Rent growth +3.8/5.0
- Livability +3.8/5.0
- Condition / age +2.5/5.0
- Appreciation +0.0/10.0
$229,900
🖨 Deal sheet (PDF) 📄 Offer letter ✓ Due diligence
Listing remarks MLS
SUPER HOME, offers 3 bedrooms, 2 baths, 1 car garage. Clean and updated. this home shows pride in ownership. NOT a drive-by. You MUST come in and will be happily surprised. This home is ready for you now. This location offers you a great deal of enjoyment, such as 2 POOLS, Tennis Courts, shuffleboard, Rec Building. Close to beaches, fishing, boat ramps, schools and shopping.
Key facts
- Fenced yard
- Shuffleboard
- New roof
Tags
Property features AI
Finance
- Other: Property zoning: RSF5
- Financial info: Lease restrictions apply
- HOA & community: HOA: Gardens of Gulf Cove; HOA required with annual fee of $470 (monthly approx. $39.17); Association approval required; Pets allowed
Exterior
- Parking: Attached garage (1 car, 10x18)
- Utilities: Public water; Public sewer; Cable connected; Electricity connected; Water connected
- Home design: Single family residence; One story; South facing; Residential property
- Construction: Stucco exterior; Shingle roof; Slab foundation; Built area about 1,370–1,550 sq ft (per public records)
- Exterior features: Sidewalk; Asphalt road access
Interior
- Kitchen: Dishwasher; Microwave; Range; Refrigerator
- Bedrooms: 3 bedrooms
- Flooring: Carpet; Ceramic tile
- Bathrooms: 2 full bathrooms
- Heating & cooling: Electric heating; Central air conditioning
- Interior features: Ceiling fans; Eat-in kitchen; Window treatments
- Laundry & utility: Laundry room; Washer; Dryer
Neighborhood map
What this means for you Summary
Snapshot
- This is a 3-bed/2.0-bath single-family listed at $230k.
Deal economics
- At list price, monthly cash flow is $-27 ($-329/yr) — negative.
- To cash-flow at today's rent, offer at most $225k (2.1% below list).
- Meets the 1% rule at list price ($2k rent vs $230k).
- Recommended offer: $202k (12.0% below list) — sets the bar for market timing.
- Cap rate 8.4% vs local median 3.8% in North Port — top-decile yield for the area; either an underpriced asset or a hidden risk that comps aren't pricing in. Stress-test before assuming the spread holds.
Location & tenants
- Location reads 75/100 on livability (#252 in FL, #3,975 nationally) — a middle-class / working-renter tenant base. Strengths: crime A+, housing A+, health & safety A+; Watch: amenities F, commute F.
- Charlotte (suburban): math 54% / reading 54% proficiency, ranked #22 of 73 in FL (top 30%) — acceptable for families but not a draw, mixed tenant base, ~2y average lease.
- Zoned schools: Myakka River Elementary School (math 65% / reading 60%, grade B, #601 of 2,144 statewide, top 28%, 608 students, 51% FRL); L. A. Ainger Middle School (math 65% / reading 53%, grade B, #144 of 571 statewide, top 26%, 720 students, 40% FRL); Lemon Bay High School (math 50% / reading 56%, grade C-, #148 of 667 statewide, top 23%, 1,360 students, 28% FRL).
- Market conditions: Rents rising fast (+5.3%/yr); 2198 active listings in the ZIP; 12 comparable units currently listed for rent nearby; rentals at typical pace (median 23d on market — plan ~3-4 weeks tenant-placement turnaround); solid renter incomes; 4,585 units permitted in Charlotte County in 2024 (703 in 5+ unit buildings).
- This rent runs 34% of the median local income ($84k/yr) — at the standard rent-burdened threshold; future hikes will face affordability resistance.
Forward outlook
- Local home prices are declining (-3.0%/yr); year-one equity from $2k of loan paydown is wiped out by about $7k of value loss. Plan a longer hold.
- Charlotte County population projected at +24% by 2050 — long-run rental-demand tailwind backs the buy-and-hold thesis.
Negotiation context
- It's been on market 440 days — a 12% lower offer ($202k) is reasonable based on typical stale-listing flexibility.
- 5 sale attempts since 20y ago with the ask held roughly flat each time — persistent listings suggest the price (not the market) is what's stuck; bring a comps-based counter.
- Current owner paid $75k; list at $230k implies a 207% gain — meaningful room to come down on a strong offer.
Risks & watch-outs
- Watch-outs: flood insurance adds $427/mo.
- Climate carrying-cost: in FEMA flood zone AE (mandatory federal flood insurance); severe wind risk, 99% chance of damaging wind over 30y; extreme-heat days projected 7→29/yr by 2055 (HVAC capex compounding) — expect insurance premiums to compound above CPI over the hold.
Questions for the listing agent
- What do current leases actually rent for vs. the listed asking? Can we see a recent rent roll and the last 12 months of T-12 income?
- It's been on market 440 days. Have you received any prior offers? Is the seller open to a 12% concession, seller financing, or rate buy-down credit?
- Built in 1975 — when were the roof, HVAC, electrical panel, plumbing, and water heater last replaced?
- What's the actual annual flood-insurance premium (NFIP or private), and is the property in a SFHA with mandatory coverage?
- What does the HOA fee cover, when was the last increase, and are there any pending special assessments or reserve-fund shortfalls?
- Why hasn't it sold? Are there any deal-killer items the seller is aware of (foundation, flood, title, zoning, code violations)?
- Is there a deadline driving the sale (1031 exchange, divorce, estate, relocation)? That informs how much negotiation room exists.
- Schools are B-rated — typically a magnet for longer-tenancy family renters. What's the average tenant stay here, and is there a school-zone premium baked into asking?
- What's the average days-on-market for RENTAL listings here right now (not sales)? A rising rental-DOM trend means longer vacancies and softer asking-rent achievability than the comps imply.
- What's the recent tenant-quality profile in this submarket — average credit score on applications, eviction rate, late-payment / NSF rate, and stable-employment percentage? A property-management company in the area should have these aggregated.
- How much new for-sale + rental construction is in the pipeline within 1–3 miles? Heavy new supply typically softens prices + rents 12–24 months out; constrained supply supports both.
Investment metrics
- 1% rule
- 1.03% ✓
- Cap rate
- 8.38%
- Cash-on-cash
- 7.44%
- DSCR
- 1.33
- GRM
- 8.1
CMA / ARV
- ARV (on-the-fly)
- $272,630
- Comps found
- 12
Show comp detail 12 sales within ~0.75 mi
| Address | Dist | Beds/Ba | Sqft | Sold | Price | $/sf | Match |
|---|---|---|---|---|---|---|---|
| 13489 Darnell Ave | 0.12mi | 3/2.0 | 1,245 (-9%) | 4mo | $195,000 | $157 | 76 |
| 13300 Darnell Ave | 0.47mi | 3/2.0 | 1,372 (+0%) | 4mo | $274,900 | $200 | 75 |
| 6178 Coliseum Blvd | 0.47mi | 3/2.0 | 1,360 (-1%) | 4mo | $315,000 | $232 | 74 |
| 6570 Coliseum Blvd | 0.58mi | 3/2.0 | 1,328 (-3%) | 4mo | $228,900 | $172 | 64 |
| 6393 Drucker Cir | 0.62mi | 2/2.0 (-1) | 1,303 (-5%) | 1mo | $360,000 | $276 | 57 |
| 6375 Coniston St | 0.63mi | 2/2.0 (-1) | 1,276 (-7%) | 3mo | $254,000 | $199 | 52 |
| 5397 Ulysses St | 0.41mi | 3/2.0 | 1,564 (+14%) | 7mo | $260,000 | $166 | 52 |
| 5375 Joslyn Ter | 0.72mi | 3/2.0 | 1,234 (-10%) | 6mo | $275,000 | $223 | 45 |
| 5415 Joslyn Ter | 0.72mi | 3/2.0 | 1,224 (-11%) | 4mo | $280,000 | $229 | 45 |
| 6596 Thorman Rd | 0.68mi | 3/2.0 | 1,494 (+9%) | 10mo | $239,900 | $161 | 45 |
| 13400 Englewood Rd | 0.71mi | 3/2.0 | 1,518 (+11%) | 7mo | $250,000 | $165 | 43 |
| 13238 Fowler Ave | 0.69mi | 3/2.0 | 1,203 (-12%) | 8mo | $225,000 | $187 | 41 |
Match score weights: distance 35% · size 25% · config 20% · recency 20%. Top-matched comps best support the ARV.
Projected returns pro-forma
-3.0% appreciation · 5.29% rent growth · sell at horizon
- IRR
- -14.0%
- Equity multiple
- 0.48×
- Total profit
- $-33,186
- Equity at exit
- $34,279
- IRR
- -1.3%
- Equity multiple
- 0.90×
- Total profit
- $-6,202
- Equity at exit
- $19,878
Cash invested: $64,372 (down + closing). Projections, not guarantees.
Landlord ↔ Tenant lean methodology
- Overall (STATE)
- 87 Strongly Landlord-Friendly
- State Florida
- 87 Strongly Landlord-Friendly · R+3
- County
- — inherits STATE
- City
- — inherits STATE
ZIP-level market 33981
- Home prices YoY
- -7.5%
- Rents YoY
- 5.3%
- Active inventory
- 2198
- Price-to-rent
- 8.1×
Monthly cashflow live
- Estimated rent
- $2,370 high interval (Pro) →
- Mortgage (P&I)
- −$1,206
- Tax from tax record
- −$133 /mo · $1,592/yr
- Insurance
- −$96
- Flood insurance flood zone
- −$427 /mo · $5,118/yr
- HOA
- −$39
- Vacancy / Maint / Mgmt
- −$498
- Net cashflow
- $-27
Break-even live
Sensitivity live
| Price | -10% $103 | -5% $38 | +0% $-27 | +5% $-92 | +10% $-158 |
|---|---|---|---|---|---|
| Rent | -10% $-215 | -5% $-121 | +0% $-27 | +5% $66 | +10% $160 |
| Rate | -1.0pp $88 | -0.5pp $31 | base $-27 | +0.5pp $-87 | +1.0pp $-148 |
UW: 25.0% down · 7.5% · 30yr · 1.5% tax · 5.0% vac · 8.0% maint · 8.0% mgmt
Financing live
Cash to close
- Down payment
- $57,475
- Closing costs
- $6,897
- Reserves months
- —
- Total cash needed
- —
Loan-product check · same deal, 3 products live
Conventional
25% down · 7.5% · 30yr
- Down + closing
- —
- Monthly P&I
- —
- Monthly cashflow
- —
- DSCR
- —
- Eligible?
- —
Personal DTI + credit; lowest rate.
DSCR
20% down · 8.5% · 30yr
- Down + closing
- —
- Monthly P&I
- —
- Monthly cashflow
- —
- DSCR
- —
- Eligible?
- —
No personal income docs; deal must DSCR.
Hard money
10% down · 12.0% · 12mo
- Down + closing
- —
- Monthly P&I
- —
- Monthly cashflow
- —
- DSCR
- —
- Eligible?
- —
Short-term bridge; refi at stabilization.
Rent comps 12 comps
| Address | Beds | Baths | Sqft | Rent | $/sqft | DOM | Units | Dist |
|---|---|---|---|---|---|---|---|---|
| 6248 Drucker Cir Port Charlotte, FL | 3.0 | 2.0 | 1414 | $1,810 | $1.28 | 15d | 1 | 0.46mi |
| 13349 Buckett Cir Port Charlotte, FL | 3.0 | 3.0 | 1560 | $2,795 | $1.79 | 22d | 1 | 0.47mi |
| 13280 Foresman Blvd Port Charlotte, FL | 3.0 | 2.0 | 1500 | $2,800 | $1.87 | 15d | 1 | 0.48mi |
| 6551 Coliseum Blvd Port Charlotte, FL | 3.0 | 2.0 | 1386 | $1,850 | $1.33 | 15d | 1 | 0.57mi |
| 6351 Coniston St Port Charlotte, FL | 3.0 | 2.0 | 1200 | $1,950 | $1.62 | 22d | 1 | 0.61mi |
| 13288 Fowler Ave Port Charlotte, FL | 3.0 | 2.0 | 1203 | $2,500 | $2.08 | 22d | 1 | 0.64mi |
| 13184 Eureka Cir Port Charlotte, FL | 3.0 | 2.0 | 1640 | $2,300 | $1.40 | 22d | 1 | 0.68mi |
| 5292 Early Ter Port Charlotte, FL | 2.0 | 2.0 | 1130 | $1,800 | $1.59 | 22d | 1 | 0.71mi |
| 6628 Thorman Rd Port Charlotte, FL | 3.0 | 2.0 | 1116 | $1,800 | $1.61 | 22d | 1 | 0.74mi |
| 5201 Forbes Ter Port Charlotte, FL | 4.0 | 2.0 | 1664 | $3,200 | $1.92 | 22d | 1 | 0.76mi |
| 5498 Montego Ln Port Charlotte, FL | 2.0 | 2.0 | 1070 | $1,695 | $1.58 | 22d | 1 | 0.94mi |
| 5496 Brussels Ter Port Charlotte, FL | 3.0 | 2.0 | 1400 | $3,900 | $2.79 | 22d | 1 | 1.34mi |
HOA detail
- Monthly dues
- $39 · $468/yr
- Likely covers
- pool
Listing history 11 events
-
2026-05-11status Pending
-
2026-03-03price $229,900
-
2025-02-25$239,900 Active
-
2012-05-16soldstatus $75,000
-
2012-05-15soldstatus $75,000 377-char remark
Show marketing remark (377 chars)
SUPER HOME, offers 3 bedrooms, 2 baths, 1 car garage. Clean and updated. this home shows pride in ownership. NOT a drive-by. You MUST come in and will be happily surprised. This home is ready for you now. This location offers you a great deal of enjoyment, such as 2 POOLS, Tennis Courts, shuffleboard, Rec Building. Close to beaches, fishing, boat ramps, schools and shopping.
-
2012-01-07$79,500 377-char remark
Show marketing remark (377 chars)
SUPER HOME, offers 3 bedrooms, 2 baths, 1 car garage. Clean and updated. this home shows pride in ownership. NOT a drive-by. You MUST come in and will be happily surprised. This home is ready for you now. This location offers you a great deal of enjoyment, such as 2 POOLS, Tennis Courts, shuffleboard, Rec Building. Close to beaches, fishing, boat ramps, schools and shopping.
-
2009-01-27$89,500
-
2007-02-16soldstatus $99,000
-
2007-02-06soldstatus $99,000
-
2006-11-16$99,000
-
2006-02-01$179,900
ⓘ Source: listings_history table (triggers on properties + properties_extension) + one-shot
backfill from property_details.listing_events for pre-trigger history.
Tax reassessment forecast FL · Resets to sale price
- Current annual tax
- $1,592 · $133/mo
- Projected year-2 tax
- $1,908 · $159/mo
- Expected delta
- +$316/yr (+$26/mo · 19.9%)
ⓘ Screening estimate from a state-policy table — verify with the county assessor before closing.
Climate risk First Street
- Flood 9/10 Extreme FEMA zone AE · 99% chance over 30 yrs
- Wildfire 2/10 Low
- Heat 10/10 Extreme 7 d/yr ≥106°F today · 29 d/yr by 30 yrs out
- Wind 10/10 Extreme 99% chance of damaging wind over 30 yrs
- Air quality 2/10 Low 1 unhealthy d/yr today · 1 by 30 yrs out
Nearby sold comps map
Loading sold comps map…
Walkable amenities ~0.75 mi
Loading nearby amenities…
Taxation est. · year 1
- Rental income
- $28,439
- − Mortgage interest
- −$12,878
- − Property taxes
- −$1,592
- − Insurance
- −$6,268
- − Repairs & maintenance
- −$2,275
- − Management
- −$2,275
- − HOA
- −$468
- − Depreciation
- −$6,688
- Taxable loss
- −$4,005
- Est. tax savings @ 24.0%
- +$961
- After-tax cash flow
- $633/yr
For passive investors: Depreciation is non-cash, so a rental often shows a tax loss while cash-flowing — sheltering income. Rental losses are passive: they offset passive income freely, and up to $25,000/yr can offset ordinary (W-2) income if you actively participate and your MAGI is under $100k (phasing out to $0 by $150k); unused losses carry forward. On sale, claimed depreciation is recaptured at up to 25%, and gains may owe capital-gains tax (a 1031 exchange can defer both). Figures are a year-1 estimate at your 24.0% rate — not tax advice; consult a CPA.
Schools (NCES district)
- District
- Charlotte
- NCES district ID
- 1200240
- Math proficiency
- 54% ▼ -6.00%
- Reading proficiency
- 54% ▼ -1.00%
- Median HH income
- $44,864
- Composite
- 45.62/100
- National rank
- #2586
- State rank
- #22 of 73 in FL
Livability — North Port
- Score
- 75/100
- State rank
- #252
- US rank
- #3975
Category grades
Schools grade is shown separately in the Schools card above.
Census & demographics
- County
- Charlotte County · 196,994 people
- City population
- 75,324
- Metro
- Punta Gorda, FL
- Population (ZIP)
- 15,622
- Household income
- $84,098
- Rent vs Own
- Severe rent burden
- 105.0
Population outlook (Charlotte County) Hauer SSP2
- Today (2025)
- 198,646 people
- By 2030
- 210,507 · +6.0%
- By 2040
- 230,857 · +16.2%
- By 2050
- 247,148 · +24.4%
- By 2075
- 281,777 · +41.8%
- By 2100
- 293,609 · +47.8%
Race, ethnicity, and origin ACS 2023
- Neighborhood character
- Predominantly White (89%)
- Race & ethnicity
- White 89% Two or more races 4% Hispanic / Latino 4% Black 2% Asian 1%
- Common ancestry
- Romanian 4% Lithuanian 3% Italian 2%
- Foreign-born
- 6% · Canada
- Languages at home
- 96% English-only · Spanish 1% German/W. Germanic 1% Tagalog/Filipino 1%
Political lean MEDSL · Charlotte
- 2024 margin
- Solid R (+34.0) · D 32.7% · R 66.7%
- 2008→2024 swing
- -26.7pp toward R · 2008: -7.2pp · 2024: -34.0pp
- All cycles
- 2024: R+34.0 2020: R+26.6 2016: R+27.8 2012: R+14.3 2008: R+7.2
Not yet ingested
- Civics
- —
Market trends
- HPI YoY
- ▼ -28.09%
- Current HPI
- 346.5247
- Rent YoY
- ▲ 5.29%
- Metro
- Punta Gorda, FL
- State GDP YoY
- ▲ 3.28%
- F500 in state
- 36
Industry mix (Fortune 500 HQ in FL)
| Industry | F500 HQs | Revenue |
|---|---|---|
| Industrial Technology | 2 | $29B |
|
||
| Insurance | 2 | $17B |
|
||
| Retail | 1 | $60B |
|
||
| Technology Distribution | 1 | $58B |
|
||
| Homebuilding | 1 | $35B |
|
||
| Technology Manufacturing | 1 | $35B |
|
||
Price history
+27.8% since first listed11 events — show timeline
- 2026-05-11 Pending — Stellar MLS as Distributed by MLS Grid
- 2026-03-03 Price Changed $229,900 Stellar MLS as Distributed by MLS Grid
- 2025-02-25 Listed $239,900 Stellar MLS as Distributed by MLS Grid
- 2012-05-16 Sold (Public Records) $75,000 Public Records
- 2012-05-15 Sold (MLS) $75,000 Stellar MLS as Distributed by MLS Grid
- 2012-01-07 Listed $79,500 Stellar MLS as Distributed by MLS Grid
- 2009-01-27 Listed $89,500 Stellar MLS as Distributed by MLS Grid
- 2007-02-16 Sold (Public Records) $99,000 Public Records
- 2007-02-06 Sold (MLS) $99,000 Stellar MLS as Distributed by MLS Grid
- 2006-11-16 Listed $99,000 Stellar MLS as Distributed by MLS Grid
- 2006-02-01 Listed $179,900 Stellar MLS as Distributed by MLS Grid
Property tax history
+2.6%/yrLatest (2025): $1,592 · +17.5% YoY. Source: county tax records.
Cash-flow waterfall
monthlySold comps — $/sqft
last 12 mo · ≤1 miLoading sold comps…