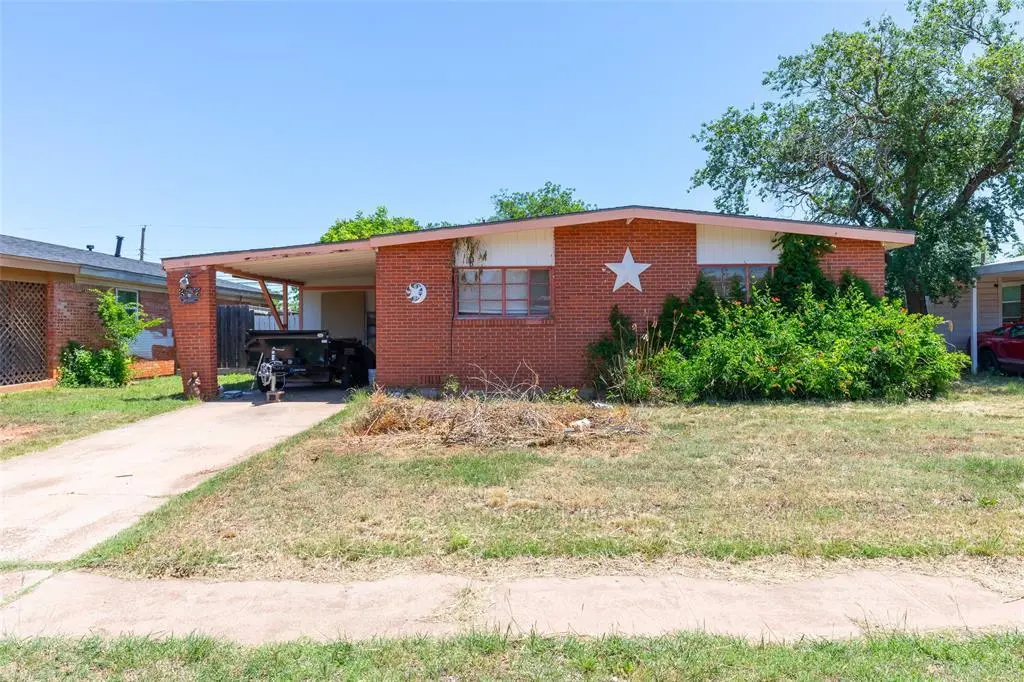
1757 Briarwood St · Abilene, TX
Flood risk 3/10 · Minor
- FEMA flood zone
- AE
- Chance of flooding over 30 yrs
- 0.16%
- Est. flood insurance / yr
- $1,737 – $8,500
Fire risk 7/10 · Major
- Est. fire insurance / yr
- $1,222 – $2,270
Heat risk 7/10 · Major
- Hot days now (above 104°F)
- 7 days/yr
- Hot days in 30 yrs
- 23 days/yr
Wind risk 4/10 · Minor
- Chance of severe wind over 30 yrs
- 11.0%
Air-quality risk 1/10 · Minimal
- Unhealthy air days now
- 0 days/yr
- Unhealthy air days in 30 yrs
- 0 days/yr
Risk factors via First Street. Map © Google.
Why this score? — see what drove the B+ grade
The composite is a weighted blend of 9 inputs, each scored 0–100. Each bar is that input's sub-score; the figure is the points it added to the 100-point composite (weight × sub-score).
- Cash flow +30.0/30.0
- ARV discount +15.0/15.0
- 1% rule +10.0/10.0
- DSCR +10.0/10.0
- Rent growth +5.0/5.0
- Livability +3.8/5.0
- Schools +2.8/10.0
- Condition / age +2.5/5.0
- Appreciation +0.0/10.0
$70,000
🖨 Deal sheet 📄 Offer letter ✓ Due diligence
Listing remarks MLS
Perfect Starter Home or Great Investment Property. 3 bedrooms, 1 bath, Open Family concept. There are hardwood floors under carpet in bedrooms owner thinks there is hardwood throughout the house. Fenced in backyard. AC unit installed approx. 1 year ago.
Key facts
- 7,144 sq ft lot
- Parking
- Built 1956
Property features AI
Finance
- Other: Flood plain note — verify flood insurance and rollback tax/exemptions
- Financial info: Listing for sale; No second mortgage recorded
- HOA & community: No homeowners association
Exterior
- Parking: 1 covered parking space; 1 carport space; Driveway parking
- Security: Audio and video recording permitted on premises
- Utilities: City water; City sewer; Not in a municipal utility district
- Home design: Single-family residence; One story; Built in 1956; Property faces unspecified direction
- Construction: Composition roof; Original construction 1956
- Exterior features: Yard on a lot smaller than 0.5 acre; Subdivision: Westwood Add
Interior
- Kitchen: No appliances included
- Bedrooms: 3 bedrooms (primary bedroom on main level)
- Bathrooms: 1 full bathroom
- Interior features: Open floorplan; One living area; Two total rooms
- Laundry & utility: No laundry appliances listed
Neighborhood map
What this means for you Summary
Snapshot
- This is a 3-bed/1.0-bath single-family listed at $70k.
Deal economics
- At list price, monthly cash flow is $607 ($7k/yr) — positive.
- The deal already cash-flows at list — no discount required.
- Meets the 1% rule at list price ($2k rent vs $70k).
- Cap rate 24.0% vs local median 6.7% in Abilene — top-decile yield for the area; either an underpriced asset or a hidden risk that comps aren't pricing in. Stress-test before assuming the spread holds.
Location & tenants
- Location reads 75/100 on livability (#142 in TX, #4,037 nationally) — a middle-class / working-renter tenant base. Strengths: cost of living A+, housing A+, health & safety A+; Watch: crime D, commute F.
- Abilene ISD (urban): math 32% / reading 34% proficiency, ranked #575 of 826 in TX (top 70%) — families likely to look elsewhere, expect single-tenant / working-renter base with shorter leases.
- Zoned schools: Purcell El (math 30% / reading 22%, grade F, #2,954 of 4,322 statewide, top 69%, 635 students, 84% FRL) — zoned schools average 84% FRL vs 57% district-wide (27 pts higher); higher-poverty schools than district average — tighter screening recommended.
- Market conditions: Rents rising fast (+40.2%/yr); 86 active listings in the ZIP; 9 comparable units currently listed for rent nearby; rentals leasing fast (median 13d on market — plan ~1-2 weeks tenant-placement turnaround); 508 units permitted in Taylor County in 2024 (0 in 5+ unit buildings).
- This rent runs 44% of the median local income ($54k/yr) — at the standard rent-burdened threshold; future hikes will face affordability resistance.
Forward outlook
- Local home prices are declining (-3.0%/yr); year-one equity from $484 of loan paydown is wiped out by about $2k of value loss. Plan a longer hold.
- Taylor County population projected at +16% by 2050 — long-run rental-demand tailwind backs the buy-and-hold thesis.
- At projected returns (-3.0% appreciation + 8.0% rent growth), your $20k cash investment doubles in ~3 years — after that, you're playing with house money.
Negotiation context
- Only 3 days on market — expect competitive offers; lowballing is unlikely to land.
- 3 sale attempts since 16y ago with the ask held roughly flat each time — persistent listings suggest the price (not the market) is what's stuck; bring a comps-based counter.
Risks & watch-outs
- Watch-outs: flood insurance adds $427/mo; built in 1956 — expect roof / HVAC / electrical / plumbing capex.
- Climate carrying-cost: in FEMA flood zone AE (mandatory federal flood insurance); major wildfire risk; extreme-heat days projected 7→23/yr by 2055 (HVAC capex compounding) — expect insurance premiums to compound above CPI over the hold.
Questions for the listing agent
- Built in 1956 — when were the roof, HVAC, electrical panel, plumbing, and water heater last replaced?
- What's the actual annual flood-insurance premium (NFIP or private), and is the property in a SFHA with mandatory coverage?
- Is there a deadline driving the sale (1031 exchange, divorce, estate, relocation)? That informs how much negotiation room exists.
- Schools are D-rated, which usually means shorter tenancies and higher turnover. Who's the typical renter profile here, and what's been the actual vacancy rate?
- Crime grade is D in this area — have there been break-ins, vandalism, or insurance claims at this property in the last 3 years? What carrier currently insures it and at what premium?
- What's the average days-on-market for RENTAL listings here right now (not sales)? A rising rental-DOM trend means longer vacancies and softer asking-rent achievability than the comps imply.
- What's the recent tenant-quality profile in this submarket — average credit score on applications, eviction rate, late-payment / NSF rate, and stable-employment percentage? A property-management company in the area should have these aggregated.
- How much new for-sale + rental construction is in the pipeline within 1–3 miles? Heavy new supply typically softens prices + rents 12–24 months out; constrained supply supports both.
Investment metrics
- 1% rule
- 2.83% ✓
- Cap rate
- 24.01%
- Cash-on-cash
- 63.27%
- DSCR
- 3.82
- GRM
- 2.9
CMA / ARV
- ARV (median comp)
- $130,355
- List price
- $70,000
- Delta
- -46.30%
- Verdict
- UNDERPRICED
- Comps
- 20 within 1.0 mi
Show comp detail 12 sales within ~0.75 mi
| Address | Dist | Beds/Ba | Sqft | Sold | Price | $/sf | Match |
|---|---|---|---|---|---|---|---|
| 1757 Briarwood St | 0.00mi | 3/1.0 | 1,184 (0%) | 0mo | $70,000 | $59 | 100 |
| 1461 Glenhaven Dr | 0.27mi | 3/1.5 | 1,210 (+2%) | 2mo | $129,900 | $107 | 80 |
| 1910 Burger St | 0.23mi | 3/3.0 | 1,188 (+0%) | 3mo | $187,000 | $157 | 78 |
| 1950 Burger St | 0.25mi | 3/2.0 | 1,266 (+7%) | 2mo | $140,000 | $111 | 71 |
| 1448 Glenhaven Dr | 0.30mi | 3/1.5 | 1,272 (+7%) | 1mo | $199,900 | $157 | 71 |
| 1950 Fannin St | 0.19mi | 2/1.0 (-1) | 1,048 (-12%) | 2mo | $157,500 | $150 | 65 |
| 1733 N Mockingbird Ln | 0.14mi | 3/2.0 | 1,006 (-15%) | 1mo | $181,500 | $180 | 64 |
| 2209 N Mockingbird Ln | 0.34mi | 3/1.0 | 1,351 (+14%) | 2mo | $185,000 | $137 | 58 |
| 2333 Bel Air Dr | 0.58mi | 3/1.0 | 1,354 (+14%) | 1mo | $185,000 | $137 | 48 |
| 1725 Graham St | 0.71mi | 3/1.0 | 1,050 (-11%) | 1mo | $169,900 | $162 | 48 |
| 1010 Fannin St | 0.64mi | 3/1.0 | 1,344 (+14%) | 0mo | $166,500 | $124 | 47 |
| 2563 Bel Air | 0.75mi | 3/2.0 | 1,292 (+9%) | 3mo | $203,000 | $157 | 43 |
Match score weights: distance 35% · size 25% · config 20% · recency 20%. Top-matched comps best support the ARV.
Projected returns pro-forma
-3.0% appreciation · 8.0% rent growth · sell at horizon
- IRR
- 41.1%
- Equity multiple
- 2.94×
- Total profit
- $38,116
- Equity at exit
- $10,437
- IRR
- 50.5%
- Equity multiple
- 7.73×
- Total profit
- $131,974
- Equity at exit
- $6,052
Cash invested: $19,600 (down + closing). Projections, not guarantees.
Landlord ↔ Tenant lean methodology
- Overall (STATE)
- 87 Strongly Landlord-Friendly
- State Texas
- 87 Strongly Landlord-Friendly · R+5
- County
- — inherits STATE
- City
- — inherits STATE
ZIP-level market 79603
- Home prices YoY
- -32.5%
- Rents YoY
- 40.2%
- Active inventory
- 86
- Price-to-rent
- 2.9×
Monthly cashflow live
- Estimated rent
- $1,983 high interval (Pro) →
- Mortgage (P&I)
- −$367
- Tax from tax record
- −$137 /mo · $1,642/yr
- Insurance
- −$29
- Flood insurance flood zone
- −$427 /mo · $5,118/yr
- HOA
- −$0
- Vacancy / Maint / Mgmt
- −$416
- Net cashflow
- $607
Break-even live
UW: 25.0% down · 7.5% · 30yr · 1.5% tax · 5.0% vac · 8.0% maint · 8.0% mgmt
Financing live
Cash to close
- Down payment
- $17,500
- Closing costs
- $2,100
- Reserves months
- —
- Total cash needed
- —
Loan-product check · same deal, 3 products live
Conventional
25% down · 7.5% · 30yr
- Down + closing
- —
- Monthly P&I
- —
- Monthly cashflow
- —
- DSCR
- —
- Eligible?
- —
Personal DTI + credit; lowest rate.
DSCR
20% down · 8.5% · 30yr
- Down + closing
- —
- Monthly P&I
- —
- Monthly cashflow
- —
- DSCR
- —
- Eligible?
- —
No personal income docs; deal must DSCR.
Hard money
10% down · 12.0% · 12mo
- Down + closing
- —
- Monthly P&I
- —
- Monthly cashflow
- —
- DSCR
- —
- Eligible?
- —
Short-term bridge; refi at stabilization.
Rent comps 9 comps
| Address | Beds | Baths | Sqft | Rent | $/sqft | DOM | Units | Dist |
|---|---|---|---|---|---|---|---|---|
| 1685 N Willis St Abilene, TX | 3.0 | 2.0 | 1349 | $1,800 | $1.33 | 20d | 1 | 0.22mi |
| 1481 Burger St Abilene, TX | 3.0 | 2.0 | 1330 | $2,400 | $1.80 | 20d | 1 | 0.34mi |
| 3296 Sandefer St Abilene, TX | 4.0 | 1.0 | 1360 | $1,950 | $1.43 | 13d | 1 | 0.40mi |
| 2410 N Willis St Abilene, TX | 2.0 | 1.0 | 864 | $1,200 | $1.39 | 43d | 1 | 0.66mi |
| 2498 Yorktown Dr Abilene, TX | 3.0 | 1.5 | 1104 | $1,795 | $1.63 | 13d | 1 | 0.78mi |
| 1638 Merchant St Abilene, TX | 3.0 | 2.0 | 1328 | $2,895 | $2.18 | 13d | 1 | 1.03mi |
| 2934 Old Anson Rd Unit 321 Abilene, TX | 3.0 | 2.0 | 1190 | $1,437 | $1.21 | 20d | 1 | 1.27mi |
| 2841 Old Anson Rd Abilene, TX | 2.0 | 1.0 | 932 | $2,000 | $2.15 | 13d | 1 | 1.36mi |
| 234 Clyde St Abilene, TX | 3.0 | 1.0 | 998 | $1,995 | $2.00 | 13d | 1 | 1.50mi |
Listing history 11 events
-
2026-05-18status Pending 34-char remark
-
2026-05-15$70,000 Active 34-char remark
-
2014-11-12soldstatus
-
2014-11-07soldstatus Sold 253-char remark
Show marketing remark (253 chars)
Perfect Starter Home or Great Investment Property. 3 bedrooms, 1 bath, Open Family concept. There are hardwood floors under carpet in bedrooms owner thinks there is hardwood throughout the house. Fenced in backyard. AC unit installed approx. 1 year ago.
-
2014-10-23status Pending 253-char remark
Show marketing remark (253 chars)
Perfect Starter Home or Great Investment Property. 3 bedrooms, 1 bath, Open Family concept. There are hardwood floors under carpet in bedrooms owner thinks there is hardwood throughout the house. Fenced in backyard. AC unit installed approx. 1 year ago.
-
2014-10-15$50,000 Active 253-char remark
Show marketing remark (253 chars)
Perfect Starter Home or Great Investment Property. 3 bedrooms, 1 bath, Open Family concept. There are hardwood floors under carpet in bedrooms owner thinks there is hardwood throughout the house. Fenced in backyard. AC unit installed approx. 1 year ago.
-
2011-06-13soldstatus
-
2011-06-03soldstatus
Show marketing remark (102 chars)
3BR 1 BA Brick home. Nice back yard. Ideal starter home. Neat & Clean, Great home for the price.
-
2011-04-04historical
Show marketing remark (102 chars)
3BR 1 BA Brick home. Nice back yard. Ideal starter home. Neat & Clean, Great home for the price.
-
2010-09-14$43,000
Show marketing remark (102 chars)
3BR 1 BA Brick home. Nice back yard. Ideal starter home. Neat & Clean, Great home for the price.
-
1993-04-06soldstatus
ⓘ Source: listings_history table (triggers on properties + properties_extension) + one-shot
backfill from property_details.listing_events for pre-trigger history.
Tax reassessment forecast TX · Resets to sale price
- Current annual tax
- $1,642 · $137/mo
- Projected year-2 tax
- $1,642 · $137/mo
- Expected delta
- $0/yr ($0/mo · 0.0%)
ⓘ Screening estimate from a state-policy table — verify with the county assessor before closing.
Climate risk First Street
- Flood 3/10 Moderate FEMA zone AE · 16% chance over 30 yrs
- Wildfire 7/10 Severe
- Heat 7/10 Severe 7 d/yr ≥104°F today · 23 d/yr by 30 yrs out
- Wind 4/10 Moderate 11% chance of damaging wind over 30 yrs
- Air quality 1/10 Low 0 unhealthy d/yr today · 0 by 30 yrs out
Nearby sold comps map
Loading sold comps map…
Walkable amenities ~0.75 mi
Loading nearby amenities…
Taxation est. · year 1
- Rental income
- $23,796
- − Mortgage interest
- −$3,921
- − Property taxes
- −$1,642
- − Insurance
- −$5,468
- − Repairs & maintenance
- −$1,904
- − Management
- −$1,904
- − Depreciation
- −$2,036
- Taxable income
- $6,921
- Est. tax owed @ 24.0%
- −$1,661
- After-tax cash flow
- $5,622/yr
For passive investors: Depreciation is non-cash, so a rental often shows a tax loss while cash-flowing — sheltering income. Rental losses are passive: they offset passive income freely, and up to $25,000/yr can offset ordinary (W-2) income if you actively participate and your MAGI is under $100k (phasing out to $0 by $150k); unused losses carry forward. On sale, claimed depreciation is recaptured at up to 25%, and gains may owe capital-gains tax (a 1031 exchange can defer both). Figures are a year-1 estimate at your 24.0% rate — not tax advice; consult a CPA.
Schools (NCES district)
- District
- Abilene ISD
- NCES district ID
- 4807440
- Math proficiency
- 32% ▼ -11.00%
- Reading proficiency
- 34% ▼ -5.00%
- Median HH income
- $39,782
- Composite
- 27.71/100
- National rank
- #6909
- State rank
- #575 of 826 in TX
Livability — Abilene
- Score
- 75/100
- State rank
- #142
- US rank
- #4037
Category grades
Schools grade is shown separately in the Schools card above.
Census & demographics
- Census place
- Abilene, TX
- County
- Taylor County · 136,672 people
- City population
- 136,672
- Metro
- Abilene, TX
- Population (ZIP)
- 23,548
- Household income
- $53,513
- Rent vs Own
- Severe rent burden
- 662.0
Population outlook (Taylor County) Hauer SSP2
- Today (2025)
- 145,270 people
- By 2030
- 150,050 · +3.3%
- By 2040
- 159,417 · +9.7%
- By 2050
- 168,883 · +16.3%
- By 2075
- 194,436 · +33.8%
- By 2100
- 203,163 · +39.9%
Race, ethnicity, and origin ACS 2023
- Neighborhood character
- Diverse neighborhood (Simpson 0.60)
- Race & ethnicity
- Hispanic / Latino 48% White 40% Two or more races 24% Black 8%
- Hispanic origin (detail)
- Mexican 44%
- Common ancestry
- Italian 2% Slovak 2% Portuguese 1%
- Foreign-born
- 9% · Canada
- Languages at home
- 73% English-only · Spanish 25%
Political lean MEDSL · Taylor
- 2024 margin
- Solid R (+49.8) · D 24.6% · R 74.4% · Other 1.0%
- 2008→2024 swing
- -4.2pp toward R · 2008: -45.6pp · 2024: -49.8pp
- All cycles
- 2024: R+49.8 2020: R+45.3 2016: R+51.1 2012: R+53.6 2008: R+45.6
Not yet ingested
- Civics
- —
Market trends
- HPI YoY
- ▼ -88.84%
- Current HPI
- 184.8875
- Rent YoY
- ▲ 40.19%
- Metro
- Abilene, TX
- State GDP YoY
- ▲ 3.95%
- F500 in state
- 110
Industry mix (Fortune 500 HQ in TX)
| Industry | F500 HQs | Revenue |
|---|---|---|
| Energy | 16 | $1,198B |
|
||
| Technology | 5 | $198B |
|
||
| Engineering / Construction | 4 | $72B |
|
||
| Energy Services | 3 | $60B |
|
||
| Utilities | 3 | $41B |
|
||
| Healthcare | 2 | $330B |
|
||
Price history
+62.8% since first listed13 events — show timeline
- 2026-06-05 Sold (MLS) — NTREIS
- 2026-05-27 Sold (Public Records) — Public Records
- 2026-05-18 Pending — NTREIS
- 2026-05-15 Listed $70,000 NTREIS
- 2014-11-12 Sold (Public Records) — Public Records
- 2014-11-07 Sold (MLS) — NTREIS
- 2014-10-23 Pending — NTREIS
- 2014-10-15 Listed $50,000 NTREIS
- 2011-06-13 Sold (Public Records) — Public Records
- 2011-06-03 Sold (MLS) — NTREIS
- 2011-04-04 Listing Removed — NTREIS
- 2010-09-14 Listed $43,000 NTREIS
- 1993-04-06 Sold (Public Records) — Public Records
Property tax history
+4.2%/yrLatest (2025): $1,642 · -0.3% YoY. Source: county tax records.
Cash-flow waterfall
monthlySold comps — $/sqft
last 12 mo · ≤1 miLoading sold comps…