 🏗️ New Construction
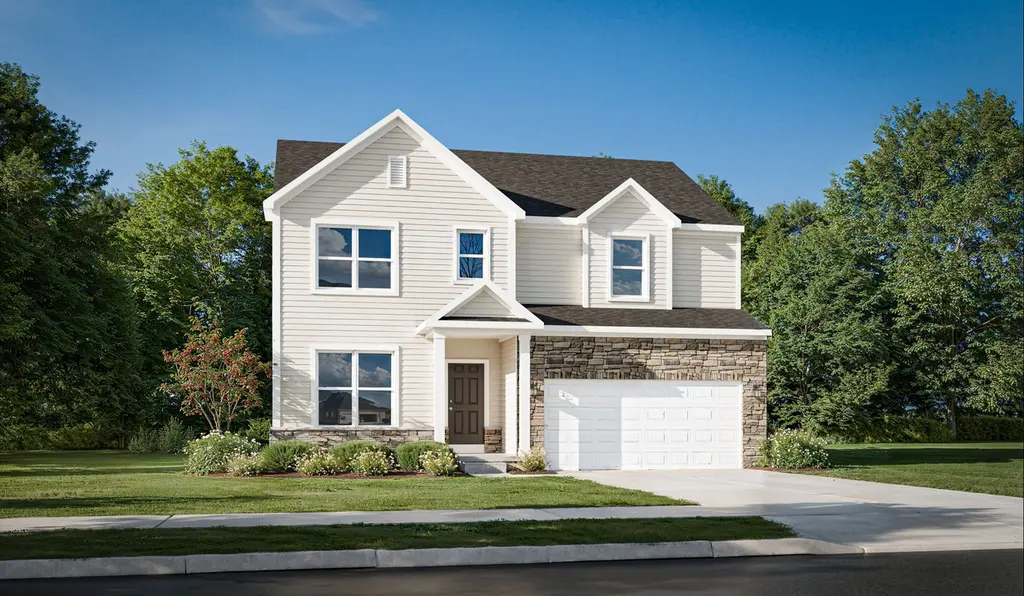
Manchester Plan · Commercial Point, OH
Flood risk 1/10 · Minimal
- FEMA flood zone
- X (unshaded)
- Chance of flooding over 30 yrs
- 0.0%
- Est. flood insurance / yr
- $507 – $1,088
Fire risk 1/10 · Minimal
- Est. fire insurance / yr
- $713 – $1,323
Heat risk 4/10 · Minor
- Hot days now (above 100°F)
- 7 days/yr
- Hot days in 30 yrs
- 18 days/yr
Wind risk 2/10 · Minimal
- Chance of severe wind over 30 yrs
- 1.0%
Air-quality risk 2/10 · Minimal
- Unhealthy air days now
- 1 days/yr
- Unhealthy air days in 30 yrs
- 2 days/yr
Risk factors via First Street. Map © Google.
Why this score? — see what drove the F grade
The composite is a weighted blend of 9 inputs, each scored 0–100. Each bar is that input's sub-score; the figure is the points it added to the 100-point composite (weight × sub-score).
- ARV discount +7.5/15.0
- Schools +5.8/10.0
- Appreciation +5.3/10.0
- Cash flow +4.1/30.0
- Livability +3.6/5.0
- Rent growth +2.5/5.0
- Condition / age +2.5/5.0
- 1% rule +0.2/10.0
- DSCR +0.0/10.0
$419,900
🖨 Deal sheet (PDF) 📄 Offer letter ✓ Due diligence
Listing remarks
The Manchester welcomes you home!. This 2-story, four bedroom home plan has great curb appeal. If spacious, open-concept living fits your lifestyle, the Manchester is the floor plan for you. The kitchen, dinette, and great room create a space that is great for entertaining. There's even an optional guest suite for those out of town guests or in laws. The second floor boasts a loft option that could easily be used as a family room or play room for the kids. Contact us today to learn more about this floor plan!
Key facts
- 2 garage spots
- Listed 27 days
Property features AI
Finance
- Financial info: List price $419,900
Exterior
- Parking: 2 total parking spaces; 2-car garage
- Home design: Single-family home (Manchester plan); Listed as a plan (new construction)
- Exterior features: Living area of 2,163
Interior
- Bedrooms: 4 bedrooms
- Bathrooms: 2 full bathrooms and 1 half bathroom (2.5 total)
- Interior features: Plan: Manchester (new construction plan)
Neighborhood map
What this means for you Summary
Snapshot
- This is a 4-bed/2.5-bath single-family listed at $420k.
Deal economics
- At list price, monthly cash flow is $-1k ($-17k/yr) — negative.
- To cash-flow at today's rent, offer at most $303k (27.9% below list).
- To meet the 1% rule (rent ≥ 1% of price), the offer needs to be $265k (36.9% below list).
- Recommended offer: $265k (36.9% below list) — sets the bar for 1% rule.
Location & tenants
- Location reads 72/100 on livability (#388 in OH) — a middle-class / working-renter tenant base. Strengths: crime A+, employment A+, cost of living A+; Watch: amenities F, commute F, health & safety F.
- Teays Valley Local (town): math 66% / reading 68% proficiency, ranked #166 of 656 in OH (top 25%) — acceptable for families but not a draw, mixed tenant base, ~2y average lease.
- Zoned schools: Scioto Elementary School (math 71% / reading 71%, grade A-, #371 of 1,584 statewide, top 24%, 640 students, 21% FRL); Teays Valley West Middle School (math 67% / reading 64%, grade A-, #186 of 654 statewide, top 29%, 534 students, 18% FRL); Teays Valley High School (math 50% / reading 70%, grade C+, #239 of 781 statewide, top 31%, 1,196 students, 22% FRL).
- Market conditions: 82 active listings in the ZIP; 1 comparable units currently listed for rent nearby; solid renter incomes; 312 units permitted in Pickaway County in 2024 (0 in 5+ unit buildings).
Forward outlook
- In year one you build about $7k of equity ($3k loan paydown + $3k appreciation (0.6% local appreciation)).
- Pickaway County population projected at +3% by 2050 — modest demand growth; plan on rents tracking national, not racing it.
- By year 5, paydown + projected appreciation supports a ~$33k cash-out refi (75% LTV) — recoverable capital for the next deal without selling this one.
Negotiation context
- It's been on market 27 days — a 2% lower offer ($414k) is reasonable based on typical stale-listing flexibility.
Questions for the listing agent
- What do current leases actually rent for vs. the listed asking? Can we see a recent rent roll and the last 12 months of T-12 income?
- Is there a deadline driving the sale (1031 exchange, divorce, estate, relocation)? That informs how much negotiation room exists.
- Schools are A-rated — typically a magnet for longer-tenancy family renters. What's the average tenant stay here, and is there a school-zone premium baked into asking?
- The area grade is low — what's the realistic commute time and amenity access for the typical tenant pool here? Any planned neighborhood developments (good or bad) we should know about?
- What's the average days-on-market for RENTAL listings here right now (not sales)? A rising rental-DOM trend means longer vacancies and softer asking-rent achievability than the comps imply.
- What's the recent tenant-quality profile in this submarket — average credit score on applications, eviction rate, late-payment / NSF rate, and stable-employment percentage? A property-management company in the area should have these aggregated.
- How much new for-sale + rental construction is in the pipeline within 1–3 miles? Heavy new supply typically softens prices + rents 12–24 months out; constrained supply supports both.
Investment metrics
- 1% rule
- 0.52% ✗
- Cap rate
- 2.97%
- Cash-on-cash
- -11.87%
- DSCR
- 0.47
- GRM
- 15.9
CMA / ARV
- ARV (median comp)
- $505,549
- List price
- $419,900
- Delta
- -15.12%
- Verdict
- UNDERPRICED
- Comps
- 20 within 1.0 mi
Show comp detail 12 sales within ~0.75 mi
| Address | Dist | Beds/Ba | Sqft | Sold | Price | $/sf | Match |
|---|---|---|---|---|---|---|---|
| 410 Cherry Hills Rd | 0.14mi | 4/2.5 | 2,324 (+7%) | 11mo | $459,900 | $198 | 72 |
| 426 Bethpage Blvd | 0.06mi | 3/2.5 (-1) | 1,915 (-12%) | 3mo | $419,900 | $219 | 71 |
| 438 Bethpage Blvd | 0.01mi | 3/2.0 (-1) | 1,840 (-15%) | 2mo | $446,000 | $242 | 66 |
| 46 Chambers Bay Rd | 0.38mi | 4/2.5 | 2,037 (-6%) | 13mo | $465,780 | $229 | 62 |
| 369 Cherry Hills Rd | 0.38mi | 4/2.5 | 2,315 (+7%) | 12mo | $480,830 | $208 | 60 |
| 358 Oakmont Dr | 0.54mi | 4/2.5 | 1,972 (-9%) | 0mo | $441,380 | $224 | 60 |
| 341 Merion Dr | 0.56mi | 4/2.5 | 2,336 (+8%) | 3mo | $496,330 | $212 | 58 |
| 33 Erin Hills Rd | 0.45mi | 4/2.5 | 2,440 (+13%) | 2mo | $469,900 | $193 | 56 |
| 338 Cherry Hills Rd | 0.59mi | 4/2.5 | 1,969 (-9%) | 3mo | $439,350 | $223 | 55 |
| 347 Canterbury Rd | 0.50mi | 4/2.5 | 2,336 (+8%) | 12mo | $469,820 | $201 | 54 |
| 403 Cherry Hills Rd | 0.46mi | 4/3.5 | 2,340 (+8%) | 13mo | $453,940 | $194 | 50 |
| 305 Olympic Loop | 0.71mi | 4/2.5 | 1,951 (-10%) | 3mo | $449,750 | $231 | 48 |
Match score weights: distance 35% · size 25% · config 20% · recency 20%. Top-matched comps best support the ARV.
Projected returns pro-forma
0.64% appreciation · 3.0% rent growth · sell at horizon
- IRR
- -12.8%
- Equity multiple
- 0.37×
- Total profit
- $-88,606
- Equity at exit
- $163,099
- IRR
- -6.5%
- Equity multiple
- 0.24×
- Total profit
- $-107,707
- Equity at exit
- $209,587
Cash invested: $141,554 (down + closing). Projections, not guarantees.
Landlord ↔ Tenant lean methodology
- Overall (STATE)
- 73 Landlord-Friendly
- State Ohio
- 73 Landlord-Friendly · R+6
- County
- — inherits STATE
- City
- — inherits STATE
ZIP-level market 43116
- Home prices YoY
- 0.2%
- Active inventory
- 82
- Price-to-rent
- 13.2×
Monthly cashflow live
- Estimated rent
- $2,650 medium interval (Pro) →
- Mortgage (P&I)
- −$2,651
- Tax est. 1.5%
- −$632 /mo · $7,583/yr
- Insurance
- −$211
- HOA
- −$0
- Vacancy / Maint / Mgmt
- −$556
- Net cashflow
- $-1,400
Break-even live
Sensitivity live
| Price | -10% $-1,051 | -5% $-1,226 | +0% $-1,400 | +5% $-1,575 | +10% $-1,750 |
|---|---|---|---|---|---|
| Rent | -10% $-1,610 | -5% $-1,505 | +0% $-1,400 | +5% $-1,296 | +10% $-1,191 |
| Rate | -1.0pp $-1,146 | -0.5pp $-1,272 | base $-1,400 | +0.5pp $-1,531 | +1.0pp $-1,665 |
UW: 25.0% down · 7.5% · 30yr · 1.5% tax · 5.0% vac · 8.0% maint · 8.0% mgmt
Financing live
Cash to close
- Down payment
- $126,387
- Closing costs
- $15,166
- Reserves months
- —
- Total cash needed
- —
Loan-product check · same deal, 3 products live
Conventional
25% down · 7.5% · 30yr
- Down + closing
- —
- Monthly P&I
- —
- Monthly cashflow
- —
- DSCR
- —
- Eligible?
- —
Personal DTI + credit; lowest rate.
DSCR
20% down · 8.5% · 30yr
- Down + closing
- —
- Monthly P&I
- —
- Monthly cashflow
- —
- DSCR
- —
- Eligible?
- —
No personal income docs; deal must DSCR.
Hard money
10% down · 12.0% · 12mo
- Down + closing
- —
- Monthly P&I
- —
- Monthly cashflow
- —
- DSCR
- —
- Eligible?
- —
Short-term bridge; refi at stabilization.
Rent comps 1 comps
| Address | Beds | Baths | Sqft | Rent | $/sqft | DOM | Units | Dist |
|---|---|---|---|---|---|---|---|---|
| 302 Riverside Dr Commercial Point, OH | 4.0 | 2.5 | 2850 | $2,650 | $0.93 | 5d | 1 | 1.34mi |
Listing history 13 events
-
2026-06-21days on market $419,900 Active 27 DOM
-
2026-06-18days on market $419,900 Active 24 DOM
-
2026-06-17days on market $419,900 Active 23 DOM
-
2026-06-16days on market $419,900 Active 22 DOM
-
2026-06-15days on market $419,900 Active 21 DOM
-
2026-06-13days on market $419,900 Active 19 DOM
-
2026-06-09days on market $419,900 Active 15 DOM
-
2026-06-08days on market $419,900 Active 14 DOM
-
2026-06-07days on market $419,900 Active 13 DOM
-
2026-06-03days on market $419,900 Active 9 DOM
-
2026-06-02days on market $419,900 Active 8 DOM
-
2026-06-01days on market $419,900 Active 7 DOM
-
2026-05-31days on market $419,900 Active 6 DOM
ⓘ Source: listings_history table (triggers on properties + properties_extension) + one-shot
backfill from property_details.listing_events for pre-trigger history.
Climate risk First Street
- Flood 1/10 Low FEMA zone X (unshaded) · 0% chance over 30 yrs
- Wildfire 1/10 Low
- Heat 4/10 Moderate 7 d/yr ≥100°F today · 18 d/yr by 30 yrs out
- Wind 2/10 Low 100% chance of damaging wind over 30 yrs
- Air quality 2/10 Low 1 unhealthy d/yr today · 2 by 30 yrs out
Nearby sold comps map
Loading sold comps map…
Walkable amenities ~0.75 mi
Loading nearby amenities…
Taxation est. · year 1
- Rental income
- $31,800
- − Mortgage interest
- −$28,319
- − Property taxes
- −$7,583
- − Insurance
- −$2,528
- − Repairs & maintenance
- −$2,544
- − Management
- −$2,544
- − Depreciation
- −$14,707
- Taxable loss
- −$26,424
- Est. tax savings @ 24.0%
- +$6,342
- After-tax cash flow
- $-10,461/yr
For passive investors: Depreciation is non-cash, so a rental often shows a tax loss while cash-flowing — sheltering income. Rental losses are passive: they offset passive income freely, and up to $25,000/yr can offset ordinary (W-2) income if you actively participate and your MAGI is under $100k (phasing out to $0 by $150k); unused losses carry forward. On sale, claimed depreciation is recaptured at up to 25%, and gains may owe capital-gains tax (a 1031 exchange can defer both). Figures are a year-1 estimate at your 24.0% rate — not tax advice; consult a CPA.
Schools (NCES district)
- District
- Teays Valley Local
- NCES district ID
- 3904909
- Math proficiency
- 66% ▼ -12.00%
- Reading proficiency
- 68% ▼ -10.00%
- Median HH income
- $64,637
- Composite
- 58.28/100
- National rank
- #1019
- State rank
- #166 of 656 in OH
Livability — Commercial Point
- Score
- 72/100
- State rank
- #388
- US rank
- #6304
Category grades
Schools grade is shown separately in the Schools card above.
Census & demographics
- Census place
- Commercial Point, OH
- County
- Pickaway · 57,589 people
- City population
- 2,764
- Metro
- Columbus, OH
- Population (ZIP)
- 2,764
- Household income
- $108,889
- Rent vs Own
Population outlook (Pickaway County) Hauer SSP2
- Today (2025)
- 59,488 people
- By 2030
- 60,400 · +1.5%
- By 2040
- 61,498 · +3.4%
- By 2050
- 61,478 · +3.3%
- By 2075
- 59,696 · +0.3%
- By 2100
- 51,458 · -13.5%
Race, ethnicity, and origin ACS 2023
- Neighborhood character
- Predominantly White (89%)
- Race & ethnicity
- White 89% Two or more races 5% Black 4% Hispanic / Latino 2%
- Common ancestry
- Slovak 3% Romanian 3% Italian 2%
- Foreign-born
- 1% · Canada
- Languages at home
- 98% English-only · Spanish 2%
Political lean MEDSL · Pickaway
- 2024 margin
- Solid R (+48.5) · D 25.3% · R 73.8%
- 2008→2024 swing
- -26.8pp toward R · 2008: -21.7pp · 2024: -48.5pp
- All cycles
- 2024: R+48.5 2020: R+47.0 2016: R+42.6 2012: R+18.7 2008: R+21.7
Not yet ingested
- Civics
- —
Market trends
- HPI YoY
- ▲ 0.64%
- Current HPI
- 260.1756
- Rent YoY
- —
- Metro
- —
- State GDP YoY
- ▲ 1.98%
- F500 in state
- 48
Industry mix (Fortune 500 HQ in OH)
| Industry | F500 HQs | Revenue |
|---|---|---|
| Insurance | 3 | $145B |
|
||
| Industrial Machinery | 3 | $49B |
|
||
| Financial Services | 3 | $24B |
|
||
| Consumer Goods | 2 | $93B |
|
||
| Aerospace / Defense | 2 | $47B |
|
||
| Utilities | 2 | $33B |
|
||
Cash-flow waterfall
monthlySold comps — $/sqft
last 12 mo · ≤1 miLoading sold comps…