 🏷️ Likely Rental
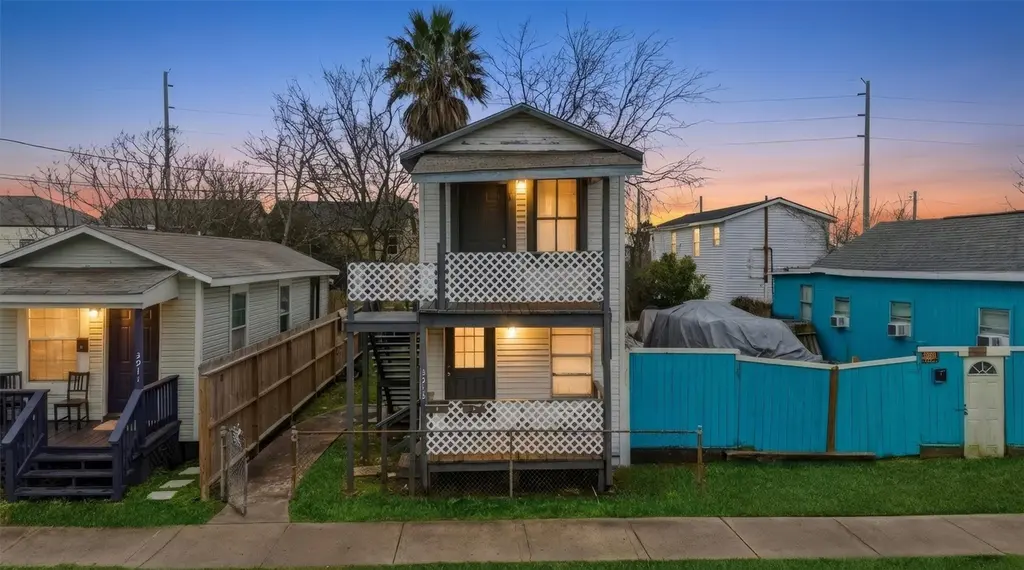
3913 Winnie St · Galveston, TX
Flood risk 10/10 · Severe
- FEMA flood zone
- AE
- Chance of flooding over 30 yrs
- 0.99%
- Est. flood insurance / yr
- $1,737 – $8,500
Fire risk 1/10 · Minimal
- Est. fire insurance / yr
- $1,222 – $2,270
Heat risk 10/10 · Severe
- Hot days now (above 107°F)
- 7 days/yr
- Hot days in 30 yrs
- 27 days/yr
Wind risk 10/10 · Severe
- Chance of severe wind over 30 yrs
- 99.0%
Air-quality risk 2/10 · Minimal
- Unhealthy air days now
- 1 days/yr
- Unhealthy air days in 30 yrs
- 2 days/yr
Risk factors via First Street. Map © Google.
Why this score? — see what drove the B grade
The composite is a weighted blend of 9 inputs, each scored 0–100. Each bar is that input's sub-score; the figure is the points it added to the 100-point composite (weight × sub-score).
- Cash flow +28.0/30.0
- ARV discount +15.0/15.0
- DSCR +10.0/10.0
- 1% rule +7.7/10.0
- Livability +3.8/5.0
- Schools +3.0/10.0
- Condition / age +2.5/5.0
- Rent growth +2.2/5.0
- Appreciation +0.0/10.0
$165,000
🖨 Deal sheet 📄 Offer letter ✓ Due diligence
Multi-family units
County records classify this as Multi-Family (2-4 Unit). Listing-text estimate: 2 units. confirmed
Listing remarks MLS
Duplex - Each unit offers 1 bedroom and 1 bathroom. Investment opportunity or owner-occupant option with rental income potential. Currently tenant occupied.
Key facts
- 1,260 sq ft lot
- Built 1950
- Listed 107 days
Neighborhood map
What this means for you Summary
Snapshot
- This is a 2 × 1-bed/1.0-bath units multifamily listed at $165k.
Deal economics
- At list price, monthly cash flow is $89 ($1k/yr) — positive. Per door: $45/mo.
- The deal already cash-flows at list — no discount required.
- Meets the 1% rule at list price ($2k rent vs $165k).
- Recommended offer: $150k (9.0% below list) — sets the bar for market timing.
- Cap rate 10.0% vs local median 0.1% in Galveston — top-decile yield for the area; either an underpriced asset or a hidden risk that comps aren't pricing in. Stress-test before assuming the spread holds.
Location & tenants
- Location reads 76/100 on livability (#108 in TX, #3,559 nationally) — a middle-class / working-renter tenant base. Strengths: commute A+, cost of living A+, housing A+; Watch: amenities D+, employment D, crime F.
- Galveston ISD (town): math 33% / reading 39% proficiency, ranked #514 of 826 in TX (top 62%) — families likely to look elsewhere, expect single-tenant / working-renter base with shorter leases; 68% free/reduced lunch — lower-income household profile, screen leases tightly.
- Market conditions: Rents soft (-1.1%/yr); 622 active listings in the ZIP; 38 comparable units currently listed for rent nearby; rentals lingering (median 44d on market — plan ~5-8 weeks vacancy on turnover, expect pricing pressure); 58% of comp listings sitting > 30 days — soft ceiling on asking rent; 3,258 units permitted in Galveston County in 2024 (0 in 5+ unit buildings).
- At $2,090/mo this rent would consume 56% of the median local household income ($45k/yr) (locally 2193% of renters already pay >50% of income on rent) — very limited rent-growth headroom before tenants either downsize or default.
Forward outlook
- Local home prices are declining (-3.0%/yr); year-one equity from $1k of loan paydown is wiped out by about $5k of value loss. Plan a longer hold.
- Galveston County population projected at +43% by 2050 — long-run rental-demand tailwind backs the buy-and-hold thesis.
Negotiation context
- It's been on market 108 days — a 9% lower offer ($150k) is reasonable based on typical stale-listing flexibility.
- 9 sale attempts since 4y ago; this cycle's ask has dropped $15k (8%) from the opening price — seller is motivated, your offer sets the floor, not the list.
Risks & watch-outs
- Watch-outs: flood insurance adds $427/mo; built in 1950 — expect roof / HVAC / electrical / plumbing capex.
- Climate carrying-cost: in FEMA flood zone AE (mandatory federal flood insurance); severe wind risk, 99% chance of damaging wind over 30y; extreme-heat days projected 7→27/yr by 2055 (HVAC capex compounding) — expect insurance premiums to compound above CPI over the hold.
Questions for the listing agent
- It's been on market 108 days. Have you received any prior offers? Is the seller open to a 9% concession, seller financing, or rate buy-down credit?
- Can we see the unit-by-unit rent roll, current vacancy, and any below-market leases? What's the average tenancy length?
- What capital expenditures (roof, boiler, parking lot, exteriors) have been made in the last 5 years, and what's planned in the next 2?
- Built in 1950 — when were the roof, HVAC, electrical panel, plumbing, and water heater last replaced?
- What's the actual annual flood-insurance premium (NFIP or private), and is the property in a SFHA with mandatory coverage?
- Why hasn't it sold? Are there any deal-killer items the seller is aware of (foundation, flood, title, zoning, code violations)?
- Is there a deadline driving the sale (1031 exchange, divorce, estate, relocation)? That informs how much negotiation room exists.
- Crime grade is F in this area — have there been break-ins, vandalism, or insurance claims at this property in the last 3 years? What carrier currently insures it and at what premium?
- What's the average days-on-market for RENTAL listings here right now (not sales)? A rising rental-DOM trend means longer vacancies and softer asking-rent achievability than the comps imply.
- What's the recent tenant-quality profile in this submarket — average credit score on applications, eviction rate, late-payment / NSF rate, and stable-employment percentage? A property-management company in the area should have these aggregated.
- How much new apartment / multifamily construction is in the pipeline within 1–3 miles? Heavy new supply (>2% of stock underway) typically softens rents 12–24 months out; light construction supports rent growth.
Investment metrics
- 1% rule
- 1.27% ✓
- Cap rate
- 10.04%
- Cash-on-cash
- 13.39%
- DSCR
- 1.60
- GRM
- 6.6
CMA / ARV
- ARV (median comp)
- $234,287
- List price
- $165,000
- Delta
- -29.57%
- Verdict
- UNDERPRICED
- Comps
- 11 within 2.0 mi
Projected returns pro-forma
-3.0% appreciation · 0.0% rent growth · sell at horizon
- IRR
- -17.1%
- Equity multiple
- 0.42×
- Total profit
- $-26,896
- Equity at exit
- $24,602
- IRR
- -19.2%
- Equity multiple
- 0.16×
- Total profit
- $-38,602
- Equity at exit
- $14,266
Cash invested: $46,200 (down + closing). Projections, not guarantees.
Landlord ↔ Tenant lean methodology
- Overall (STATE)
- 87 Strongly Landlord-Friendly
- State Texas
- 87 Strongly Landlord-Friendly · R+5
- County
- — inherits STATE
- City
- — inherits STATE
ZIP-level market 77550
- Home prices YoY
- -32.9%
- Rents YoY
- -1.1%
- Active inventory
- 622
- Price-to-rent
- 13.2×
Monthly cashflow live
- Estimated rent
- $2,090 high interval (Pro) →
- Mortgage (P&I)
- −$865
- Tax from tax record
- −$201 /mo · $2,417/yr
- Insurance
- −$69
- Flood insurance flood zone
- −$427 /mo · $5,118/yr
- HOA
- −$0
- Vacancy / Maint / Mgmt
- −$439
- Net cashflow
- $89
Break-even live
2-unit breakdown (identical units grouped — click to expand)
| Units | Beds | Baths | Est. rent |
|---|---|---|---|
| 2× units | 1 | 1 | $2,090 |
| #1 | 1 | 1 | $1,045 |
| #2 | 1 | 1 | $1,045 |
| Total (2 units) | $2,090 | ||
UW: 25.0% down · 7.5% · 30yr · 1.5% tax · 5.0% vac · 8.0% maint · 8.0% mgmt
Financing live
Cash to close
- Down payment
- $41,250
- Closing costs
- $4,950
- Reserves months
- —
- Total cash needed
- —
Loan-product check · same deal, 3 products live
Conventional
25% down · 7.5% · 30yr
- Down + closing
- —
- Monthly P&I
- —
- Monthly cashflow
- —
- DSCR
- —
- Eligible?
- —
Personal DTI + credit; lowest rate.
DSCR
20% down · 8.5% · 30yr
- Down + closing
- —
- Monthly P&I
- —
- Monthly cashflow
- —
- DSCR
- —
- Eligible?
- —
No personal income docs; deal must DSCR.
Hard money
10% down · 12.0% · 12mo
- Down + closing
- —
- Monthly P&I
- —
- Monthly cashflow
- —
- DSCR
- —
- Eligible?
- —
Short-term bridge; refi at stabilization.
Rent comps 38 comps
| Address | Beds | Baths | Sqft | Rent | $/sqft | DOM | Units | Dist |
|---|---|---|---|---|---|---|---|---|
| 4217 Sealy St Galveston, TX | 2.0 | 1.0 | 900 | $850 | $0.94 | 43d | 1 | 0.27mi |
| 3523 Avenue L Unit L Galveston, TX | 3.0 | 2.0 | 1500 | $2,250 | $1.50 | 43d | 1 | 0.45mi |
| 3718 Avenue M 1/2 Unit Rear Up Galveston, TX | 3.0 | 1.0 | 936 | $1,275 | $1.36 | 43d | 1 | 0.47mi |
| 3409 Avenue L Unit Le Bleu Sirene Galveston, TX | 2.0 | 1.0 | 1006 | $1,600 | $1.59 | 43d | 1 | 0.52mi |
| 3501 Avenue M Galveston, TX | 3.0 | 1.0 | 950 | $1,240 | $1.31 | 43d | 1 | 0.53mi |
| 4406 Avenue N Galveston, TX | 2.0 | 2.0 | 1197 | $1,230 | $1.03 | 4d | 1 | 0.60mi |
| 4020 Avenue O 1/2 Galveston, TX | 3.0 | 1.0 | 916 | $1,350 | $1.47 | 1d | 1 | 0.71mi |
| 2921 Avenue H Unit H Galveston, TX | 2.0 | 2.0 | 925 | $1,263 | $1.37 | 43d | 1 | 0.72mi |
| 2915 Avenue H Galveston, TX | 2.0–3.0 | 1.5–3.0 | 1118 | $1,750 | $1.57 | 1d | 15 | 0.72mi |
| 2727 Avenue K Galveston, TX | 3.0 | 1.0 | 972 | $1,900 | $1.95 | 43d | 1 | 0.89mi |
| 2806 Avenue M 1/2 Galveston, TX | 2.0 | 1.0 | 792 | $830 | $1.05 | 43d | 1 | 0.93mi |
| 2806 Avenue M 1/2 #1 Galveston, TX | 2.0 | 1.0 | 792 | $830 | $1.05 | 24d | 1 | 0.93mi |
| 2711 Avenue K Unit 10 Galveston, TX | 3.0 | 1.0 | 950 | $1,295 | $1.36 | 20d | 1 | 0.93mi |
| 2711 Avenue K Unit 12 Galveston, TX | 3.0 | 1.0 | 950 | $1,325 | $1.39 | 43d | 1 | 0.93mi |
| 2711 Avenue K Unit 9 Galveston, TX | 3.0 | 1.0 | 950 | $1,650 | $1.74 | 20d | 1 | 0.93mi |
| 2711 Avenue K Unit 01 Galveston, TX | 3.0 | 1.0 | 800 | $1,195 | $1.49 | 43d | 1 | 0.93mi |
| 2627 Avenue K Galveston, TX | 2.0 | 1.0 | 700 | $1,200 | $1.71 | 43d | 1 | 0.96mi |
| 3602 Avenue Q 1/2 Galveston, TX | 2.0 | 1.0 | 1416 | $2,500 | $1.77 | 43d | 1 | 0.98mi |
| 2609 Avenue L Apt 8 Galveston, TX | 2.0 | 1.0 | 758 | $995 | $1.31 | 24d | 1 | 1.01mi |
| 4715 Avenue P 1/2 Unit 1/2 REAR Galveston, TX | 1.0 | 1.0 | 748 | $1,395 | $1.86 | 5d | 1 | 1.03mi |
| 1208 26th St Unit 1546007P Galveston, TX | 3.0 | 2.0 | 796 | $2,599 | $3.27 | 15d | 1 | 1.05mi |
| 1212 26th St Unit 1545867P Galveston, TX | 3.0 | 2.0 | 742 | $2,645 | $3.56 | 12d | 1 | 1.05mi |
| 2221 35th St Galveston, TX | 2.0 | 1.0 | 1080 | $1,300 | $1.20 | 15d | 1 | 1.06mi |
| 2221 35th St Unit UP Galveston, TX | 2.0 | 1.0 | 1080 | $1,300 | $1.20 | 18d | 1 | 1.06mi |
| 2223 35th St Galveston, TX | 2.0 | 1.0 | 860 | $1,500 | $1.74 | 43d | 1 | 1.06mi |
| 2814 Avenue O 1/2 Galveston, TX | 2.0 | 1.0 | 1105 | $1,400 | $1.27 | 43d | 1 | 1.06mi |
| 5006 Bernardo De Galvez Ave Unit RL14 Galveston, TX | 2.0 | 1.0 | 1080 | $1,350 | $1.25 | 43d | 1 | 1.09mi |
| 3010 Avenue Q Galveston, TX | 2.0 | 1.0 | 1045 | $1,400 | $1.34 | 43d | 1 | 1.10mi |
| 2001 29th St Galveston, TX | 2.0 | 1.0 | 1109 | $1,400 | $1.26 | 43d | 1 | 1.13mi |
| 5313 Perry Ave Galveston, TX | 2.0 | 2.0 | 1036 | $1,595 | $1.54 | 22d | 1 | 1.18mi |
| 4824 Avenue R Galveston, TX | 2.0 | 2.0 | 1250 | $1,300 | $1.04 | 43d | 1 | 1.21mi |
| 1914 27th St Galveston, TX | 2.0 | 1.5 | 840 | $1,795 | $2.14 | 12d | 1 | 1.23mi |
| 4818 Avenue R 1/2 Galveston, TX | 1.0–3.0 | 1.0–2.0 | 1264 | $1,462 | $1.16 | 1d | 2 | 1.25mi |
| 5501 Menard Ave Galveston, TX | 2.0 | 2.0 | 900 | $1,200 | $1.33 | 43d | 1 | 1.26mi |
| 1801 Rosenberg St Unit HOUSE Galveston, TX | 3.0 | 3.5 | 1288 | $2,700 | $2.10 | 43d | 1 | 1.27mi |
| 4420 Avenue T Galveston, TX | 3.0 | 2.0 | 1260 | $2,100 | $1.67 | 43d | 1 | 1.32mi |
| 5523 Avenue O 1/2 Galveston, TX | 2.0 | 1.0 | 900 | $1,010 | $1.12 | 44d | 1 | 1.38mi |
| 2216 Avenue O 1/2 Galveston, TX | 2.0 | 1.0 | 789 | $1,150 | $1.46 | 5d | 1 | 1.43mi |
Listing history 39 events
-
2026-06-18days on market $165,000 Active 108 DOM
-
2026-06-17days on market $165,000 Active 107 DOM
-
2026-06-16days on market $165,000 Active 106 DOM
-
2026-06-15days on market $165,000 Active 105 DOM
-
2026-06-13days on market $165,000 Active 103 DOM
-
2026-06-09days on market $165,000 Active 99 DOM
-
2026-06-08days on market $165,000 Active 98 DOM
-
2026-06-07days on market $165,000 Active 97 DOM
-
2026-06-04days on market $165,000 Active 94 DOM
-
2026-06-03days on market $165,000 Active 93 DOM
-
2026-06-02days on market $165,000 Active 92 DOM
-
2026-06-01days on market $165,000 Active 91 DOM
-
2026-05-31days on market $165,000 Active 90 DOM
-
2026-04-24price $165,000 156-char remark
Show marketing remark (156 chars)
Duplex - Each unit offers 1 bedroom and 1 bathroom. Investment opportunity or owner-occupant option with rental income potential. Currently tenant occupied.
-
2026-03-02$180,000 Active 156-char remark
Show marketing remark (156 chars)
Duplex - Each unit offers 1 bedroom and 1 bathroom. Investment opportunity or owner-occupant option with rental income potential. Currently tenant occupied.
-
2026-02-14historical $750
-
2025-12-19price $750
-
2025-10-23$800
-
2024-08-16historical $750
-
2024-07-19historical $750
-
2024-07-18$750
-
2024-05-05$750
-
2024-05-05historical $795
-
2024-05-04$795
-
2024-05-04historical $795
-
2024-03-02price $795
-
2023-12-13$875
-
2023-11-27historical
-
2023-10-03soldstatus
-
2023-10-03soldstatus
-
2023-09-11price $35,000
-
2023-08-08$40,000 Active
-
2023-06-24historical
-
2023-02-25price $40,000
-
2023-01-25$30,000 Active
-
2022-09-30historical
-
2022-08-26price $270,000
-
2022-08-04$285,000 Active
-
2021-08-17soldstatus
ⓘ Source: listings_history table (triggers on properties + properties_extension) + one-shot
backfill from property_details.listing_events for pre-trigger history.
Tax reassessment forecast TX · Resets to sale price
- Current annual tax
- $2,417 · $201/mo
- Projected year-2 tax
- $3,020 · $252/mo
- Expected delta
- +$602/yr (+$50/mo · 24.9%)
ⓘ Screening estimate from a state-policy table — verify with the county assessor before closing.
Climate risk First Street
- Flood 10/10 Extreme FEMA zone AE · 99% chance over 30 yrs
- Wildfire 1/10 Low
- Heat 10/10 Extreme 7 d/yr ≥107°F today · 27 d/yr by 30 yrs out
- Wind 10/10 Extreme 99% chance of damaging wind over 30 yrs
- Air quality 2/10 Low 1 unhealthy d/yr today · 2 by 30 yrs out
Nearby sold comps map
Loading sold comps map…
Walkable amenities ~0.75 mi
Loading nearby amenities…
Taxation est. · year 1
- Rental income
- $25,080
- − Mortgage interest
- −$9,243
- − Property taxes
- −$2,417
- − Insurance
- −$5,944
- − Repairs & maintenance
- −$2,006
- − Management
- −$2,006
- − Depreciation
- −$4,800
- Taxable loss
- −$1,336
- Est. tax savings @ 24.0%
- +$321
- After-tax cash flow
- $1,390/yr
For passive investors: Depreciation is non-cash, so a rental often shows a tax loss while cash-flowing — sheltering income. Rental losses are passive: they offset passive income freely, and up to $25,000/yr can offset ordinary (W-2) income if you actively participate and your MAGI is under $100k (phasing out to $0 by $150k); unused losses carry forward. On sale, claimed depreciation is recaptured at up to 25%, and gains may owe capital-gains tax (a 1031 exchange can defer both). Figures are a year-1 estimate at your 24.0% rate — not tax advice; consult a CPA.
Schools (NCES district)
- District
- Galveston ISD
- NCES district ID
- 4820280
- Math proficiency
- 33% ▼ -14.00%
- Reading proficiency
- 39% ▼ -4.00%
- Median HH income
- $40,162
- Composite
- 30.22/100
- National rank
- #6299
- State rank
- #514 of 826 in TX
Livability — Galveston
- Score
- 76/100
- State rank
- #108
- US rank
- #3559
Category grades
Schools grade is shown separately in the Schools card above.
Census & demographics
- Census place
- Galveston, TX
- County
- Galveston County · 357,330 people
- City population
- 55,599
- Metro
- Houston-The Woodlands-Sugar Land, TX
- Population (ZIP)
- 23,489
- Household income
- $45,047
- Rent vs Own
- Severe rent burden
- 2193.0
Population outlook (Galveston County) Hauer SSP2
- Today (2025)
- 390,640 people
- By 2030
- 425,226 · +8.9%
- By 2040
- 493,765 · +26.4%
- By 2050
- 559,698 · +43.3%
- By 2075
- 719,260 · +84.1%
- By 2100
- 819,628 · +109.8%
Race, ethnicity, and origin ACS 2023
- Neighborhood character
- Diverse neighborhood (Simpson 0.66)
- Race & ethnicity
- White 46% Hispanic / Latino 30% Two or more races 19% Black 19% Asian 3%
- Hispanic origin (detail)
- Mexican 21% Puerto Rican 1%
- Common ancestry
- Lithuanian 2% Italian 2% Romanian 1%
- Foreign-born
- 11% · Canada, Jamaica
- Languages at home
- 75% English-only · Spanish 18% Other Asian/Pacific 2% Russian/Polish/Slavic 1%
Political lean MEDSL · Galveston
- 2024 margin
- Strong R (+27.4) · D 35.7% · R 63.1% · Other 1.2%
- 2008→2024 swing
- -7.9pp toward R · 2008: -19.5pp · 2024: -27.4pp
- All cycles
- 2024: R+27.4 2020: R+22.6 2016: R+22.6 2012: R+26.9 2008: R+19.5
Not yet ingested
- Civics
- —
Market trends
- HPI YoY
- ▼ -158.96%
- Current HPI
- 324.2159
- Rent YoY
- ▼ -1.12%
- Metro
- Houston-The Woodlands-Sugar Land, TX
- State GDP YoY
- ▲ 3.95%
- F500 in state
- 110
Industry mix (Fortune 500 HQ in TX)
| Industry | F500 HQs | Revenue |
|---|---|---|
| Energy | 16 | $1,198B |
|
||
| Technology | 5 | $198B |
|
||
| Engineering / Construction | 4 | $72B |
|
||
| Energy Services | 3 | $60B |
|
||
| Utilities | 3 | $41B |
|
||
| Healthcare | 2 | $330B |
|
||
Price history
-42.1% since first listed26 events — show timeline
- 2026-04-24 Price Changed $165,000 HARMLS
- 2026-03-02 Listed $180,000 HARMLS
- 2026-02-14 Rental Removed $750 BUILDIUM
- 2025-12-19 Price Changed $750 BUILDIUM
- 2025-10-23 Listed for Rent $800 BUILDIUM
- 2024-08-16 Rental Removed $750 HARMLS
- 2024-07-19 Rental Removed $750 BUILDIUM
- 2024-07-18 Listed for Rent $750 BUILDIUM
- 2024-05-05 Listed for Rent $750 HARMLS
- 2024-05-05 Rental Removed $795 BUILDIUM
- 2024-05-04 Listed for Rent $795 BUILDIUM
- 2024-05-04 Rental Removed $795 HARMLS
- 2024-03-02 Price Changed $795 HARMLS
- 2023-12-13 Listed for Rent $875 HARMLS
- 2023-11-27 Listing Removed — HARMLS
- 2023-10-03 Sold (Public Records) — Public Records
- 2023-10-03 Sold (Public Records) — Public Records
- 2023-09-11 Price Changed $35,000 HARMLS
- 2023-08-08 Listed $40,000 HARMLS
- 2023-06-24 Listing Removed — HARMLS
- 2023-02-25 Price Changed $40,000 HARMLS
- 2023-01-25 Listed $30,000 HARMLS
- 2022-09-30 Listing Removed — HARMLS
- 2022-08-26 Price Changed $270,000 HARMLS
- 2022-08-04 Listed $285,000 HARMLS
- 2021-08-17 Sold (Public Records) — Public Records
Property tax history
+16.3%/yrLatest (2025): $2,417 · -3.1% YoY. Source: county tax records.
Cash-flow waterfall
monthlySold comps — $/sqft
last 12 mo · ≤1 miLoading sold comps…