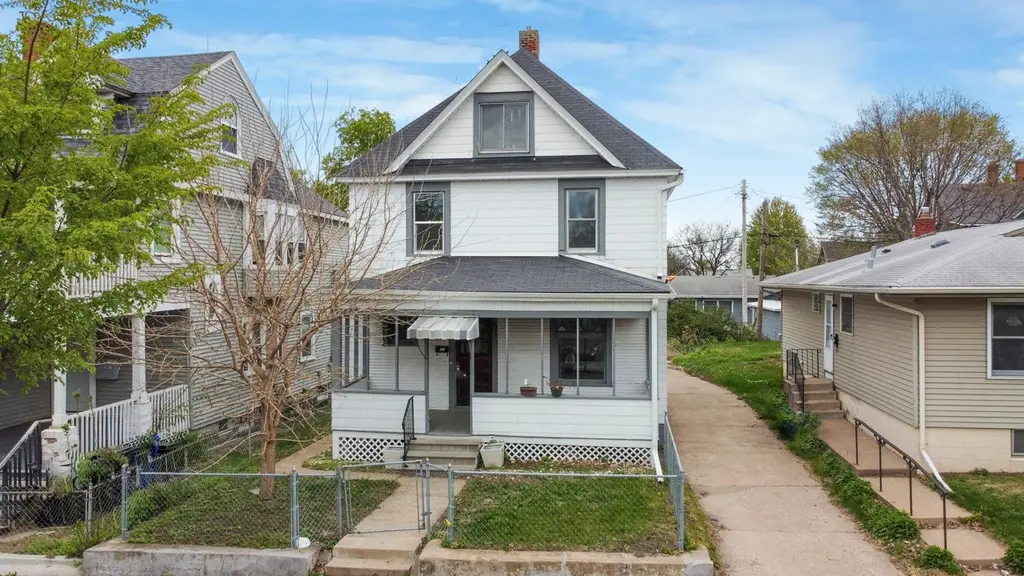
797 Iglehart Ave · St. Paul, MN
Flood risk 1/10 · Minimal
- FEMA flood zone
- X (unshaded)
- Chance of flooding over 30 yrs
- 0.0%
- Est. flood insurance / yr
- $473 – $860
Fire risk 1/10 · Minimal
- Est. fire insurance / yr
- $888 – $1,650
Heat risk 2/10 · Minimal
- Hot days now (above 99°F)
- 7 days/yr
- Hot days in 30 yrs
- 14 days/yr
Wind risk 2/10 · Minimal
- Chance of severe wind over 30 yrs
- —
Air-quality risk 2/10 · Minimal
- Unhealthy air days now
- 1 days/yr
- Unhealthy air days in 30 yrs
- 1 days/yr
Risk factors via First Street. Map © Google.
Why this score? — see what drove the C grade
The composite is a weighted blend of 9 inputs, each scored 0–100. Each bar is that input's sub-score; the figure is the points it added to the 100-point composite (weight × sub-score).
- Cash flow +25.4/30.0
- DSCR +8.4/10.0
- ARV discount +7.5/15.0
- 1% rule +7.3/10.0
- Rent growth +3.1/5.0
- Livability +2.5/5.0
- Condition / age +2.5/5.0
- Schools +2.4/10.0
- Appreciation +0.0/10.0
$274,950
🖨 Deal sheet 📄 Offer letter ✓ Due diligence
Key facts
- 5,270 sq ft lot
- Built 1905
- Listed 44 days
Property features AI
Exterior
- Parking: No designated parking
- Utilities: City water connected; City sewer connected; Natural gas; Electric service with circuit breakers
- Home design: Residential property; Two levels; Entry from main level
- Construction: Other construction materials; Asphalt roof; Foundation described as other with foundation dimensions approximately 29 x 24
- Exterior features: Deck and patio; Partial chain link fencing; Light tree coverage; Public transit within six blocks; City street with paved frontage and public maintenance
Interior
- Kitchen: Kitchen with range, refrigerator, and dishwasher
- Bedrooms: 3 bedrooms (two on the upper level, primary bedroom with full bath in upper level)
- Bathrooms: 1 full bathroom and 1 half bathroom; Full primary bath on upper level, additional full in basement
- Heating & cooling: Boiler heating; No central air
- Interior features: Dishwasher, Range, Refrigerator; Living/Dining room combination and separate formal dining room; Deck and patio access; Partially finished full basement
- Laundry & utility: Basement utilities (basement present)
Neighborhood map
What this means for you Summary
Snapshot
- This is a 3-bed/1.5-bath single-family listed at $275k.
Deal economics
- At list price, monthly cash flow is $634 ($8k/yr) — positive.
- The deal already cash-flows at list — no discount required.
- Meets the 1% rule at list price ($3k rent vs $275k).
- Recommended offer: $267k (3.0% below list) — sets the bar for market timing.
Location & tenants
- Location reads: area grade C — affects rentability + tenant quality, not the cash-flow math above.
- St. Paul Public School District (urban): math 21% / reading 33% proficiency, ranked #270 of 301 in MN (top 90%) — low school quality limits family demand, transient renter base, plan for 1-2y turnover; 64% free/reduced lunch — lower-income household profile, screen leases tightly.
- Market conditions: Rents rising (+2.5%/yr); 191 active listings in the ZIP; 2 comparable units currently listed for rent nearby; solid renter incomes; 1,202 units permitted in Ramsey County in 2024 (880 in 5+ unit buildings).
- At $3,383/mo this rent would consume 54% of the median local household income ($76k/yr) (locally 2116% of renters already pay >50% of income on rent) — very limited rent-growth headroom before tenants either downsize or default.
Forward outlook
- Local home prices are declining (-3.0%/yr); year-one equity from $2k of loan paydown is wiped out by about $8k of value loss. Plan a longer hold.
- Ramsey County population projected at +27% by 2050 — long-run rental-demand tailwind backs the buy-and-hold thesis.
Negotiation context
- It's been on market 44 days — a 3% lower offer ($267k) is reasonable based on typical stale-listing flexibility.
- 17 sale attempts since 4y ago; this cycle's ask has dropped $25k (8%) from the opening price — seller is motivated, your offer sets the floor, not the list.
- Current owner paid $164k; list at $275k implies a 68% gain — meaningful room to come down on a strong offer.
Risks & watch-outs
- Watch-outs: built in 1905 — expect roof / HVAC / electrical / plumbing capex.
Questions for the listing agent
- It's been on market 44 days. Have you received any prior offers? Is the seller open to a 3% concession, seller financing, or rate buy-down credit?
- Built in 1905 — when were the roof, HVAC, electrical panel, plumbing, and water heater last replaced?
- Is there a deadline driving the sale (1031 exchange, divorce, estate, relocation)? That informs how much negotiation room exists.
- What's the average days-on-market for RENTAL listings here right now (not sales)? A rising rental-DOM trend means longer vacancies and softer asking-rent achievability than the comps imply.
- What's the recent tenant-quality profile in this submarket — average credit score on applications, eviction rate, late-payment / NSF rate, and stable-employment percentage? A property-management company in the area should have these aggregated.
- How much new for-sale + rental construction is in the pipeline within 1–3 miles? Heavy new supply typically softens prices + rents 12–24 months out; constrained supply supports both.
Investment metrics
- 1% rule
- 1.23% ✓
- Cap rate
- 9.06%
- Cash-on-cash
- 9.88%
- DSCR
- 1.44
- GRM
- 6.8
CMA / ARV
No comps found within radius.
Projected returns pro-forma
-3.0% appreciation · 2.5% rent growth · sell at horizon
- IRR
- -2.0%
- Equity multiple
- 0.93×
- Total profit
- $-5,751
- Equity at exit
- $40,996
- IRR
- 7.2%
- Equity multiple
- 1.53×
- Total profit
- $40,636
- Equity at exit
- $23,773
Cash invested: $76,986 (down + closing). Projections, not guarantees.
Landlord ↔ Tenant lean methodology
- Overall (STATE)
- 46 Balanced
- State Minnesota
- 46 Balanced · D+2
- County
- — inherits STATE
- City
- — inherits STATE
ZIP-level market 55104
- Rents YoY
- 2.5%
- Active inventory
- 191
- Price-to-rent
- 6.8×
Monthly cashflow live
- Estimated rent
- $3,383 medium interval (Pro) →
- Mortgage (P&I)
- −$1,442
- Tax from tax record
- −$482 /mo · $5,786/yr
- Insurance
- −$115
- HOA
- −$0
- Vacancy / Maint / Mgmt
- −$710
- Net cashflow
- $634
Break-even live
UW: 25.0% down · 7.5% · 30yr · 1.5% tax · 5.0% vac · 8.0% maint · 8.0% mgmt
Financing live
Cash to close
- Down payment
- $68,738
- Closing costs
- $8,248
- Reserves months
- —
- Total cash needed
- —
Loan-product check · same deal, 3 products live
Conventional
25% down · 7.5% · 30yr
- Down + closing
- —
- Monthly P&I
- —
- Monthly cashflow
- —
- DSCR
- —
- Eligible?
- —
Personal DTI + credit; lowest rate.
DSCR
20% down · 8.5% · 30yr
- Down + closing
- —
- Monthly P&I
- —
- Monthly cashflow
- —
- DSCR
- —
- Eligible?
- —
No personal income docs; deal must DSCR.
Hard money
10% down · 12.0% · 12mo
- Down + closing
- —
- Monthly P&I
- —
- Monthly cashflow
- —
- DSCR
- —
- Eligible?
- —
Short-term bridge; refi at stabilization.
Rent comps 2 comps
| Address | Beds | Baths | Sqft | Rent | $/sqft | DOM | Units | Dist |
|---|---|---|---|---|---|---|---|---|
| 695 Grand Ave Saint Paul, MN | 1.0–2.0 | 1.0–2.0 | 1130 | $5,795 | $5.13 | 18d | 10 | 0.71mi |
| 255 Western Ave N Saint Paul, MN | 3.0 | 1.0–2.0 | 1049 | $3,700 | $3.53 | 2d | 23 | 0.85mi |
Listing history 50 events
-
2026-06-18days on market $274,950 Active 44 DOM
-
2026-06-17days on market $274,950 Active 43 DOM
-
2026-06-16days on market $274,950 Active 42 DOM
-
2026-06-15pricedays on market $274,950 Active 41 DOM
-
2026-06-13days on market $299,950 Active 39 DOM
-
2026-06-09days on market $299,950 Active 35 DOM
-
2026-06-08days on market $299,950 Active 34 DOM
-
2026-06-07days on market $299,950 Active 33 DOM
-
2026-06-04days on market $299,950 Active 30 DOM
-
2026-06-03days on market $299,950 Active 29 DOM
-
2026-06-02days on market $299,950 Active 28 DOM
-
2026-06-01days on market $299,950 Active 27 DOM
-
2026-05-31days on market $299,950 Active 26 DOM
-
2026-05-05$299,950 Active 1620-char remark
-
2026-04-01historical
-
2026-02-23price $264,950
-
2026-01-13price $274,950
-
2025-09-26$299,950 Active
-
2025-09-26historical
-
2025-09-11historical $3,325
-
2025-09-08$3,325
-
2025-09-08historical $3,325
-
2025-08-13price $3,325
-
2025-07-25$2,600
-
2025-07-25historical $2,600
-
2025-07-20$2,600
-
2025-07-20historical $2,600
-
2025-07-10price $2,600
-
2025-07-07status Active
-
2025-06-27price $2,200
-
2025-06-19$2,660
-
2024-04-24historical
-
2024-04-24$380,000
-
2024-04-12historical
-
2024-03-24historical $2,000
-
2024-03-14historical $2,000
-
2024-03-13price $2,000
-
2024-03-07price $329,900
-
2024-02-27price $319,900
-
2024-02-23price $1,900
-
2024-02-12$2,400
-
2024-02-08historical $2,400
-
2024-02-06price $2,400
-
2024-01-08$1,919
-
2023-12-18price $1,919
-
2023-11-27historical $2,000
-
2023-11-14price $2,000
-
2023-11-06price $2,260
-
2023-11-02$2,460
-
2023-10-25price $2,200
ⓘ Source: listings_history table (triggers on properties + properties_extension) + one-shot
backfill from property_details.listing_events for pre-trigger history.
Tax reassessment forecast MN · Partial reset (capped growth)
- Current annual tax
- $5,786 · $482/mo
- Projected year-2 tax
- $5,786 · $482/mo
- Expected delta
- $0/yr ($0/mo · 0.0%)
ⓘ Screening estimate from a state-policy table — verify with the county assessor before closing.
Climate risk First Street
- Flood 1/10 Low FEMA zone X (unshaded) · 0% chance over 30 yrs
- Wildfire 1/10 Low
- Heat 2/10 Low 7 d/yr ≥99°F today · 14 d/yr by 30 yrs out
- Wind 2/10 Low
- Air quality 2/10 Low 1 unhealthy d/yr today · 1 by 30 yrs out
Nearby sold comps map
Loading sold comps map…
Walkable amenities ~0.75 mi
Loading nearby amenities…
Taxation est. · year 1
- Rental income
- $40,592
- − Mortgage interest
- −$15,401
- − Property taxes
- −$5,786
- − Insurance
- −$1,375
- − Repairs & maintenance
- −$3,247
- − Management
- −$3,247
- − Depreciation
- −$7,999
- Taxable income
- $3,536
- Est. tax owed @ 24.0%
- −$849
- After-tax cash flow
- $6,756/yr
For passive investors: Depreciation is non-cash, so a rental often shows a tax loss while cash-flowing — sheltering income. Rental losses are passive: they offset passive income freely, and up to $25,000/yr can offset ordinary (W-2) income if you actively participate and your MAGI is under $100k (phasing out to $0 by $150k); unused losses carry forward. On sale, claimed depreciation is recaptured at up to 25%, and gains may owe capital-gains tax (a 1031 exchange can defer both). Figures are a year-1 estimate at your 24.0% rate — not tax advice; consult a CPA.
Schools (NCES district)
- District
- St. Paul Public School District
- NCES district ID
- 2733840
- Math proficiency
- 21% ▼ -11.00%
- Reading proficiency
- 33% ▼ -7.00%
- Median HH income
- $48,316
- Composite
- 23.51/100
- National rank
- #7868
- State rank
- #270 of 301 in MN
Livability — St. Paul
No livability data for this city. (Only ~50 U.S. cities are tracked.)
Census & demographics
- Census place
- St. Paul, MN
- County
- Ramsey County · 542,837 people
- City population
- 280,599
- Metro
- Minneapolis-St. Paul-Bloomington, MN-WI
- Population (ZIP)
- 45,762
- Household income
- $75,712
- Rent vs Own
- Severe rent burden
- 2116.0
Population outlook (Ramsey County) Hauer SSP2
- Today (2025)
- 603,431 people
- By 2030
- 636,459 · +5.5%
- By 2040
- 700,596 · +16.1%
- By 2050
- 765,819 · +26.9%
- By 2075
- 929,297 · +54.0%
- By 2100
- 1,053,924 · +74.7%
Race, ethnicity, and origin ACS 2023
- Neighborhood character
- Diverse neighborhood (Simpson 0.60)
- Race & ethnicity
- White 60% Black 19% Two or more races 10% Asian 7% Hispanic / Latino 7%
- Hispanic origin (detail)
- Mexican 4%
- Common ancestry
- Portuguese 8% Romanian 3% Lithuanian 3%
- Foreign-born
- 12% · Canada, Vietnam, China
- Languages at home
- 83% English-only · Spanish 4% Other Asian/Pacific 4% French/Haitian/Cajun 1%
Political lean MEDSL · Ramsey
- 2024 margin
- Solid D (+43.3) · D 70.5% · R 27.2% · Other 2.3%
- 2008→2024 swing
- +9.4pp toward D · 2008: 33.9pp · 2024: 43.3pp
- All cycles
- 2024: D+43.3 2020: D+45.4 2016: D+39.4 2012: D+35.3 2008: D+33.9
Not yet ingested
- Civics
- —
Market trends
- HPI YoY
- ▼ -532.26%
- Current HPI
- 245.6146
- Rent YoY
- ▲ 2.50%
- Metro
- Minneapolis-St. Paul-Bloomington, MN-WI
- State GDP YoY
- ▲ 2.41%
- F500 in state
- 34
Industry mix (Fortune 500 HQ in MN)
| Industry | F500 HQs | Revenue |
|---|---|---|
| Healthcare | 2 | $407B |
|
||
| Retail | 2 | $150B |
|
||
| Consumer Goods | 2 | $32B |
|
||
| Industrial Machinery | 2 | $6B |
|
||
| Agriculture | 1 | $40B |
|
||
| Healthcare / Medical Devices | 1 | $32B |
|
||
Price history
+37.5% since first listed53 events — show timeline
- 2026-06-14 Price Changed $274,950 NORTHSTARMLS as Distributed by MLS Grid
- 2026-05-05 Listed $299,950 NORTHSTARMLS as Distributed by MLS Grid
- 2026-04-01 Listing Removed — NORTHSTARMLS as Distributed by MLS Grid
- 2026-02-23 Price Changed $264,950 NORTHSTARMLS as Distributed by MLS Grid
- 2026-01-13 Price Changed $274,950 NORTHSTARMLS as Distributed by MLS Grid
- 2025-09-26 Listed $299,950 NORTHSTARMLS as Distributed by MLS Grid
- 2025-09-26 Coming Soon — NORTHSTARMLS as Distributed by MLS Grid
- 2025-09-11 Rental Removed $3,325 TURBOTENANT
- 2025-09-08 Listed for Rent $3,325 TURBOTENANT
- 2025-09-08 Rental Removed $3,325 Avail
- 2025-08-13 Price Changed $3,325 Avail
- 2025-07-25 Listed for Rent $2,600 Avail
- 2025-07-25 Rental Removed $2,600 TURBOTENANT
- 2025-07-20 Listed for Rent $2,600 TURBOTENANT
- 2025-07-20 Rental Removed $2,600 Avail
- 2025-07-10 Price Changed $2,600 Avail
- 2025-07-07 Relisted — NORTHSTARMLS as Distributed by MLS Grid
- 2025-06-27 Price Changed $2,200 Avail
- 2025-06-19 Listed for Rent $2,660 Avail
- 2024-04-24 Listing Removed — NORTHSTARMLS as Distributed by MLS Grid
- 2024-04-24 Listed $380,000 NORTHSTARMLS as Distributed by MLS Grid
- 2024-04-12 Listing Removed — NORTHSTARMLS as Distributed by MLS Grid
- 2024-03-24 Rental Removed $2,000 APPFOLIO
- 2024-03-14 Rental Removed $2,000 RENT.
- 2024-03-13 Price Changed $2,000 APPFOLIO
- 2024-03-07 Price Changed $329,900 NORTHSTARMLS as Distributed by MLS Grid
- 2024-02-27 Price Changed $319,900 NORTHSTARMLS as Distributed by MLS Grid
- 2024-02-23 Price Changed $1,900 RENT.
- 2024-02-12 Listed for Rent $2,400 RENT.
- 2024-02-08 Rental Removed $2,400 RENT.
- 2024-02-06 Price Changed $2,400 RENT.
- 2024-01-08 Listed for Rent $1,919 RENT.
- 2023-12-18 Price Changed $1,919 APPFOLIO
- 2023-11-27 Rental Removed $2,000 RENT.
- 2023-11-14 Price Changed $2,000 APPFOLIO
- 2023-11-06 Price Changed $2,260 RENT.
- 2023-11-02 Listed for Rent $2,460 RENT.
- 2023-10-25 Price Changed $2,200 APPFOLIO
- 2023-10-12 Price Changed $340,000 NORTHSTARMLS as Distributed by MLS Grid
- 2023-10-11 Listed for Rent $2,660 APPFOLIO
- 2023-08-15 Price Changed $351,900 NORTHSTARMLS as Distributed by MLS Grid
- 2023-07-11 Price Changed $361,900 NORTHSTARMLS as Distributed by MLS Grid
- 2023-06-15 Price Changed $362,500 NORTHSTARMLS as Distributed by MLS Grid
- 2023-06-05 Price Changed $368,000 NORTHSTARMLS as Distributed by MLS Grid
- 2023-05-22 Listed $375,000 NORTHSTARMLS as Distributed by MLS Grid
- 2023-04-17 Listing Removed — NORTHSTARMLS as Distributed by MLS Grid
- 2023-02-17 Relisted — NORTHSTARMLS as Distributed by MLS Grid
- 2022-12-05 Price Changed $360,000 NORTHSTARMLS as Distributed by MLS Grid
- 2022-11-22 Listed $380,000 NORTHSTARMLS as Distributed by MLS Grid
- 2022-04-15 Sold (MLS) $164,000 NORTHSTARMLS as Distributed by MLS Grid
- 2022-04-07 Pending — NORTHSTARMLS as Distributed by MLS Grid
- 2022-03-11 Relisted — NORTHSTARMLS as Distributed by MLS Grid
- 2022-01-10 Listed $199,900 NORTHSTARMLS as Distributed by MLS Grid
Property tax history
+9.4%/yrLatest (2025): $5,786 · +55.7% YoY. Source: county tax records.
Cash-flow waterfall
monthlySold comps — $/sqft
last 12 mo · ≤1 miLoading sold comps…