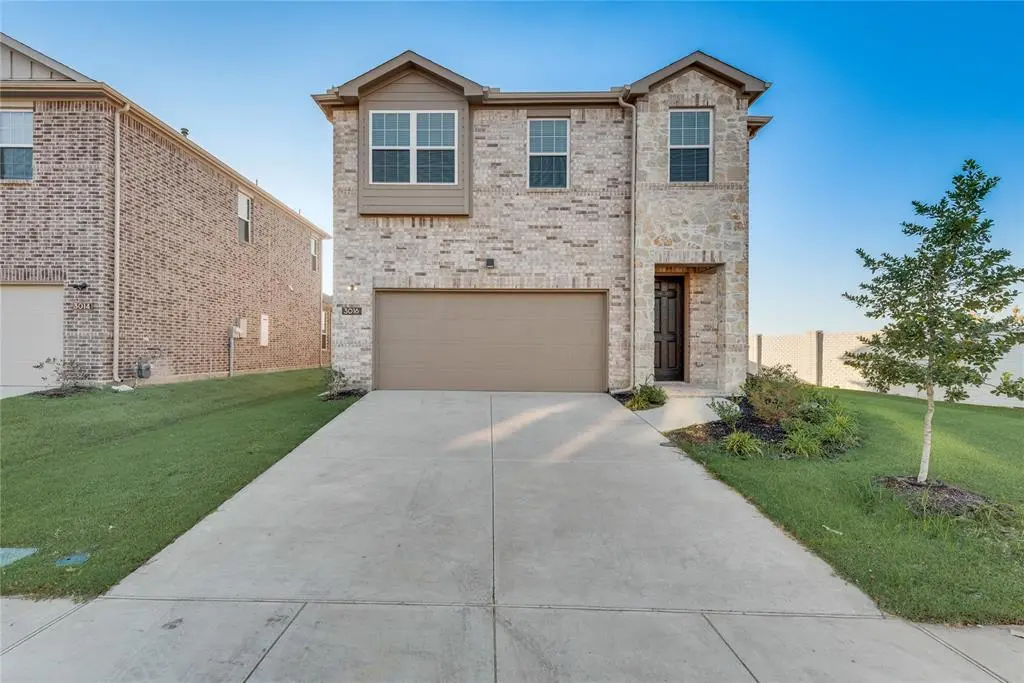
3016 Isla Ter · Princeton, TX
Flood risk No data
- FEMA flood zone
- —
- Chance of flooding over 30 yrs
- —
- Est. flood insurance / yr
- —
Fire risk No data
- Est. fire insurance / yr
- —
Heat risk No data
- Hot days now (above threshold)
- —
- Hot days in 30 yrs
- —
Wind risk No data
- Chance of severe wind over 30 yrs
- —
Air-quality risk No data
- Unhealthy air days now
- —
- Unhealthy air days in 30 yrs
- —
Risk factors via First Street. Map © Google.
Why this score? — see what drove the D- grade
The composite is a weighted blend of 9 inputs, each scored 0–100. Each bar is that input's sub-score; the figure is the points it added to the 100-point composite (weight × sub-score).
- ARV discount +12.0/15.0
- Cash flow +8.3/30.0
- Schools +4.2/10.0
- Livability +3.1/5.0
- 1% rule +2.8/10.0
- Condition / age +2.5/5.0
- DSCR +2.2/10.0
- Rent growth +2.2/5.0
- Appreciation +0.0/10.0
$314,990
🖨 Deal sheet (PDF) 📄 Offer letter ✓ Due diligence
Listing remarks MLS
Discover this stunning 4-bedroom, 2.5-bath home, perfectly situated on a desirable corner lot in Princeton's exclusive lagoon community. Offering an impressive blend of comfort and elegance, this residence promises an inviting atmosphere ideal for both relaxation and entertainment. Step inside to find a light and bright open floor plan accentuated by expansive windows that flood every room with natural light. The spacious living area flows seamlessly into a modern kitchen featuring sleek countertops, ample cabinetry, and a breakfast bar. Generously-sized bedrooms ensure comfort and versatility, while the master suite boasts a private bath with dual vanities and a walk-in closet. Outside, enjoy your slice of paradise with lush landscaping and ample yard space for outdoor activities. The vibrant community offers a resort-style lagoon, making everyday feel like a vacation. Don't miss out on this exceptional property.
Key facts
- Open floor plan
- Private bath
- Walk-in closet
Tags
Neighborhood map
What this means for you Summary
Snapshot
- This is a 4-bed/2.5-bath single-family listed at $315k.
Deal economics
- At list price, monthly cash flow is $-290 ($-3k/yr) — negative.
- To cash-flow at today's rent, offer at most $273k (13.3% below list).
- To meet the 1% rule (rent ≥ 1% of price), the offer needs to be $245k (22.2% below list).
- Recommended offer: $245k (22.2% below list) — sets the bar for 1% rule.
Location & tenants
- Location reads 62/100 on livability (#969 in TX) — a middle-class / working-renter tenant base. Strengths: employment A+, housing A+, cost of living A; Watch: schools C-, amenities F, commute F.
- Princeton ISD (suburban): math 51% / reading 47% proficiency, ranked #188 of 826 in TX (top 23%) — families likely to look elsewhere, expect single-tenant / working-renter base with shorter leases.
- Market conditions: Rents soft (-1.0%/yr); 1404 active listings in the ZIP; 40 comparable units currently listed for rent nearby; rentals at typical pace (median 25d on market — plan ~3-4 weeks tenant-placement turnaround); 40% of comp listings sitting > 30 days — soft ceiling on asking rent; solid renter incomes; 19,194 units permitted in Collin County in 2024 (3,988 in 5+ unit buildings).
Forward outlook
- Local home prices are declining (-3.0%/yr); year-one equity from $2k of loan paydown is wiped out by about $9k of value loss. Plan a longer hold.
- Collin County population projected at +60% by 2050 — long-run rental-demand tailwind backs the buy-and-hold thesis.
Negotiation context
- It's been on market 85 days — a 6% lower offer ($296k) is reasonable based on typical stale-listing flexibility.
- 2 sale attempts with the ask held roughly flat each time — persistent listings suggest the price (not the market) is what's stuck; bring a comps-based counter.
Questions for the listing agent
- What do current leases actually rent for vs. the listed asking? Can we see a recent rent roll and the last 12 months of T-12 income?
- It's been on market 85 days. Have you received any prior offers? Is the seller open to a 22% concession, seller financing, or rate buy-down credit?
- What does the HOA fee cover, when was the last increase, and are there any pending special assessments or reserve-fund shortfalls?
- Why hasn't it sold? Are there any deal-killer items the seller is aware of (foundation, flood, title, zoning, code violations)?
- Is there a deadline driving the sale (1031 exchange, divorce, estate, relocation)? That informs how much negotiation room exists.
- The area grade is low — what's the realistic commute time and amenity access for the typical tenant pool here? Any planned neighborhood developments (good or bad) we should know about?
- What's the average days-on-market for RENTAL listings here right now (not sales)? A rising rental-DOM trend means longer vacancies and softer asking-rent achievability than the comps imply.
- What's the recent tenant-quality profile in this submarket — average credit score on applications, eviction rate, late-payment / NSF rate, and stable-employment percentage? A property-management company in the area should have these aggregated.
- How much new for-sale + rental construction is in the pipeline within 1–3 miles? Heavy new supply typically softens prices + rents 12–24 months out; constrained supply supports both.
Investment metrics
- 1% rule
- 0.78% ✗
- Cap rate
- 5.19%
- Cash-on-cash
- -3.94%
- DSCR
- 0.82
- GRM
- 10.7
CMA / ARV
- ARV (median comp)
- $349,569
- List price
- $314,990
- Delta
- -9.89%
- Verdict
- FAIR
- Comps
- 20 within 1.0 mi
Show comp detail 12 sales within ~0.75 mi
| Address | Dist | Beds/Ba | Sqft | Sold | Price | $/sf | Match |
|---|---|---|---|---|---|---|---|
| 3206 Lucia Way | 0.15mi | 4/2.5 | 2,253 (0%) | 0mo | $314,990 | $140 | 93 |
| 2306 Winthrop Ave | 0.61mi | 4/3.0 | 2,260 (+0%) | 1mo | $284,500 | $126 | 68 |
| 3411 High Valley Dr | 0.63mi | 4/2.5 | 2,255 (+0%) | 6mo | $347,382 | $154 | 66 |
| 2316 Winthrop Ave | 0.57mi | 4/2.5 | 2,121 (-6%) | 1mo | $319,490 | $151 | 62 |
| 2105 N Washington St | 0.75mi | 4/3.0 | 2,264 (+0%) | 0mo | $329,500 | $146 | 62 |
| 210 Greenbriar Dr | 0.69mi | 4/2.5 | 2,341 (+4%) | 1mo | $337,990 | $144 | 61 |
| 202 Greenbriar Dr | 0.67mi | 4/2.5 | 2,071 (-8%) | 3mo | $314,990 | $152 | 53 |
| 117 Fairlawn Dr | 0.70mi | 4/3.0 | 2,448 (+9%) | 1mo | $369,990 | $151 | 50 |
| 203 Greenbriar Dr | 0.64mi | 4/2.5 | 1,981 (-12%) | 4mo | $335,717 | $169 | 46 |
| 110 Greenbriar Dr | 0.63mi | 4/3.5 | 2,536 (+13%) | 2mo | $354,990 | $140 | 44 |
| 200 Greenbriar Dr | 0.66mi | 4/3.5 | 2,537 (+13%) | 3mo | $354,990 | $140 | 42 |
| 3605 Belfort Dr | 0.73mi | 3/2.0 (-1) | 1,981 (-12%) | 1mo | $322,990 | $163 | 38 |
Match score weights: distance 35% · size 25% · config 20% · recency 20%. Top-matched comps best support the ARV.
Projected returns pro-forma
-3.0% appreciation · 0.0% rent growth · sell at horizon
- IRR
- -26.4%
- Equity multiple
- 0.13×
- Total profit
- $-76,601
- Equity at exit
- $46,966
- IRR
- -38.4%
- Equity multiple
- -0.34×
- Total profit
- $-117,938
- Equity at exit
- $27,235
Cash invested: $88,197 (down + closing). Projections, not guarantees.
Landlord ↔ Tenant lean methodology
- Overall (STATE)
- 87 Strongly Landlord-Friendly
- State Texas
- 87 Strongly Landlord-Friendly · R+5
- County
- — inherits STATE
- City
- — inherits STATE
ZIP-level market 75407
- Home prices YoY
- -30.3%
- Rents YoY
- -1.0%
- Active inventory
- 1404
- Price-to-rent
- 10.7×
Monthly cashflow live
- Estimated rent
- $2,451 high interval (Pro) →
- Mortgage (P&I)
- −$1,652
- Tax est. 1.5%
- −$394 /mo · $4,725/yr
- Insurance
- −$131
- HOA
- −$49
- Vacancy / Maint / Mgmt
- −$515
- Net cashflow
- $-290
Break-even live
Sensitivity live
| Price | -10% $-72 | -5% $-181 | +0% $-290 | +5% $-398 | +10% $-507 |
|---|---|---|---|---|---|
| Rent | -10% $-483 | -5% $-386 | +0% $-290 | +5% $-193 | +10% $-96 |
| Rate | -1.0pp $-131 | -0.5pp $-209 | base $-290 | +0.5pp $-371 | +1.0pp $-454 |
UW: 25.0% down · 7.5% · 30yr · 1.5% tax · 5.0% vac · 8.0% maint · 8.0% mgmt
Financing live
Cash to close
- Down payment
- $78,748
- Closing costs
- $9,450
- Reserves months
- —
- Total cash needed
- —
Loan-product check · same deal, 3 products live
Conventional
25% down · 7.5% · 30yr
- Down + closing
- —
- Monthly P&I
- —
- Monthly cashflow
- —
- DSCR
- —
- Eligible?
- —
Personal DTI + credit; lowest rate.
DSCR
20% down · 8.5% · 30yr
- Down + closing
- —
- Monthly P&I
- —
- Monthly cashflow
- —
- DSCR
- —
- Eligible?
- —
No personal income docs; deal must DSCR.
Hard money
10% down · 12.0% · 12mo
- Down + closing
- —
- Monthly P&I
- —
- Monthly cashflow
- —
- DSCR
- —
- Eligible?
- —
Short-term bridge; refi at stabilization.
Rent comps 40 comps
| Address | Beds | Baths | Sqft | Rent | $/sqft | DOM | Units | Dist |
|---|---|---|---|---|---|---|---|---|
| 3007 Italia Ter Princeton, TX | 3.0 | 2.0 | 1800 | $2,300 | $1.28 | 25d | 1 | 0.07mi |
| 2902 Italia Ter McKinney, TX | 4.0 | 2.0 | 2102 | $2,450 | $1.17 | 13d | 1 | 0.07mi |
| 507 Parrino Pkwy McKinney, TX | 4.0 | 3.5 | 2445 | $2,595 | $1.06 | 19d | 1 | 0.09mi |
| 3112 Lucia Way McKinney, TX | 4.0 | 3.0 | 2445 | $2,190 | $0.90 | 44d | 1 | 0.09mi |
| 513 Parrino Pkwy Princeton, TX | 4.0 | 2.0 | 2184 | $2,200 | $1.01 | 18d | 1 | 0.09mi |
| 3112 Cordelia Dr McKinney, TX | 4.0 | 2.5 | 2037 | $2,100 | $1.03 | 3d | 1 | 0.10mi |
| 3114 Cordelia Dr McKinney, TX | 4.0 | 2.5 | 2906 | $2,200 | $0.76 | 7d | 1 | 0.10mi |
| 403 Parrino Pkwy McKinney, TX | 4.0 | 3.0 | 2800 | $2,800 | $1.00 | 19d | 1 | 0.10mi |
| 3113 Cordelia Dr McKinney, TX | 4.0 | 2.5 | 2454 | $2,495 | $1.02 | 19d | 1 | 0.12mi |
| 3115 Cordelia Dr McKinney, TX | 4.0 | 2.5 | 2508 | $2,550 | $1.02 | 22d | 1 | 0.12mi |
| 3120 Cordelia Dr McKinney, TX | 4.0 | 3.0 | 2445 | $2,350 | $0.96 | 44d | 1 | 0.12mi |
| 3108 Giovanni Pt Princeton, TX | 4.0 | 2.0 | 2387 | $1,950 | $0.82 | 44d | 1 | 0.13mi |
| 2905 Cantoni Crk Princeton, TX | 4.0 | 2.0 | 1800 | $2,300 | $1.28 | 44d | 1 | 0.14mi |
| 3114 Giovanni Pt McKinney, TX | 4.0 | 2.0 | 1958 | $2,300 | $1.17 | 21d | 1 | 0.15mi |
| 3212 Cordelia Dr McKinney, TX | 4.0 | 2.5 | 2253 | $2,150 | $0.95 | 4d | 1 | 0.19mi |
| 3212 Lucia Way McKinney, TX | 4.0 | 2.5 | 2311 | $2,200 | $0.95 | 19d | 1 | 0.19mi |
| 810 Sicily Blvd Princeton, TX | 4.0 | 3.0 | 1906 | $2,300 | $1.21 | 25d | 1 | 0.24mi |
| 905 Sicily Blvd Princeton, TX | 4.0 | 2.5 | 2247 | $2,300 | $1.02 | 5d | 1 | 0.29mi |
| 3009 Camilli Cv , TX | 4.0 | 2.5 | 2438 | $2,500 | $1.03 | 44d | 1 | 0.32mi |
| 3204 Ferrero Ln Princeton, TX | 3.0 | 2.0 | 1814 | $1,950 | $1.07 | 2d | 1 | 0.33mi |
| 112 Connecticut Ct , TX | 3.0 | 2.5 | 1605 | $1,990 | $1.24 | 44d | 1 | 0.53mi |
| 2312 Winthrop Ave Princeton, TX | 5.0 | 3.0 | 2609 | $2,275 | $0.87 | 44d | 1 | 0.57mi |
| 2313 States St Princeton, TX | 3.0 | 2.5 | 1826 | $2,200 | $1.20 | 25d | 1 | 0.57mi |
| 2304 Winthrop Ave Princeton, TX | 5.0 | 3.0 | 2777 | $2,600 | $0.94 | 44d | 1 | 0.60mi |
| 2206 Pioneer Dr Princeton, TX | 5.0 | 3.0 | 2777 | $2,600 | $0.94 | 44d | 1 | 0.61mi |
| 1901 States St Princeton, TX | 4.0 | 3.0 | 2260 | $2,700 | $1.19 | 25d | 1 | 0.62mi |
| 216 Savannah Way Princeton, TX | 3.0 | 2.5 | 1650 | $1,875 | $1.14 | 7d | 1 | 0.69mi |
| 2119 Hamilton St Princeton, TX | 3.0 | 2.5 | 1605 | $2,000 | $1.25 | 44d | 1 | 0.70mi |
| 2117 Revere Dr Princeton, TX | 3.0 | 2.5 | 1633 | $2,050 | $1.26 | 44d | 1 | 0.72mi |
| 3602 High Valley Dr McKinney, TX | 5.0 | 3.0 | 2760 | $3,750 | $1.36 | 25d | 1 | 0.73mi |
| 603 Charity Dr Princeton, TX | 4.0 | 2.5 | 2252 | $2,300 | $1.02 | 44d | 1 | 0.77mi |
| 2008 Washington St Princeton, TX | 5.0 | 2.5 | 3144 | $2,600 | $0.83 | 44d | 1 | 0.78mi |
| 2004 Hancock Cir Princeton, TX | 4.0 | 3.0 | 2258 | $1,995 | $0.88 | 13d | 1 | 0.78mi |
| 311 Pennsylvania Ave Princeton, TX | 4.0 | 3.0 | 2258 | $2,195 | $0.97 | 25d | 1 | 0.80mi |
| 408 Forest St Princeton, TX | 5.0 | 3.5 | 2617 | $2,595 | $0.99 | 3d | 1 | 0.82mi |
| 718 Declaration Dr Princeton, TX | 4.0 | 2.0 | 1991 | $2,195 | $1.10 | 44d | 1 | 0.83mi |
| 1908 Marquette Dr Princeton, TX | 5.0 | 3.0 | 2609 | $2,150 | $0.82 | 21d | 1 | 0.86mi |
| 1906 Chapel Hill Rd Princeton, TX | 3.0 | 2.5 | 1633 | $1,995 | $1.22 | 44d | 1 | 0.86mi |
| 611 Colgate Cir Princeton, TX | 3.0 | 2.5 | 1920 | $2,500 | $1.30 | 44d | 1 | 0.88mi |
| 1902 Chapel Hill Rd Princeton, TX | 5.0 | 3.0 | 2616 | $2,295 | $0.88 | 5d | 1 | 0.88mi |
HOA detail
- Monthly dues
- $49 · $588/yr
- Likely covers
- landscaping
Listing history 17 events
-
2026-06-18days on market $314,990 Active 85 DOM
-
2026-06-17days on market $314,990 Active 84 DOM
-
2026-06-16days on market $314,990 Active 83 DOM
-
2026-06-15days on market $314,990 Active 82 DOM
-
2026-06-13days on market $314,990 Active 80 DOM
-
2026-06-13days on market $314,990 Active 79 DOM
-
2026-06-09days on market $314,990 Active 76 DOM
-
2026-06-08days on market $314,990 Active 75 DOM
-
2026-06-07days on market $314,990 Active 74 DOM
-
2026-06-04days on market $314,990 Active 71 DOM
-
2026-06-03days on market $314,990 Active 70 DOM
-
2026-06-02days on market $314,990 Active 69 DOM
-
2026-06-01days on market $314,990 Active 68 DOM
-
2026-05-31days on market $314,990 Active 67 DOM
-
2026-03-25$314,990 Active 934-char remark
Show marketing remark (934 chars)
Discover this stunning 4-bedroom, 2.5-bath home, perfectly situated on a desirable corner lot in Princeton's exclusive lagoon community. Offering an impressive blend of comfort and elegance, this residence promises an inviting atmosphere ideal for both relaxation and entertainment. Step inside to find a light and bright open floor plan accentuated by expansive windows that flood every room with natural light. The spacious living area flows seamlessly into a modern kitchen featuring sleek countertops, ample cabinetry, and a breakfast bar. Generously-sized bedrooms ensure comfort and versatility, while the master suite boasts a private bath with dual vanities and a walk-in closet. Outside, enjoy your slice of paradise with lush landscaping and ample yard space for outdoor activities. The vibrant community offers a resort-style lagoon, making everyday feel like a vacation. Don't miss out on this exceptional property.
-
2025-09-04historical
-
2025-07-15$377,900 Active
ⓘ Source: listings_history table (triggers on properties + properties_extension) + one-shot
backfill from property_details.listing_events for pre-trigger history.
Nearby sold comps map
Loading sold comps map…
Walkable amenities ~0.75 mi
Loading nearby amenities…
Taxation est. · year 1
- Rental income
- $29,411
- − Mortgage interest
- −$17,644
- − Property taxes
- −$4,725
- − Insurance
- −$1,575
- − Repairs & maintenance
- −$2,353
- − Management
- −$2,353
- − HOA
- −$588
- − Depreciation
- −$9,163
- Taxable loss
- −$8,990
- Est. tax savings @ 24.0%
- +$2,158
- After-tax cash flow
- $-1,317/yr
For passive investors: Depreciation is non-cash, so a rental often shows a tax loss while cash-flowing — sheltering income. Rental losses are passive: they offset passive income freely, and up to $25,000/yr can offset ordinary (W-2) income if you actively participate and your MAGI is under $100k (phasing out to $0 by $150k); unused losses carry forward. On sale, claimed depreciation is recaptured at up to 25%, and gains may owe capital-gains tax (a 1031 exchange can defer both). Figures are a year-1 estimate at your 24.0% rate — not tax advice; consult a CPA.
Schools (NCES district)
- District
- Princeton ISD
- NCES district ID
- 4835850
- Math proficiency
- 51% ▼ -8.00%
- Reading proficiency
- 47% ▬ 0.00%
- Median HH income
- $54,827
- Composite
- 42.44/100
- National rank
- #3226
- State rank
- #188 of 826 in TX
Livability — Princeton
- Score
- 62/100
- State rank
- #969
- US rank
- #17215
Category grades
Schools grade is shown separately in the Schools card above.
Census & demographics
- County
- Collin County · 1,159,394 people
- City population
- 34,171
- Metro
- Dallas-Fort Worth-Arlington, TX
- Population (ZIP)
- 34,171
- Household income
- $100,037
- Rent vs Own
- Severe rent burden
- 368.0
Population outlook (Collin County) Hauer SSP2
- Today (2025)
- 1,210,074 people
- By 2030
- 1,358,201 · +12.2%
- By 2040
- 1,654,061 · +36.7%
- By 2050
- 1,937,359 · +60.1%
- By 2075
- 2,567,039 · +112.1%
- By 2100
- 2,952,048 · +144.0%
Race, ethnicity, and origin ACS 2023
- Neighborhood character
- Diverse neighborhood (Simpson 0.66)
- Race & ethnicity
- White 47% Hispanic / Latino 30% Black 17% Two or more races 10% Asian 4% Native American 1%
- Hispanic origin (detail)
- Mexican 26%
- Common ancestry
- Lithuanian 2% Romanian 1% Russian 1%
- Foreign-born
- 15% · Canada, China, Mexico
- Languages at home
- 70% English-only · Spanish 22% Other Indo-European 2% Other Asian/Pacific 1%
Political lean MEDSL · Collin
- 2024 margin
- R (+11.1) · D 43.1% · R 54.3% · Other 2.6%
- 2008→2024 swing
- +14.4pp toward D · 2008: -25.6pp · 2024: -11.1pp
- All cycles
- 2024: R+11.1 2020: R+4.3 2016: R+17.0 2012: R+31.6 2008: R+25.6
Not yet ingested
- Civics
- —
Market trends
- HPI YoY
- ▼ -103.99%
- Current HPI
- 238.9373
- Rent YoY
- ▼ -1.02%
- Metro
- Dallas-Fort Worth-Arlington, TX
- State GDP YoY
- ▲ 3.95%
- F500 in state
- 110
Industry mix (Fortune 500 HQ in TX)
| Industry | F500 HQs | Revenue |
|---|---|---|
| Energy | 16 | $1,198B |
|
||
| Technology | 5 | $198B |
|
||
| Engineering / Construction | 4 | $72B |
|
||
| Energy Services | 3 | $60B |
|
||
| Utilities | 3 | $41B |
|
||
| Healthcare | 2 | $330B |
|
||
Price history
-16.6% since first listed3 events — show timeline
- 2026-03-25 Listed $314,990 NTREIS
- 2025-09-04 Listing Removed — NTREIS
- 2025-07-15 Listed $377,900 NTREIS
Cash-flow waterfall
monthlySold comps — $/sqft
last 12 mo · ≤1 miLoading sold comps…