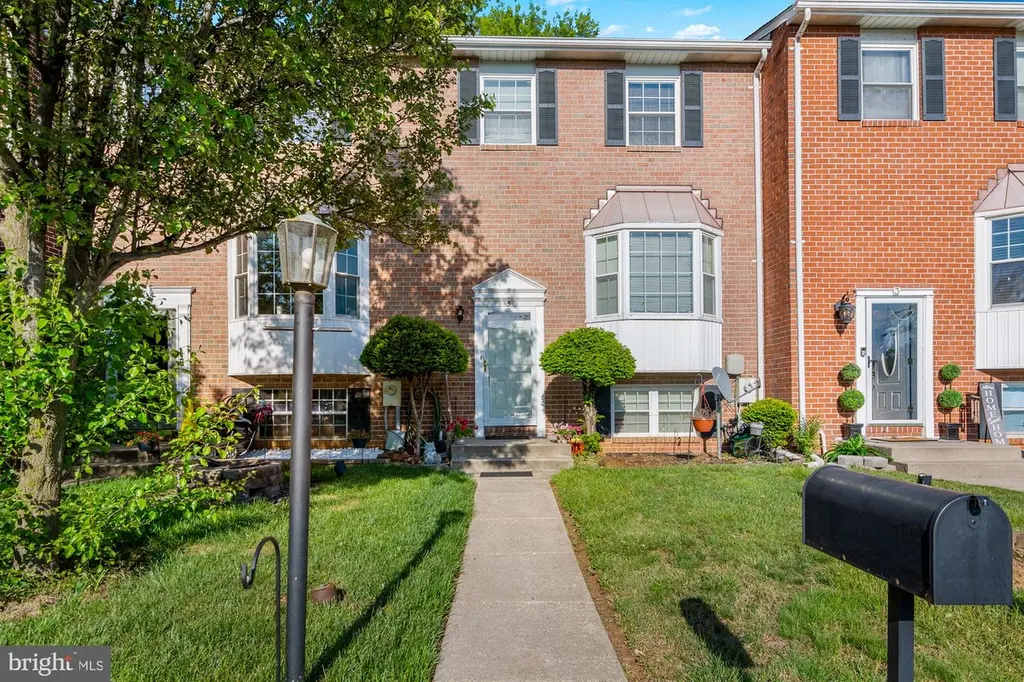
5 Stone Falls Ct · Perry Hall, MD
Flood risk 1/10 · Minimal
- FEMA flood zone
- X (unshaded)
- Chance of flooding over 30 yrs
- 0.0%
- Est. flood insurance / yr
- $473 – $860
Fire risk 3/10 · Minor
- Est. fire insurance / yr
- $755 – $1,403
Heat risk 7/10 · Major
- Hot days now (above 105°F)
- 7 days/yr
- Hot days in 30 yrs
- 15 days/yr
Wind risk 6/10 · Moderate
- Chance of severe wind over 30 yrs
- 27.0%
Air-quality risk 4/10 · Minor
- Unhealthy air days now
- 5 days/yr
- Unhealthy air days in 30 yrs
- 7 days/yr
Risk factors via First Street. Map © Google.
Why this score? — see what drove the C- grade
The composite is a weighted blend of 9 inputs, each scored 0–100. Each bar is that input's sub-score; the figure is the points it added to the 100-point composite (weight × sub-score).
- Cash flow +14.9/30.0
- ARV discount +13.9/15.0
- DSCR +4.6/10.0
- Livability +4.4/5.0
- 1% rule +4.0/10.0
- Rent growth +3.8/5.0
- Condition / age +2.5/5.0
- Schools +2.3/10.0
- Appreciation +0.0/10.0
$270,000
🖨 Deal sheet 📄 Offer letter ✓ Due diligence
Listing remarks
Great new listing in Oakhurst. Value priced with room to improve and build equity!! This home is sold subject to existing lease and is currently rented through 1/31/27. Split foyer townhome with brick front and bay window features just a few steps up to the main level with living room, dining room and eat-in kitchen. French doors off the living room to a large rear deck. The upper level features three bedrooms and a full bath. On the lower level, you will find a family room, fourth bedroom or office, plus a full bath. Lower level has door to rear patio. Separate area for laundry. Home has had several improvements over the last few years including roof, front door, storm door, and HVAC. Gr
Key facts
- Built 1983
- Listed 33 days
Property features AI
Exterior
- Parking: Off-street parking
- Utilities: Public water; Public sewer; 200+ amp electric service; Fiber optic and cable internet available; Cable TV service; underground utilities; Municipal trash service
- Home design: Interior townhouse/rowhouse; Fee simple ownership; Built by Universal Housing; Very good condition
- Construction: Frame construction; Block foundation; Architectural shingle roof; Basement: full, daylight, fully finished, heated, improved with rear entrance and connecting stairway
- Exterior features: Rear fencing; Deck(s); Landscaped yard; No-thru street location; Not in a federal flood zone
Interior
- Kitchen: Electric oven/range
- Bedrooms: Three bedrooms on the upper level; One bedroom on the lower level
- Bathrooms: Two full bathrooms (one on upper level, one on lower level)
- Heating & cooling: Heat pump heating; Central air conditioning with ceiling fans; Electric hot water
- Interior features: Open floor plan with combined dining and living area; Kitchen with table space
Neighborhood map
What this means for you Summary
Snapshot
- This is a 4-bed/1.0-bath townhouse listed at $270k.
Deal economics
- At list price, monthly cash flow is $81 ($966/yr) — positive.
- The deal already cash-flows at list — no discount required.
- To meet the 1% rule (rent ≥ 1% of price), the offer needs to be $242k (10.4% below list).
- Recommended offer: $242k (10.4% below list) — sets the bar for 1% rule.
- Cap rate 6.7% vs local median 4.2% in Perry Hall — top-decile yield for the area; either an underpriced asset or a hidden risk that comps aren't pricing in. Stress-test before assuming the spread holds.
Location & tenants
- Location reads 87/100 on livability (#8 in MD, #313 nationally) — a professional / high-income tenant draw. Strengths: employment A+, housing A+, health & safety A+; Watch: cost of living C-, crime D-.
- Baltimore County Public Schools (suburban): math 15% / reading 34% proficiency, ranked #11 of 24 in MD (top 46%) — low school quality limits family demand, transient renter base, plan for 1-2y turnover.
- Market conditions: Rents rising fast (+5.3%/yr); 132 active listings in the ZIP; 8 comparable units currently listed for rent nearby; rentals at typical pace (median 22d on market — plan ~3-4 weeks tenant-placement turnaround); solid renter incomes; 1,511 units permitted in Baltimore County in 2024 (643 in 5+ unit buildings).
- This rent runs 31% of the median local income ($95k/yr) — at the standard rent-burdened threshold; future hikes will face affordability resistance.
Forward outlook
- Local home prices are declining (-3.0%/yr); year-one equity from $2k of loan paydown is wiped out by about $8k of value loss. Plan a longer hold.
- Baltimore County population projected at +12% by 2050 — modest demand growth; plan on rents tracking national, not racing it.
Negotiation context
- It's been on market 33 days — a 3% lower offer ($262k) is reasonable based on typical stale-listing flexibility.
- 2 sale attempts with the ask held roughly flat each time — persistent listings suggest the price (not the market) is what's stuck; bring a comps-based counter.
- Current owner paid $176k; list at $270k implies a 53% gain — meaningful room to come down on a strong offer.
Risks & watch-outs
- Climate carrying-cost: major wind risk, 27% chance of damaging wind over 30y; extreme-heat days projected 7→15/yr by 2055 (HVAC capex compounding) — expect insurance premiums to compound above CPI over the hold.
Questions for the listing agent
- It's been on market 33 days. Have you received any prior offers? Is the seller open to a 10% concession, seller financing, or rate buy-down credit?
- Is there a deadline driving the sale (1031 exchange, divorce, estate, relocation)? That informs how much negotiation room exists.
- Schools are A-rated — typically a magnet for longer-tenancy family renters. What's the average tenant stay here, and is there a school-zone premium baked into asking?
- Crime grade is D in this area — have there been break-ins, vandalism, or insurance claims at this property in the last 3 years? What carrier currently insures it and at what premium?
- What's the average days-on-market for RENTAL listings here right now (not sales)? A rising rental-DOM trend means longer vacancies and softer asking-rent achievability than the comps imply.
- What's the recent tenant-quality profile in this submarket — average credit score on applications, eviction rate, late-payment / NSF rate, and stable-employment percentage? A property-management company in the area should have these aggregated.
- How much new for-sale + rental construction is in the pipeline within 1–3 miles? Heavy new supply typically softens prices + rents 12–24 months out; constrained supply supports both.
Investment metrics
- 1% rule
- 0.90% ✗
- Cap rate
- 6.65%
- Cash-on-cash
- 1.28%
- DSCR
- 1.06
- GRM
- 9.3
CMA / ARV
- ARV (median comp)
- $314,874
- List price
- $270,000
- Delta
- -14.25%
- Verdict
- UNDERPRICED
- Comps
- 20 within 1.0 mi
Show comp detail 5 sales within ~0.75 mi
| Address | Dist | Beds/Ba | Sqft | Sold | Price | $/sf | Match |
|---|---|---|---|---|---|---|---|
| 12 Hallview Ct | 0.13mi | 3/1.5 (-1) | 1,280 (0%) | 14mo | $275,000 | $215 | 75 |
| 11 Powder Vw | 0.05mi | 4/2.5 | 1,430 (+12%) | 10mo | $292,500 | $205 | 64 |
| 9 Stone Park Pl | 0.14mi | 4/2.5 | 1,430 (+12%) | 13mo | $325,000 | $227 | 57 |
| 28 Sandstone Ct | 0.46mi | 3/3.5 (-1) | 1,340 (+5%) | 1mo | $338,000 | $252 | 55 |
| 24 Hoban Ct | 0.53mi | 3/1.5 (-1) | 1,220 (-5%) | 19mo | $301,000 | $247 | 44 |
Match score weights: distance 35% · size 25% · config 20% · recency 20%. Top-matched comps best support the ARV.
Projected returns pro-forma
-3.0% appreciation · 5.34% rent growth · sell at horizon
- IRR
- -11.7%
- Equity multiple
- 0.57×
- Total profit
- $-32,776
- Equity at exit
- $40,258
- IRR
- 0.6%
- Equity multiple
- 1.04×
- Total profit
- $3,230
- Equity at exit
- $23,345
Cash invested: $75,600 (down + closing). Projections, not guarantees.
Landlord ↔ Tenant lean methodology
- Overall (STATE)
- 27 Tenant-Leaning
- State Maryland
- 27 Tenant-Leaning · D+14
- County
- — inherits STATE
- City
- — inherits STATE
ZIP-level market 21236
- Rents YoY
- 5.3%
- Active inventory
- 132
- Price-to-rent
- 9.3×
Monthly cashflow live
- Estimated rent
- $2,420 high interval (Pro) →
- Mortgage (P&I)
- −$1,416
- Tax from tax record
- −$303 /mo · $3,638/yr
- Insurance
- −$112
- HOA
- −$0
- Vacancy / Maint / Mgmt
- −$508
- Net cashflow
- $81
Break-even live
UW: 25.0% down · 7.5% · 30yr · 1.5% tax · 5.0% vac · 8.0% maint · 8.0% mgmt
Financing live
Cash to close
- Down payment
- $67,500
- Closing costs
- $8,100
- Reserves months
- —
- Total cash needed
- —
Loan-product check · same deal, 3 products live
Conventional
25% down · 7.5% · 30yr
- Down + closing
- —
- Monthly P&I
- —
- Monthly cashflow
- —
- DSCR
- —
- Eligible?
- —
Personal DTI + credit; lowest rate.
DSCR
20% down · 8.5% · 30yr
- Down + closing
- —
- Monthly P&I
- —
- Monthly cashflow
- —
- DSCR
- —
- Eligible?
- —
No personal income docs; deal must DSCR.
Hard money
10% down · 12.0% · 12mo
- Down + closing
- —
- Monthly P&I
- —
- Monthly cashflow
- —
- DSCR
- —
- Eligible?
- —
Short-term bridge; refi at stabilization.
Rent comps 8 comps
| Address | Beds | Baths | Sqft | Rent | $/sqft | DOM | Units | Dist |
|---|---|---|---|---|---|---|---|---|
| 16 Pike Hall Pl Nottingham, MD | 3.0 | 2.5 | 1280 | $2,400 | $1.88 | 4d | 1 | 0.14mi |
| 35 Bellfalls Way Nottingham, MD | 3.0 | 2.5 | 1642 | $2,300 | $1.40 | 4d | 1 | 0.16mi |
| 23 Beloak Ct Nottingham, MD | 3.0 | 2.5 | 1760 | $2,350 | $1.34 | 4d | 1 | 0.40mi |
| 10 Darbytown Ct Nottingham, MD | 3.0 | 2.0 | 1420 | $1,950 | $1.37 | 43d | 1 | 0.43mi |
| 19 Hoban Ct Nottingham, MD | 3.0 | 2.5 | 1410 | $2,200 | $1.56 | 21d | 1 | 0.60mi |
| 10910 Harford Rd Unit 1 Glen Arm, MD | 4.0 | 2.0 | 1850 | $2,499 | $1.35 | 17d | 1 | 0.67mi |
| 105 Bourbon Ct Parkville, MD | 3.0 | 2.5 | 1320 | $2,150 | $1.63 | 43d | 1 | 0.99mi |
| 2924 Cub Hill Rd Parkville, MD | 3.0 | 2.0 | 1770 | $2,695 | $1.52 | 43d | 1 | 1.34mi |
Listing history 15 events
-
2026-06-13statusdays on market $270,000 Pending 33 DOM
-
2026-06-09days on market $270,000 Active 32 DOM
-
2026-06-08days on market $270,000 Active 31 DOM
-
2026-06-07days on market $270,000 Active 30 DOM
-
2026-06-04days on market $270,000 Active 27 DOM
-
2026-06-03days on market $270,000 Active 26 DOM
-
2026-06-02days on market $270,000 Active 25 DOM
-
2026-06-01days on market $270,000 Active 24 DOM
-
2026-05-31days on market $270,000 Active 23 DOM
-
2026-05-16status Pending 762-char remark
-
2026-05-04$270,000 Active 762-char remark
-
2026-04-27historical $270,000 762-char remark
-
2013-06-06soldstatus $176,000
-
1992-04-16soldstatus $94,000
-
1992-04-16soldstatus $94,000
ⓘ Source: listings_history table (triggers on properties + properties_extension) + one-shot
backfill from property_details.listing_events for pre-trigger history.
Tax reassessment forecast MD · Partial reset (capped growth)
- Current annual tax
- $3,638 · $303/mo
- Projected year-2 tax
- $3,638 · $303/mo
- Expected delta
- $0/yr ($0/mo · 0.0%)
ⓘ Screening estimate from a state-policy table — verify with the county assessor before closing.
Climate risk First Street
- Flood 1/10 Low FEMA zone X (unshaded) · 0% chance over 30 yrs
- Wildfire 3/10 Moderate
- Heat 7/10 Severe 7 d/yr ≥105°F today · 15 d/yr by 30 yrs out
- Wind 6/10 Major 27% chance of damaging wind over 30 yrs
- Air quality 4/10 Moderate 5 unhealthy d/yr today · 7 by 30 yrs out
Nearby sold comps map
Loading sold comps map…
Walkable amenities ~0.75 mi
Loading nearby amenities…
Taxation est. · year 1
- Rental income
- $29,045
- − Mortgage interest
- −$15,124
- − Property taxes
- −$3,638
- − Insurance
- −$1,350
- − Repairs & maintenance
- −$2,324
- − Management
- −$2,324
- − Depreciation
- −$7,855
- Taxable loss
- −$3,569
- Est. tax savings @ 24.0%
- +$857
- After-tax cash flow
- $1,823/yr
For passive investors: Depreciation is non-cash, so a rental often shows a tax loss while cash-flowing — sheltering income. Rental losses are passive: they offset passive income freely, and up to $25,000/yr can offset ordinary (W-2) income if you actively participate and your MAGI is under $100k (phasing out to $0 by $150k); unused losses carry forward. On sale, claimed depreciation is recaptured at up to 25%, and gains may owe capital-gains tax (a 1031 exchange can defer both). Figures are a year-1 estimate at your 24.0% rate — not tax advice; consult a CPA.
Schools (NCES district)
- District
- Baltimore County Public Schools
- NCES district ID
- 2400120
- Math proficiency
- 15% ▼ -16.00%
- Reading proficiency
- 34% ▼ -5.00%
- Median HH income
- $66,746
- Composite
- 23.17/100
- National rank
- #7948
- State rank
- #11 of 24 in MD
Livability — Perry Hall
- Score
- 87/100
- State rank
- #8
- US rank
- #313
Category grades
Schools grade is shown separately in the Schools card above.
Census & demographics
- Census place
- Perry Hall, MD
- County
- Baltimore County · 769,527 people
- City population
- 15,501
- Metro
- Baltimore-Columbia-Towson, MD
- Population (ZIP)
- 39,514
- Household income
- $95,149
- Rent vs Own
- Severe rent burden
- 1476.0
Population outlook (Baltimore County) Hauer SSP2
- Today (2025)
- 885,518 people
- By 2030
- 909,272 · +2.7%
- By 2040
- 951,547 · +7.5%
- By 2050
- 990,955 · +11.9%
- By 2075
- 1,086,411 · +22.7%
- By 2100
- 1,135,078 · +28.2%
Race, ethnicity, and origin ACS 2023
- Neighborhood character
- Diverse neighborhood (Simpson 0.63)
- Race & ethnicity
- White 56% Black 19% Asian 16% Hispanic / Latino 6% Two or more races 5%
- Hispanic origin (detail)
- Mexican 1% Puerto Rican 1%
- Common ancestry
- Romanian 5% Lithuanian 2% Italian 1%
- Foreign-born
- 17% · Canada, South Korea, Vietnam
- Languages at home
- 79% English-only · Other Indo-European 8% Spanish 3% Tagalog/Filipino 2%
Political lean MEDSL · Baltimore
- 2024 margin
- Strong D (+24.5) · D 61.0% · R 36.5% · Other 2.5%
- 2008→2024 swing
- +9.9pp toward D · 2008: 14.6pp · 2024: 24.5pp
- All cycles
- 2024: D+24.5 2020: D+27.0 2016: D+17.4 2012: D+16.4 2008: D+14.6
Not yet ingested
- Civics
- —
Market trends
- HPI YoY
- ▼ -268.43%
- Current HPI
- 244.9907
- Rent YoY
- ▲ 5.34%
- Metro
- Baltimore-Columbia-Towson, MD
- State GDP YoY
- ▲ 2.97%
- F500 in state
- 12
Industry mix (Fortune 500 HQ in MD)
| Industry | F500 HQs | Revenue |
|---|---|---|
| Aerospace / Defense | 1 | $71B |
|
||
| Utilities | 1 | $25B |
|
||
| Hotels | 1 | $24B |
|
||
| Consumer Goods | 1 | $7B |
|
||
| Real Estate | 1 | $6B |
|
||
| Chemicals | 1 | $2B |
|
||
Price history
+187.2% since first listed8 events — show timeline
- 2026-06-10 Pending — BRIGHT MLS
- 2026-05-21 Relisted — BRIGHT MLS
- 2026-05-16 Pending — BRIGHT MLS
- 2026-05-04 Listed $270,000 BRIGHT MLS
- 2026-04-27 Coming Soon $270,000 BRIGHT MLS
- 2013-06-06 Sold (Public Records) $176,000 Public Records
- 1992-04-16 Sold (Public Records) $94,000 Public Records
- 1992-04-16 Sold (Public Records) $94,000 Public Records
Property tax history
+1.9%/yrLatest (2025): $3,638 · +7.9% YoY. Source: county tax records.
Cash-flow waterfall
monthlySold comps — $/sqft
last 12 mo · ≤1 miLoading sold comps…