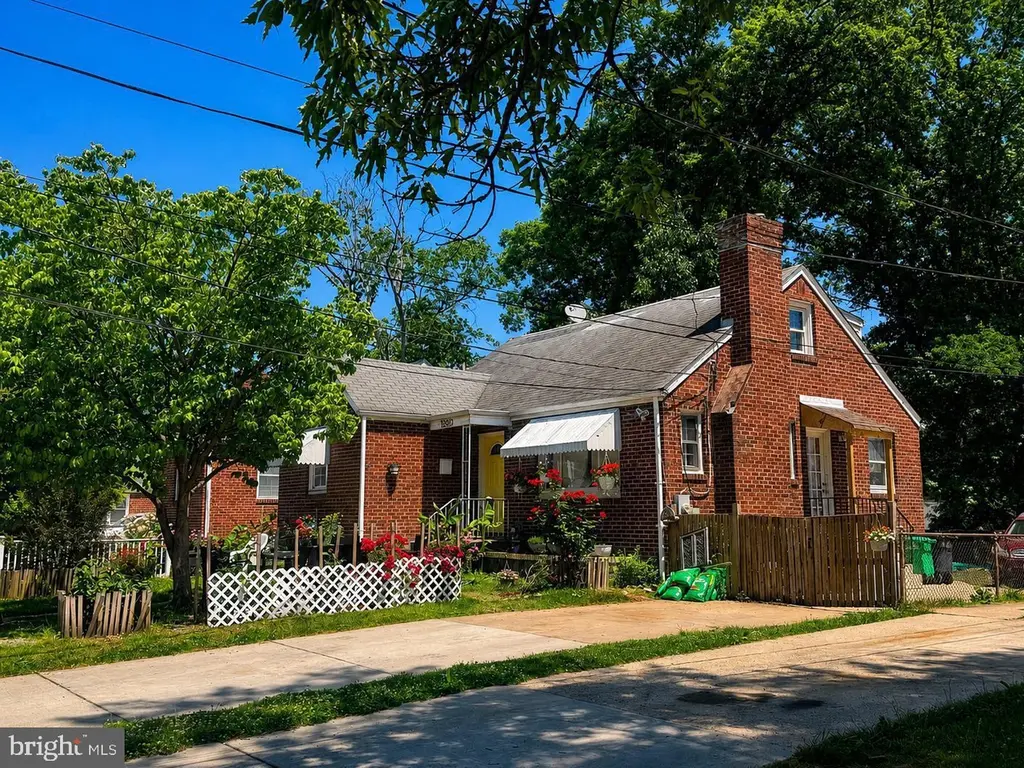
7207 23rd Ave · Chillum, MD
Flood risk 1/10 · Minimal
- FEMA flood zone
- X (unshaded)
- Chance of flooding over 30 yrs
- 0.0%
- Est. flood insurance / yr
- $473 – $860
Fire risk 1/10 · Minimal
- Est. fire insurance / yr
- $755 – $1,403
Heat risk 7/10 · Major
- Hot days now (above 105°F)
- 7 days/yr
- Hot days in 30 yrs
- 15 days/yr
Wind risk 4/10 · Minor
- Chance of severe wind over 30 yrs
- 19.0%
Air-quality risk 4/10 · Minor
- Unhealthy air days now
- 5 days/yr
- Unhealthy air days in 30 yrs
- 6 days/yr
Risk factors via First Street. Map © Google.
Why this score? — see what drove the D+ grade
The composite is a weighted blend of 9 inputs, each scored 0–100. Each bar is that input's sub-score; the figure is the points it added to the 100-point composite (weight × sub-score).
- Cash flow +16.0/30.0
- ARV discount +12.0/15.0
- DSCR +4.9/10.0
- 1% rule +4.4/10.0
- Livability +3.8/5.0
- Rent growth +2.9/5.0
- Condition / age +2.5/5.0
- Schools +1.7/10.0
- Appreciation +0.0/10.0
$375,000
🖨 Deal sheet (PDF) 📄 Offer letter ✓ Due diligence
Listing remarks
Spacious single-family home offering endless potential for investors or owner-occupants ready to make it their own! This detached home features a traditional floor plan with three finished levels, including a full bathroom on each level, offering flexibility and functional living space throughout. The lower level includes convenient side entrance access, creating additional possibilities for multi-generational living or added convenience. Enjoy a private driveway plus both front and backyard space ideal for entertaining, gardening, or future outdoor enhancements. Property needs work but offers tremendous upside for buyers looking to customize, renovate, or build equity. Conveniently located
Key facts
- 5,949 sq ft lot
- 2 parking spots
- Built 1949
Property features AI
Finance
- Other: Fee simple ownership; Ground rent paid annually; Pets allowed with no pet restrictions; Below-average property condition
Exterior
- Parking: Concrete driveway with 2 driveway spaces; Total of 2 garage/parking spaces
- Utilities: Public water; Public sewer
- Home design: Detached property; Not in a federal flood zone
- Construction: Brick construction; Asphalt shingle roof; Other foundation
- Exterior features: Awning(s); Front and rear yards; Level lot; Chain link fencing (full)
Interior
- Kitchen: Refrigerator; Stove
- Bedrooms: Three bedrooms on the main level; One bedroom on the upper level; Two bedrooms on the lower level
- Flooring: Hardwood; Tile/brick
- Bathrooms: Three full bathrooms; One half bathroom
- Heating & cooling: Forced air heating (natural gas); Central air conditioning (electric)
- Interior features: Combination kitchen/dining; Traditional floor plan; Second kitchen; Entry-level bedroom; One fireplace; Fully finished basement with side entrance
- Laundry & utility: Not furnished
Neighborhood map
What this means for you Summary
Snapshot
- This is a 6-bed/2.0-bath single-family listed at $375k.
Deal economics
- At list price, monthly cash flow is $187 ($2k/yr) — positive.
- The deal already cash-flows at list — no discount required.
- To meet the 1% rule (rent ≥ 1% of price), the offer needs to be $353k (5.9% below list).
- Recommended offer: $353k (5.9% below list) — sets the bar for 1% rule.
- Cap rate 6.9% vs local median 4.3% in Chillum — top-decile yield for the area; either an underpriced asset or a hidden risk that comps aren't pricing in. Stress-test before assuming the spread holds.
Location & tenants
- Location reads 75/100 on livability (#105 in MD, #4,157 nationally) — a middle-class / working-renter tenant base. Strengths: commute A+, housing A+, health & safety A; Watch: amenities C-, crime F, cost of living D-.
- Prince George'S County Public Schools (suburban): math 8% / reading 24% proficiency, ranked #21 of 24 in MD (top 88%) — low school quality limits family demand, transient renter base, plan for 1-2y turnover.
- Zoned schools: Lewisdale Elementary (math 2% / reading 7%, grade F, #807 of 860 statewide, top 94%, 617 students, 92% FRL); Nicholas Orem Middle (math 4% / reading 20%, grade F, #202 of 225 statewide, top 91%, 1,138 students, 92% FRL); Northwestern High (math 15% / reading 32%, grade F, #169 of 222 statewide, top 76%, 2,346 students, 80% FRL) — zoned schools average 88% FRL vs 53% district-wide (35 pts higher); higher-poverty schools than district average — tighter screening recommended.
- Market conditions: Rents rising (+1.7%/yr); 96 active listings in the ZIP; 4 comparable units currently listed for rent nearby; rentals lingering (median 46d on market — plan ~5-8 weeks vacancy on turnover, expect pricing pressure); 50% of comp listings sitting > 30 days — soft ceiling on asking rent; solid renter incomes; 1,481 units permitted in Prince George's County in 2024 (0 in 5+ unit buildings).
- At $3,529/mo this rent would consume 49% of the median local household income ($87k/yr) (locally 2222% of renters already pay >50% of income on rent) — very limited rent-growth headroom before tenants either downsize or default.
Forward outlook
- Local home prices are declining (-3.0%/yr); year-one equity from $3k of loan paydown is wiped out by about $11k of value loss. Plan a longer hold.
- Prince George's County population projected at +18% by 2050 — long-run rental-demand tailwind backs the buy-and-hold thesis.
Negotiation context
- Only 2 days on market — expect competitive offers; lowballing is unlikely to land.
- Current owner paid $138k; list at $375k implies a 173% gain — meaningful room to come down on a strong offer.
Risks & watch-outs
- Watch-outs: built in 1949 — expect roof / HVAC / electrical / plumbing capex.
- Climate carrying-cost: extreme-heat days projected 7→15/yr by 2055 (HVAC capex compounding) — expect insurance premiums to compound above CPI over the hold.
Questions for the listing agent
- Built in 1949 — when were the roof, HVAC, electrical panel, plumbing, and water heater last replaced?
- Is there a deadline driving the sale (1031 exchange, divorce, estate, relocation)? That informs how much negotiation room exists.
- Crime grade is F in this area — have there been break-ins, vandalism, or insurance claims at this property in the last 3 years? What carrier currently insures it and at what premium?
- The area grade is low — what's the realistic commute time and amenity access for the typical tenant pool here? Any planned neighborhood developments (good or bad) we should know about?
- What's the average days-on-market for RENTAL listings here right now (not sales)? A rising rental-DOM trend means longer vacancies and softer asking-rent achievability than the comps imply.
- What's the recent tenant-quality profile in this submarket — average credit score on applications, eviction rate, late-payment / NSF rate, and stable-employment percentage? A property-management company in the area should have these aggregated.
- How much new for-sale + rental construction is in the pipeline within 1–3 miles? Heavy new supply typically softens prices + rents 12–24 months out; constrained supply supports both.
Investment metrics
- 1% rule
- 0.94% ✗
- Cap rate
- 6.89%
- Cash-on-cash
- 2.13%
- DSCR
- 1.09
- GRM
- 8.9
CMA / ARV
- ARV (on-the-fly)
- $416,628
- Comps found
- 4
Show comp detail 4 sales within ~0.75 mi
| Address | Dist | Beds/Ba | Sqft | Sold | Price | $/sf | Match |
|---|---|---|---|---|---|---|---|
| 2205 Calvert St | 0.15mi | 5/3.0 (-1) | 1,402 (+10%) | 3mo | $400,000 | $285 | 65 |
| 7005 23rd Pl | 0.21mi | 6/2.0 | 1,188 (-7%) | 23mo | $345,000 | $290 | 60 |
| 7110 24th Ave | 0.09mi | 5/3.0 (-1) | 1,380 (+8%) | 22mo | $450,000 | $326 | 55 |
| 2107 Van Buren St | 0.45mi | 6/2.0 | 1,434 (+12%) | 11mo | $485,000 | $338 | 49 |
Match score weights: distance 35% · size 25% · config 20% · recency 20%. Top-matched comps best support the ARV.
Projected returns pro-forma
-3.0% appreciation · 1.73% rent growth · sell at horizon
- IRR
- -14.3%
- Equity multiple
- 0.49×
- Total profit
- $-53,263
- Equity at exit
- $55,914
- IRR
- -7.8%
- Equity multiple
- 0.54×
- Total profit
- $-48,633
- Equity at exit
- $32,423
Cash invested: $105,000 (down + closing). Projections, not guarantees.
Landlord ↔ Tenant lean methodology
- Overall (STATE)
- 27 Tenant-Leaning
- State Maryland
- 27 Tenant-Leaning · D+14
- County
- — inherits STATE
- City
- — inherits STATE
ZIP-level market 20783
- Rents YoY
- 1.7%
- Active inventory
- 96
- Price-to-rent
- 8.9×
Monthly cashflow live
- Estimated rent
- $3,529 medium interval (Pro) →
- Mortgage (P&I)
- −$1,967
- Tax from tax record
- −$478 /mo · $5,737/yr
- Insurance
- −$156
- HOA
- −$0
- Vacancy / Maint / Mgmt
- −$741
- Net cashflow
- $187
Break-even live
Sensitivity live
| Price | -10% $399 | -5% $293 | +0% $187 | +5% $81 | +10% $-25 |
|---|---|---|---|---|---|
| Rent | -10% $-92 | -5% $47 | +0% $187 | +5% $326 | +10% $466 |
| Rate | -1.0pp $376 | -0.5pp $282 | base $187 | +0.5pp $90 | +1.0pp $-9 |
UW: 25.0% down · 7.5% · 30yr · 1.5% tax · 5.0% vac · 8.0% maint · 8.0% mgmt
Financing live
Cash to close
- Down payment
- $93,750
- Closing costs
- $11,250
- Reserves months
- —
- Total cash needed
- —
Loan-product check · same deal, 3 products live
Conventional
25% down · 7.5% · 30yr
- Down + closing
- —
- Monthly P&I
- —
- Monthly cashflow
- —
- DSCR
- —
- Eligible?
- —
Personal DTI + credit; lowest rate.
DSCR
20% down · 8.5% · 30yr
- Down + closing
- —
- Monthly P&I
- —
- Monthly cashflow
- —
- DSCR
- —
- Eligible?
- —
No personal income docs; deal must DSCR.
Hard money
10% down · 12.0% · 12mo
- Down + closing
- —
- Monthly P&I
- —
- Monthly cashflow
- —
- DSCR
- —
- Eligible?
- —
Short-term bridge; refi at stabilization.
Rent comps 4 comps
| Address | Beds | Baths | Sqft | Rent | $/sqft | DOM | Units | Dist |
|---|---|---|---|---|---|---|---|---|
| 1012 E West Hwy Takoma Park, MD | 5.0 | 2.0 | 1584 | $3,950 | $2.49 | 45d | 1 | 1.04mi |
| 1304 Ray Rd Hyattsville, MD | 6.0 | 3.0 | 1636 | $4,000 | $2.44 | 45d | 1 | 1.21mi |
| 5907 15th Ave Hyattsville, MD | 5.0 | 2.0 | 1792 | $3,550 | $1.98 | 20d | 1 | 1.33mi |
| 6514 8th Ave Hyattsville, MD | 6.0 | 2.5 | 1257 | $3,500 | $2.78 | 14d | 1 | 1.37mi |
Listing history 11 events
-
2026-06-04status $375,000 Pending 2 DOM
-
2026-06-03days on market $375,000 Active 2 DOM
-
2026-06-02statusdays on market $375,000 Active 1 DOM
-
2026-06-01days on market $375,000 Coming Soon 13 DOM
-
2026-05-31days on market $375,000 Coming Soon 12 DOM
-
2026-05-19historical $375,000
-
1998-06-15soldstatus $137,500
-
1998-05-27soldstatus $137,500
-
1998-04-22historical
-
1998-01-07$134,000
-
1970-06-16soldstatus $24,000
ⓘ Source: listings_history table (triggers on properties + properties_extension) + one-shot
backfill from property_details.listing_events for pre-trigger history.
Tax reassessment forecast MD · Partial reset (capped growth)
- Current annual tax
- $5,737 · $478/mo
- Projected year-2 tax
- $5,737 · $478/mo
- Expected delta
- $0/yr ($0/mo · 0.0%)
ⓘ Screening estimate from a state-policy table — verify with the county assessor before closing.
Climate risk First Street
- Flood 1/10 Low FEMA zone X (unshaded) · 0% chance over 30 yrs
- Wildfire 1/10 Low
- Heat 7/10 Severe 7 d/yr ≥105°F today · 15 d/yr by 30 yrs out
- Wind 4/10 Moderate 19% chance of damaging wind over 30 yrs
- Air quality 4/10 Moderate 5 unhealthy d/yr today · 6 by 30 yrs out
Nearby sold comps map
Loading sold comps map…
Walkable amenities ~0.75 mi
Loading nearby amenities…
Taxation est. · year 1
- Rental income
- $42,345
- − Mortgage interest
- −$21,006
- − Property taxes
- −$5,737
- − Insurance
- −$1,875
- − Repairs & maintenance
- −$3,388
- − Management
- −$3,388
- − Depreciation
- −$10,909
- Taxable loss
- −$3,958
- Est. tax savings @ 24.0%
- +$950
- After-tax cash flow
- $3,191/yr
For passive investors: Depreciation is non-cash, so a rental often shows a tax loss while cash-flowing — sheltering income. Rental losses are passive: they offset passive income freely, and up to $25,000/yr can offset ordinary (W-2) income if you actively participate and your MAGI is under $100k (phasing out to $0 by $150k); unused losses carry forward. On sale, claimed depreciation is recaptured at up to 25%, and gains may owe capital-gains tax (a 1031 exchange can defer both). Figures are a year-1 estimate at your 24.0% rate — not tax advice; consult a CPA.
Schools (NCES district)
- District
- Prince George'S County Public Schools
- NCES district ID
- 2400510
- Math proficiency
- 8% ▼ -11.00%
- Reading proficiency
- 24% ▼ -9.00%
- Median HH income
- $73,967
- Composite
- 16.82/100
- National rank
- #9151
- State rank
- #21 of 24 in MD
Livability — Chillum
- Score
- 75/100
- State rank
- #105
- US rank
- #4157
Category grades
Schools grade is shown separately in the Schools card above.
Census & demographics
- Census place
- Chillum, MD
- County
- Prince Georges County · 919,866 people
- Metro
- Washington-Arlington-Alexandria, DC-VA-MD-WV
- Population (ZIP)
- 50,333
- Household income
- $86,737
- Rent vs Own
- Severe rent burden
- 2222.0
Population outlook (Prince George's County) Hauer SSP2
- Today (2025)
- 1,005,426 people
- By 2030
- 1,048,416 · +4.3%
- By 2040
- 1,123,425 · +11.7%
- By 2050
- 1,183,220 · +17.7%
- By 2075
- 1,306,202 · +29.9%
- By 2100
- 1,408,179 · +40.1%
Race, ethnicity, and origin ACS 2023
- Neighborhood character
- Predominantly Hispanic (68%)
- Race & ethnicity
- Hispanic / Latino 68% Black 22% Two or more races 9% White 5% Asian 3%
- Hispanic origin (detail)
- Mexican 2% Dominican 2%
- Common ancestry
- Hispanic 1%
- Foreign-born
- 60% · Canada, Jamaica, United Kingdom
- Languages at home
- 21% English-only · Spanish 66% French/Haitian/Cajun 5% Other Indo-European 1%
Political lean MEDSL · Prince George's
- 2024 margin
- Solid D (+75.2) · D 86.3% · R 11.2% · Other 2.5%
- 2008→2024 swing
- -3.3pp toward R · 2008: 78.5pp · 2024: 75.2pp
- All cycles
- 2024: D+75.2 2020: D+80.5 2016: D+81.0 2012: D+80.9 2008: D+78.5
Not yet ingested
- Civics
- —
Market trends
- HPI YoY
- ▼ -269.12%
- Current HPI
- 313.7836
- Rent YoY
- ▲ 1.73%
- Metro
- Washington-Arlington-Alexandria, DC-VA-MD-WV
- State GDP YoY
- ▲ 2.97%
- F500 in state
- 12
Industry mix (Fortune 500 HQ in MD)
| Industry | F500 HQs | Revenue |
|---|---|---|
| Aerospace / Defense | 1 | $71B |
|
||
| Utilities | 1 | $25B |
|
||
| Hotels | 1 | $24B |
|
||
| Consumer Goods | 1 | $7B |
|
||
| Real Estate | 1 | $6B |
|
||
| Chemicals | 1 | $2B |
|
||
Price history
+1462.5% since first listed6 events — show timeline
- 2026-05-19 Coming Soon $375,000 BRIGHT MLS
- 1998-06-15 Sold (Public Records) $137,500 Public Records
- 1998-05-27 Sold (MLS) $137,500 MRIS
- 1998-04-22 Delisted — MRIS
- 1998-01-07 Listed $134,000 MRIS
- 1970-06-16 Sold (Public Records) $24,000 Public Records
Property tax history
+7.2%/yrLatest (2025): $5,737 · +2.8% YoY. Source: county tax records.
Cash-flow waterfall
monthlySold comps — $/sqft
last 12 mo · ≤1 miLoading sold comps…