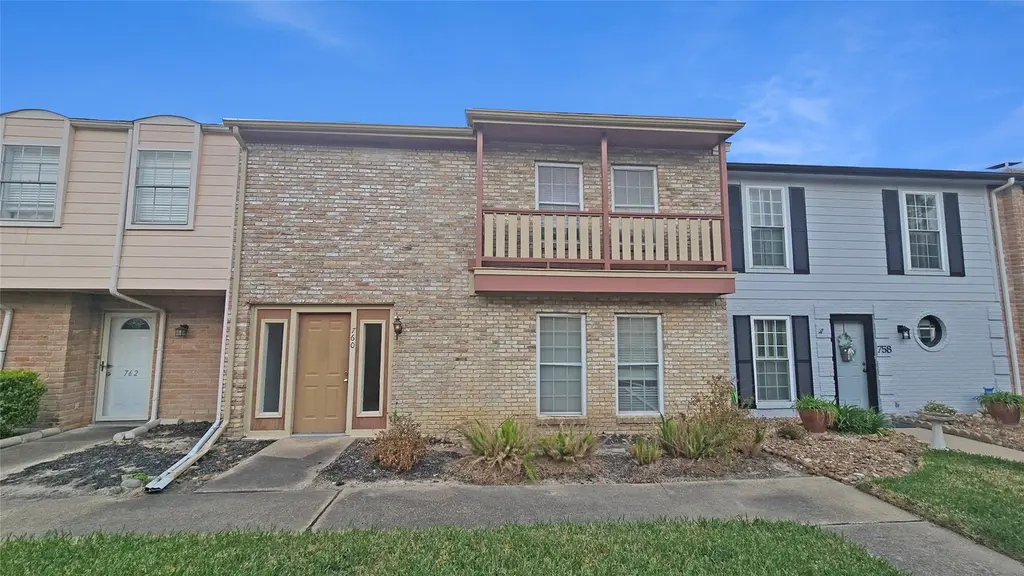
760 Thicket Ln #760 · Houston, TX
Flood risk 1/10 · Minimal
- FEMA flood zone
- X (unshaded)
- Chance of flooding over 30 yrs
- 0.0%
- Est. flood insurance / yr
- $507 – $1,088
Fire risk 1/10 · Minimal
- Est. fire insurance / yr
- $1,222 – $2,270
Heat risk 9/10 · Severe
- Hot days now (above 111°F)
- 7 days/yr
- Hot days in 30 yrs
- 24 days/yr
Wind risk 9/10 · Severe
- Chance of severe wind over 30 yrs
- 99.0%
Air-quality risk 3/10 · Minor
- Unhealthy air days now
- 2 days/yr
- Unhealthy air days in 30 yrs
- 3 days/yr
Risk factors via First Street. Map © Google.
Why this score? — see what drove the B+ grade
The composite is a weighted blend of 9 inputs, each scored 0–100. Each bar is that input's sub-score; the figure is the points it added to the 100-point composite (weight × sub-score).
- Cash flow +30.0/30.0
- ARV discount +15.0/15.0
- 1% rule +10.0/10.0
- DSCR +10.0/10.0
- Schools +4.1/10.0
- Livability +3.7/5.0
- Condition / age +2.8/5.0
- Rent growth +2.3/5.0
- Appreciation +0.0/10.0
$159,900
🖨 Deal sheet 📄 Offer letter ✓ Due diligence
Listing remarks MLS
One of the largest townhome property! Tucked into the tree-lined community of Memorial Club, 760 Thicket Ln offers a comfortable blend of space, character, and location. The living area features generous proportions and great natural light, creating an inviting space for relaxing or entertaining. The kitchen provides ample cabinetry and workspace, opening to the dining area for easy everyday living. Upstairs, well-sized bedrooms offer privacy and flexibility, while the private patio provides a quiet outdoor retreat. Residents enjoy mature landscaping, community amenities, and a prime Memorial-area location with quick access to City Centre, Energy Corridor employers, shopping, dining, and major thoroughfares.
Key facts
- $400 HOA
- Built 1973
- Listed 74 days
Neighborhood map
What this means for you Summary
Snapshot
- This is a 4-bed/3.0-bath townhouse listed at $160k. Condition is rated average.
Deal economics
- At list price, monthly cash flow is $600 ($7k/yr) — positive.
- The deal already cash-flows at list — no discount required.
- Meets the 1% rule at list price ($3k rent vs $160k).
- Recommended offer: $150k (6.0% below list) — sets the bar for market timing.
- Cap rate 10.8% vs local median 3.2% in Houston — top-decile yield for the area; either an underpriced asset or a hidden risk that comps aren't pricing in. Stress-test before assuming the spread holds.
Location & tenants
- Location reads 74/100 on livability (#184 in TX, #4,771 nationally) — a middle-class / working-renter tenant base. Strengths: amenities A+, cost of living A+, housing A+; Watch: schools D, crime F.
- Spring Branch ISD (urban): math 47% / reading 46% proficiency, ranked #215 of 826 in TX (top 26%) — families likely to look elsewhere, expect single-tenant / working-renter base with shorter leases.
- Market conditions: Rents soft (-0.8%/yr); 235 active listings in the ZIP; 20 comparable units currently listed for rent nearby; rentals leasing fast (median 10d on market — plan ~1-2 weeks tenant-placement turnaround); solid renter incomes; 29,883 units permitted in Harris County in 2024 (8,621 in 5+ unit buildings).
- This rent runs 31% of the median local income ($102k/yr) — at the standard rent-burdened threshold; future hikes will face affordability resistance.
Forward outlook
- Local home prices are declining (-3.0%/yr); year-one equity from $1k of loan paydown is wiped out by about $5k of value loss. Plan a longer hold.
- Harris County population projected at +47% by 2050 — long-run rental-demand tailwind backs the buy-and-hold thesis.
Negotiation context
- It's been on market 74 days — a 6% lower offer ($150k) is reasonable based on typical stale-listing flexibility.
Risks & watch-outs
- Climate carrying-cost: severe wind risk, 99% chance of damaging wind over 30y; extreme-heat days projected 7→24/yr by 2055 (HVAC capex compounding) — expect insurance premiums to compound above CPI over the hold.
Questions for the listing agent
- It's been on market 74 days. Have you received any prior offers? Is the seller open to a 6% concession, seller financing, or rate buy-down credit?
- Built in 1973 — when were the roof, HVAC, electrical panel, plumbing, and water heater last replaced?
- What does the HOA fee cover, when was the last increase, and are there any pending special assessments or reserve-fund shortfalls?
- Why hasn't it sold? Are there any deal-killer items the seller is aware of (foundation, flood, title, zoning, code violations)?
- Is there a deadline driving the sale (1031 exchange, divorce, estate, relocation)? That informs how much negotiation room exists.
- Schools are D-rated, which usually means shorter tenancies and higher turnover. Who's the typical renter profile here, and what's been the actual vacancy rate?
- Crime grade is F in this area — have there been break-ins, vandalism, or insurance claims at this property in the last 3 years? What carrier currently insures it and at what premium?
- What's the average days-on-market for RENTAL listings here right now (not sales)? A rising rental-DOM trend means longer vacancies and softer asking-rent achievability than the comps imply.
- What's the recent tenant-quality profile in this submarket — average credit score on applications, eviction rate, late-payment / NSF rate, and stable-employment percentage? A property-management company in the area should have these aggregated.
- How much new for-sale + rental construction is in the pipeline within 1–3 miles? Heavy new supply typically softens prices + rents 12–24 months out; constrained supply supports both.
Investment metrics
- 1% rule
- 1.67% ✓
- Cap rate
- 10.79%
- Cash-on-cash
- 16.08%
- DSCR
- 1.72
- GRM
- 5.0
CMA / ARV
- ARV (median comp)
- $226,888
- List price
- $159,900
- Delta
- -29.52%
- Verdict
- UNDERPRICED
- Comps
- 20 within 1.0 mi
Show comp detail 12 sales within ~0.75 mi
| Address | Dist | Beds/Ba | Sqft | Sold | Price | $/sf | Match |
|---|---|---|---|---|---|---|---|
| 14690 Perthshire Rd Unit C | 0.08mi | 3/2.5 (-1) | 1,978 (-7%) | 1mo | $225,000 | $114 | 78 |
| 14706 Perthshire Rd Unit G | 0.09mi | 3/2.5 (-1) | 1,978 (-7%) | 0mo | $239,500 | $121 | 78 |
| 14704 Perthshire Rd Unit E | 0.07mi | 3/2.5 (-1) | 1,978 (-7%) | 4mo | $270,000 | $137 | 75 |
| 15137 Kimberley Ct | 0.52mi | 4/3.0 | 2,152 (+2%) | 1mo | $330,000 | $153 | 72 |
| 14524 Misty Meadow Ln | 0.68mi | 4/3.0 | 2,103 (-1%) | 7mo | $299,900 | $143 | 61 |
| 15159 Kimberley Ct #38 | 0.58mi | 3/2.5 (-1) | 2,092 (-1%) | 4mo | $319,000 | $152 | 61 |
| 15004 Kimberley Ct | 0.43mi | 3/2.5 (-1) | 1,956 (-8%) | 6mo | $335,000 | $171 | 55 |
| 1147 Country Place Dr | 0.70mi | 3/2.5 (-1) | 1,992 (-6%) | 1mo | $270,000 | $136 | 50 |
| 781 Country Place Dr #2016 | 0.51mi | 3/2.5 (-1) | 1,864 (-12%) | 3mo | $99,900 | $54 | 46 |
| 800 Country Place Dr #1204 | 0.67mi | 3/2.5 (-1) | 1,951 (-8%) | 3mo | $270,000 | $138 | 46 |
| 14506 Misty Meadow Ln | 0.70mi | 3/2.5 (-1) | 1,886 (-11%) | 1mo | $225,000 | $119 | 42 |
| 880 Tully Rd #81 | 0.56mi | 3/2.5 (-1) | 1,830 (-14%) | 4mo | $250,000 | $137 | 40 |
Match score weights: distance 35% · size 25% · config 20% · recency 20%. Top-matched comps best support the ARV.
Projected returns pro-forma
-3.0% appreciation · 0.0% rent growth · sell at horizon
- IRR
- 2.9%
- Equity multiple
- 1.11×
- Total profit
- $4,768
- Equity at exit
- $23,842
- IRR
- 8.5%
- Equity multiple
- 1.54×
- Total profit
- $24,328
- Equity at exit
- $13,825
Cash invested: $44,772 (down + closing). Projections, not guarantees.
Landlord ↔ Tenant lean methodology
- Overall (STATE)
- 87 Strongly Landlord-Friendly
- State Texas
- 87 Strongly Landlord-Friendly · R+5
- County
- — inherits STATE
- City
- — inherits STATE
ZIP-level market 77079
- Rents YoY
- -0.8%
- Active inventory
- 235
- Price-to-rent
- 5.0×
Monthly cashflow live
- Estimated rent
- $2,664 high interval (Pro) →
- Mortgage (P&I)
- −$839
- Tax est. 1.5%
- −$200 /mo · $2,398/yr
- Insurance
- −$67
- HOA
- −$400
- Vacancy / Maint / Mgmt
- −$560
- Net cashflow
- $600
Break-even live
UW: 25.0% down · 7.5% · 30yr · 1.5% tax · 5.0% vac · 8.0% maint · 8.0% mgmt
Financing live
Cash to close
- Down payment
- $39,975
- Closing costs
- $4,797
- Reserves months
- —
- Total cash needed
- —
Loan-product check · same deal, 3 products live
Conventional
25% down · 7.5% · 30yr
- Down + closing
- —
- Monthly P&I
- —
- Monthly cashflow
- —
- DSCR
- —
- Eligible?
- —
Personal DTI + credit; lowest rate.
DSCR
20% down · 8.5% · 30yr
- Down + closing
- —
- Monthly P&I
- —
- Monthly cashflow
- —
- DSCR
- —
- Eligible?
- —
No personal income docs; deal must DSCR.
Hard money
10% down · 12.0% · 12mo
- Down + closing
- —
- Monthly P&I
- —
- Monthly cashflow
- —
- DSCR
- —
- Eligible?
- —
Short-term bridge; refi at stabilization.
Rent comps 20 comps
| Address | Beds | Baths | Sqft | Rent | $/sqft | DOM | Units | Dist |
|---|---|---|---|---|---|---|---|---|
| 14800 Memorial Dr Houston, TX | 1.0–3.0 | 1.5–3.0 | 1371 | $3,885 | $2.83 | 1d | 14 | 0.16mi |
| 14800 Memorial Dr Houston, TX | 1.0–3.0 | 1.5–3.0 | 1368 | $3,966 | $2.90 | 10d | 21 | 0.16mi |
| 14806 Memorial Dr Houston, TX | 3.0 | 3.0 | 1565 | $2,750 | $1.76 | 43d | 1 | 0.21mi |
| 14814 Perthshire Rd Houston, TX | 2.0–4.0 | 1.0–2.5 | 1381 | $2,245 | $1.63 | 1d | 81 | 0.22mi |
| 681 Dairy Ashford Rd Houston, TX | 3.0 | 2.0 | 1492 | $1,886 | $1.26 | 43d | 1 | 0.28mi |
| 681 Dairy Ashford Rd Houston, TX | 3.0 | 2.0 | 1492 | $1,886 | $1.26 | 21d | 1 | 0.28mi |
| 781 Country Place Dr Houston, TX | 2.0–3.0 | 2.0–2.5 | 2264 | $1,800 | $0.80 | 4d | 6 | 0.51mi |
| 770 N Eldridge Pkwy Houston, TX | 1.0–3.0 | 1.0–2.0 | 1099 | $2,544 | $2.31 | 1d | 19 | 0.53mi |
| 15100 Turkey Creek Dr Houston, TX | 3.0 | 2.0 | 1766 | $2,648 | $1.50 | 24d | 1 | 0.70mi |
| 881 N Eldridge Pkwy Houston, TX | 3.0 | 3.0 | 1766 | $2,483 | $1.41 | 43d | 1 | 0.77mi |
| 881 N Eldridge Pkwy Houston, TX | 3.0 | 3.0 | 1766 | $2,483 | $1.41 | 20d | 1 | 0.77mi |
| 1305 Country Place Dr Houston, TX | 3.0 | 2.5 | 1886 | $1,550 | $0.82 | 43d | 1 | 0.77mi |
| 875 N Eldridge Pkwy Houston, TX | 1.0–3.0 | 1.0–2.5 | 1197 | $2,688 | $2.25 | 1d | 29 | 0.78mi |
| 15206 Memorial Dr Houston, TX | 3.0 | 2.0 | 1772 | $2,718 | $1.53 | 43d | 1 | 0.92mi |
| 15206 Memorial Dr Houston, TX | 3.0 | 2.0 | 1772 | $2,718 | $1.53 | 21d | 1 | 0.92mi |
| 12658 Briar Patch Rd Houston, TX | 4.0 | 3.0 | 2405 | $2,500 | $1.04 | 7d | 1 | 0.94mi |
| 777 S Mayde Creek Dr Houston, TX | 3.0 | 1.0–2.5 | 1279 | $3,011 | $2.35 | 1d | 20 | 1.00mi |
| 1333 Eldridge Pkwy Houston, TX | 1.0–3.0 | 1.0–2.0 | 1033 | $1,805 | $1.75 | 1d | 32 | 1.25mi |
| 1415 Eldridge Pkwy Houston, TX | 1.0–3.0 | 1.0–2.0 | 1109 | $2,278 | $2.05 | 1d | 62 | 1.40mi |
| 550 Westlake Park Blvd Houston, TX | 3.0 | 1.0–2.0 | 1143 | $4,745 | $4.15 | 1d | 45 | 1.41mi |
HOA detail
- Monthly dues
- $400 · $4,800/yr
- Likely covers
- landscaping
Listing history 13 events
-
2026-06-15statusdays on market $159,900 Pending 74 DOM
-
2026-06-13pricedays on market $159,900 Active 73 DOM
-
2026-06-09days on market $193,135 Active 69 DOM
-
2026-06-08days on market $193,135 Active 68 DOM
-
2026-06-07days on market $193,135 Active 67 DOM
-
2026-06-04days on market $193,135 Active 64 DOM
-
2026-06-03days on market $193,135 Active 63 DOM
-
2026-06-02days on market $193,135 Active 62 DOM
-
2026-06-01days on market $193,135 Active 61 DOM
-
2026-05-31days on market $193,135 Active 60 DOM
-
2026-05-07price $203,300 717-char remark
Show marketing remark (717 chars)
One of the largest townhome property! Tucked into the tree-lined community of Memorial Club, 760 Thicket Ln offers a comfortable blend of space, character, and location. The living area features generous proportions and great natural light, creating an inviting space for relaxing or entertaining. The kitchen provides ample cabinetry and workspace, opening to the dining area for easy everyday living. Upstairs, well-sized bedrooms offer privacy and flexibility, while the private patio provides a quiet outdoor retreat. Residents enjoy mature landscaping, community amenities, and a prime Memorial-area location with quick access to City Centre, Energy Corridor employers, shopping, dining, and major thoroughfares.
-
2026-04-15price $214,000 717-char remark
Show marketing remark (717 chars)
One of the largest townhome property! Tucked into the tree-lined community of Memorial Club, 760 Thicket Ln offers a comfortable blend of space, character, and location. The living area features generous proportions and great natural light, creating an inviting space for relaxing or entertaining. The kitchen provides ample cabinetry and workspace, opening to the dining area for easy everyday living. Upstairs, well-sized bedrooms offer privacy and flexibility, while the private patio provides a quiet outdoor retreat. Residents enjoy mature landscaping, community amenities, and a prime Memorial-area location with quick access to City Centre, Energy Corridor employers, shopping, dining, and major thoroughfares.
-
2026-04-01$225,000 Active 717-char remark
Show marketing remark (717 chars)
One of the largest townhome property! Tucked into the tree-lined community of Memorial Club, 760 Thicket Ln offers a comfortable blend of space, character, and location. The living area features generous proportions and great natural light, creating an inviting space for relaxing or entertaining. The kitchen provides ample cabinetry and workspace, opening to the dining area for easy everyday living. Upstairs, well-sized bedrooms offer privacy and flexibility, while the private patio provides a quiet outdoor retreat. Residents enjoy mature landscaping, community amenities, and a prime Memorial-area location with quick access to City Centre, Energy Corridor employers, shopping, dining, and major thoroughfares.
ⓘ Source: listings_history table (triggers on properties + properties_extension) + one-shot
backfill from property_details.listing_events for pre-trigger history.
Climate risk First Street
- Flood 1/10 Low FEMA zone X (unshaded) · 0% chance over 30 yrs
- Wildfire 1/10 Low
- Heat 9/10 Extreme 7 d/yr ≥111°F today · 24 d/yr by 30 yrs out
- Wind 9/10 Extreme 99% chance of damaging wind over 30 yrs
- Air quality 3/10 Moderate 2 unhealthy d/yr today · 3 by 30 yrs out
Nearby sold comps map
Loading sold comps map…
Walkable amenities ~0.75 mi
Loading nearby amenities…
Taxation est. · year 1
- Rental income
- $31,972
- − Mortgage interest
- −$8,957
- − Property taxes
- −$2,398
- − Insurance
- −$800
- − Repairs & maintenance
- −$2,558
- − Management
- −$2,558
- − HOA
- −$4,800
- − Depreciation
- −$4,652
- Taxable income
- $5,250
- Est. tax owed @ 24.0%
- −$1,260
- After-tax cash flow
- $5,937/yr
For passive investors: Depreciation is non-cash, so a rental often shows a tax loss while cash-flowing — sheltering income. Rental losses are passive: they offset passive income freely, and up to $25,000/yr can offset ordinary (W-2) income if you actively participate and your MAGI is under $100k (phasing out to $0 by $150k); unused losses carry forward. On sale, claimed depreciation is recaptured at up to 25%, and gains may owe capital-gains tax (a 1031 exchange can defer both). Figures are a year-1 estimate at your 24.0% rate — not tax advice; consult a CPA.
Condition & rehab AI · 12 photos
This townhome requires moderate repairs and maintenance to improve its condition and value. Upgrades to the exterior, interior, and landscaping would significantly enhance its curb appeal and marketability.
Repairs flagged
- Minor Kitchen cabinets — Worn appearance
- Minor Bathtub and shower — Dated appearance
- Moderate Exterior paint — Paint appears chipped
- Moderate Hardwood floors — Worn appearance
- Moderate Interior paint — Chipped in some areas
- Moderate Landscaping — Could be improved
Value-add opportunities
- Resale Paint exterior — Fresh paint enhances curb appeal
- Resale Refinish hardwood floors — Updated flooring improves aesthetics
- Resale Paint interior — Updated paint enhances curb appeal
- Both Landscaping — Improved landscaping enhances curb appeal and adds value
- Resale Replace kitchen cabinets — Modern cabinets improve aesthetics and functionality
- Resale Replace bathtub and shower — Modern fixtures improve aesthetics and functionality
Renovation cost estimate screening
| Repair item | Severity | Est. cost |
|---|---|---|
| Kitchen cabinets · Worn appearance | Minor | $500–3,000 |
| Bathtub and shower · Dated appearance | Minor | $500–3,000 |
| Exterior paint · Paint appears chipped | Moderate | $3,000–15,000 |
| Hardwood floors · Worn appearance | Moderate | $3,000–15,000 |
| Interior paint · Chipped in some areas | Moderate | $3,000–15,000 |
| Landscaping · Could be improved | Moderate | $3,000–15,000 |
| Total estimated repair cost · 6 items | $13,000–66,000 |
Value-add ROI direction
- Resale Paint exterior — Fresh paint enhances curb appeal ↑
- Resale Refinish hardwood floors — Updated flooring improves aesthetics ↑
- Resale Paint interior — Updated paint enhances curb appeal ↑
- Both Landscaping — Improved landscaping enhances curb appeal and adds value ↑
- Resale Replace kitchen cabinets — Modern cabinets improve aesthetics and functionality ↑
- Resale Replace bathtub and shower — Modern fixtures improve aesthetics and functionality ↑
ⓘ Cost ranges are severity-bucket heuristics (US national rule-of-thumb). Get contractor quotes + a written scope before underwriting a rehab budget.
Schools (NCES district)
- District
- Spring Branch ISD
- NCES district ID
- 4841100
- Math proficiency
- 47% ▼ -4.00%
- Reading proficiency
- 46% ▼ -1.00%
- Median HH income
- $60,311
- Composite
- 40.88/100
- National rank
- #3624
- State rank
- #215 of 826 in TX
Livability — Houston
- Score
- 74/100
- State rank
- #184
- US rank
- #4771
Category grades
Schools grade is shown separately in the Schools card above.
Census & demographics
- Census place
- Houston, TX
- County
- Harris County · 4,702,590 people
- City population
- 3,226,434
- Metro
- Houston-The Woodlands-Sugar Land, TX
- Population (ZIP)
- 37,276
- Household income
- $101,995
- Rent vs Own
- Severe rent burden
- 1811.0
Population outlook (Harris County) Hauer SSP2
- Today (2025)
- 5,571,493 people
- By 2030
- 6,089,821 · +9.3%
- By 2040
- 7,142,806 · +28.2%
- By 2050
- 8,185,864 · +46.9%
- By 2075
- 10,574,329 · +89.8%
- By 2100
- 12,109,958 · +117.4%
Race, ethnicity, and origin ACS 2023
- Neighborhood character
- Diverse neighborhood (Simpson 0.64)
- Race & ethnicity
- White 55% Hispanic / Latino 20% Two or more races 15% Black 13% Asian 8%
- Hispanic origin (detail)
- Mexican 10% Cuban 1%
- Common ancestry
- Lithuanian 4% Slovak 2% Italian 2%
- Foreign-born
- 25% · Canada, Jamaica, China
- Languages at home
- 69% English-only · Spanish 15% Other Indo-European 5% Chinese 2%
Political lean MEDSL · Harris
- 2024 margin
- Lean D (+5.5) · D 52.0% · R 46.4% · Other 1.6%
- 2008→2024 swing
- +3.9pp toward D · 2008: 1.6pp · 2024: 5.5pp
- All cycles
- 2024: D+5.5 2020: D+13.3 2016: D+12.4 2012: D+0.1 2008: D+1.6
Not yet ingested
- Civics
- —
Market trends
- HPI YoY
- ▼ -316.55%
- Current HPI
- 286.7958
- Rent YoY
- ▼ -0.80%
- Metro
- Houston-The Woodlands-Sugar Land, TX
- State GDP YoY
- ▲ 3.95%
- F500 in state
- 110
Industry mix (Fortune 500 HQ in TX)
| Industry | F500 HQs | Revenue |
|---|---|---|
| Energy | 16 | $1,198B |
|
||
| Technology | 5 | $198B |
|
||
| Engineering / Construction | 4 | $72B |
|
||
| Energy Services | 3 | $60B |
|
||
| Utilities | 3 | $41B |
|
||
| Healthcare | 2 | $330B |
|
||
Price history
-9.6% since first listed3 events — show timeline
- 2026-05-07 Price Changed $203,300 HARMLS
- 2026-04-15 Price Changed $214,000 HARMLS
- 2026-04-01 Listed $225,000 HARMLS
Cash-flow waterfall
monthlySold comps — $/sqft
last 12 mo · ≤1 miLoading sold comps…