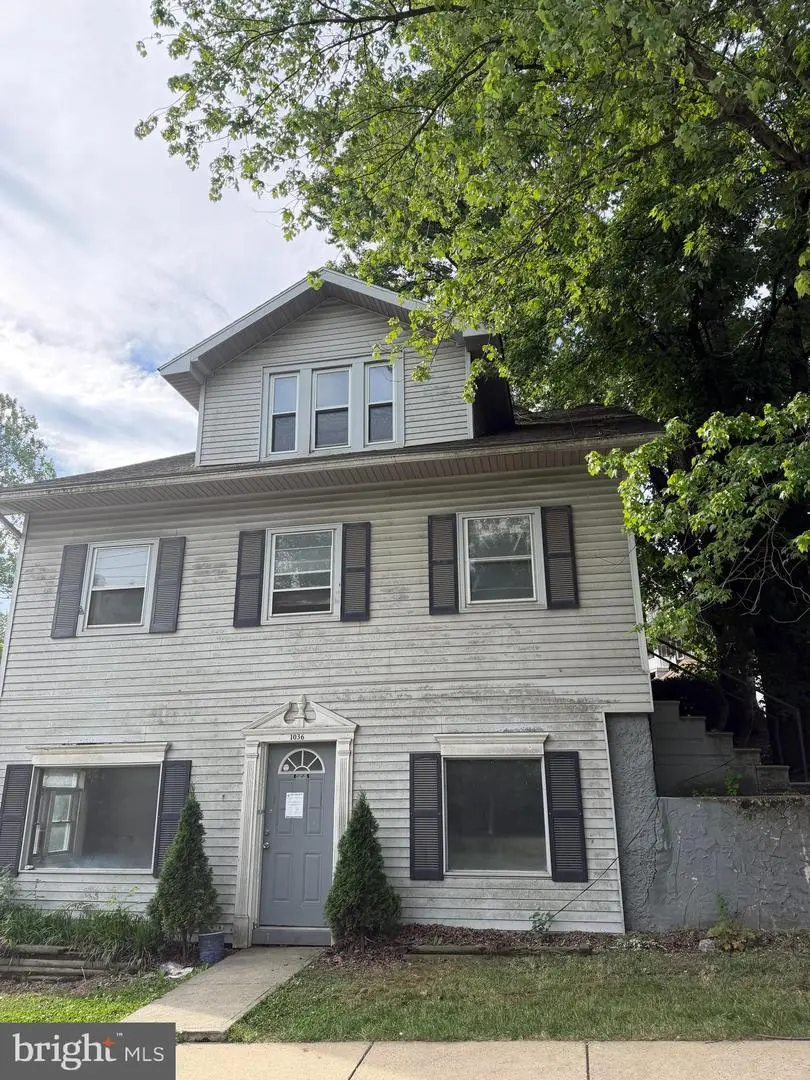
1036 Haycreek Rd · Birdsboro, PA
Flood risk 8/10 · Major
- FEMA flood zone
- X (unshaded)
- Chance of flooding over 30 yrs
- 0.99%
- Est. flood insurance / yr
- $507 – $1,088
Fire risk 4/10 · Minor
- Est. fire insurance / yr
- $511 – $949
Heat risk 5/10 · Moderate
- Hot days now (above 98°F)
- 8 days/yr
- Hot days in 30 yrs
- 17 days/yr
Wind risk 4/10 · Minor
- Chance of severe wind over 30 yrs
- 20.0%
Air-quality risk 2/10 · Minimal
- Unhealthy air days now
- 1 days/yr
- Unhealthy air days in 30 yrs
- 3 days/yr
Risk factors via First Street. Map © Google.
Why this score? — see what drove the C+ grade
The composite is a weighted blend of 9 inputs, each scored 0–100. Each bar is that input's sub-score; the figure is the points it added to the 100-point composite (weight × sub-score).
- Cash flow +26.5/30.0
- DSCR +9.0/10.0
- ARV discount +7.5/15.0
- 1% rule +7.2/10.0
- Schools +4.1/10.0
- Livability +3.7/5.0
- Rent growth +2.5/5.0
- Condition / age +2.5/5.0
- Appreciation +0.0/10.0
$179,900
🖨 Deal sheet 📄 Offer letter ✓ Due diligence
Listing remarks MLS
Great Opportunity Updated Birdsboro Single. The heart of the Home incorporates a Large Living Room, leading to a spacious Dining Room and updated Kitchen, warm and comfortable best describes this part of the home. There is also a Full Bath on the Main floor as an added convenience. Large Deck of the main floor Mud Room offers a wonderful outdoor space for entertaining. Three private bedrooms and a full bath occupy the Upper floor. The Lower Level boost a large Family Room, Full Bath and Laundry Area. Outside the Lower Level offers an entrance from the Oversized 1 car garage and 3 car parking. Steps from the front door is wonderful park with a pavilion for those family get togethers. This home has updated mechanicals and has lots of space. Seller is motivated, call for showing time to schedule a tour.
Key facts
- Outdoor deck areas
- Finished basement
- Roomy eat-in kitchen
Tags
Property features AI
Finance
- Other: Fee simple ownership; Not in a federal flood zone
Exterior
- Parking: Detached oversized garage (1 space); Asphalt driveway; One total garage/parking space
- Utilities: Public water; Public sewer; Cable TV available
- Home design: Detached single-family home; Pitched shingle roof; Above-grade living areas
- Construction: Aluminum and vinyl siding; Concrete perimeter foundation; Built (year estimated)
- Exterior features: Corner lot; Sidewalks; Deck(s)
Interior
- Kitchen: Eat-in kitchen
- Bedrooms: Three bedrooms on the upper level
- Flooring: Wood flooring; Vinyl flooring
- Bathrooms: Three full bathrooms (one on main level, one on upper level, one on lower level)
- Heating & cooling: Hot water heating (natural gas); Wall-unit cooling; 200+ amp electric service; Electric hot water
- Interior features: Ceiling fans; Stall shower; Eat-in kitchen; Full finished basement with outside entrance
- Laundry & utility: Laundry on lower floor
Neighborhood map
What this means for you Summary
Snapshot
- This is a 3-bed/2.0-bath single-family listed at $180k.
Deal economics
- At list price, monthly cash flow is $408 ($5k/yr) — positive.
- The deal already cash-flows at list — no discount required.
- Meets the 1% rule at list price ($2k rent vs $180k).
Location & tenants
- Location reads 73/100 on livability (#551 in PA) — a middle-class / working-renter tenant base. Strengths: crime A+, cost of living A+, housing A+; Watch: amenities F, commute F, health & safety F.
- Daniel Boone Area SD (suburban): math 38% / reading 52% proficiency, ranked #217 of 539 in PA (top 40%) — families likely to look elsewhere, expect single-tenant / working-renter base with shorter leases; only 18% free/reduced lunch — higher-income household profile.
- Zoned schools: Daniel Boone Area Hs (math 67% / reading 75%, grade B+, #41 of 437 statewide, top 10%, 1,037 students, 35% FRL) — zoned schools average 35% FRL vs 18% district-wide (17 pts higher); higher-poverty schools than district average — tighter screening recommended.
- Zoned-school proficiency averages 71% at this address vs 45% district-wide (+26 pts) — the actual schools serving this property are materially stronger than the Daniel Boone Area SD average implies; a family-tenant draw the district grade alone would hide.
- Market conditions: 83 active listings in the ZIP; 1 comparable units currently listed for rent nearby; 258 units permitted in Berks County in 2024 (27 in 5+ unit buildings).
Forward outlook
- Local home prices are declining (-3.0%/yr); year-one equity from $1k of loan paydown is wiped out by about $5k of value loss. Plan a longer hold.
- Berks County population projected at +3% by 2050 — modest demand growth; plan on rents tracking national, not racing it.
Negotiation context
- Only 6 days on market — expect competitive offers; lowballing is unlikely to land.
- 8 sale attempts since 14y ago with the ask held roughly flat each time — persistent listings suggest the price (not the market) is what's stuck; bring a comps-based counter.
Risks & watch-outs
- Watch-outs: flood insurance adds $66/mo; built in 1889 — expect roof / HVAC / electrical / plumbing capex.
- Climate carrying-cost: severe flood risk; extreme-heat days projected 8→17/yr by 2055 (HVAC capex compounding) — expect insurance premiums to compound above CPI over the hold.
Questions for the listing agent
- Built in 1889 — when were the roof, HVAC, electrical panel, plumbing, and water heater last replaced?
- What's the actual annual flood-insurance premium (NFIP or private), and is the property in a SFHA with mandatory coverage?
- Is there a deadline driving the sale (1031 exchange, divorce, estate, relocation)? That informs how much negotiation room exists.
- Schools are B-rated — typically a magnet for longer-tenancy family renters. What's the average tenant stay here, and is there a school-zone premium baked into asking?
- What's the average days-on-market for RENTAL listings here right now (not sales)? A rising rental-DOM trend means longer vacancies and softer asking-rent achievability than the comps imply.
- What's the recent tenant-quality profile in this submarket — average credit score on applications, eviction rate, late-payment / NSF rate, and stable-employment percentage? A property-management company in the area should have these aggregated.
- How much new for-sale + rental construction is in the pipeline within 1–3 miles? Heavy new supply typically softens prices + rents 12–24 months out; constrained supply supports both.
Investment metrics
- 1% rule
- 1.22% ✓
- Cap rate
- 9.46%
- Cash-on-cash
- 11.29%
- DSCR
- 1.50
- GRM
- 6.8
CMA / ARV
- ARV (on-the-fly)
- $383,955
- Comps found
- 12
Show comp detail 12 sales within ~0.75 mi
| Address | Dist | Beds/Ba | Sqft | Sold | Price | $/sf | Match |
|---|---|---|---|---|---|---|---|
| 821 Colonial Dr | 0.25mi | 3/2.0 | 2,240 (+4%) | 2mo | $375,000 | $167 | 79 |
| 914 Denise Dr | 0.31mi | 4/2.0 (+1) | 2,083 (-3%) | 18mo | $378,000 | $181 | 60 |
| 509 E 9th St | 0.44mi | 3/2.5 | 2,044 (-5%) | 14mo | $350,750 | $172 | 58 |
| 600 E 4th St | 0.57mi | 4/2.0 (+1) | 2,232 (+4%) | 10mo | $365,000 | $164 | 54 |
| 704 E 9th St | 0.59mi | 4/2.5 (+1) | 2,232 (+4%) | 7mo | $390,000 | $175 | 53 |
| 62 Caitlin Dr | 0.68mi | 3/2.5 | 2,000 (-7%) | 3mo | $410,000 | $205 | 53 |
| 120 Hook St | 0.66mi | 3/2.5 | 1,986 (-7%) | 11mo | $330,000 | $166 | 46 |
| 411 E 5th St | 0.45mi | 3/2.0 | 1,832 (-15%) | 13mo | $371,000 | $203 | 44 |
| 712 Pearl St | 0.59mi | 4/2.5 (+1) | 1,848 (-14%) | 2mo | $420,000 | $227 | 41 |
| 516 Garfield Ave | 0.60mi | 4/2.0 (+1) | 1,928 (-10%) | 13mo | $345,000 | $179 | 40 |
| 500 Garfield Ave | 0.65mi | 3/2.5 | 1,850 (-14%) | 12mo | $380,000 | $205 | 35 |
| 411 E 1st St | 0.67mi | 4/1.5 (+1) | 2,412 (+12%) | 14mo | $299,900 | $124 | 29 |
Match score weights: distance 35% · size 25% · config 20% · recency 20%. Top-matched comps best support the ARV.
Projected returns pro-forma
-3.0% appreciation · 3.0% rent growth · sell at horizon
- IRR
- -1.6%
- Equity multiple
- 0.94×
- Total profit
- $-3,101
- Equity at exit
- $26,824
- IRR
- 8.1%
- Equity multiple
- 1.62×
- Total profit
- $31,085
- Equity at exit
- $15,554
Cash invested: $50,372 (down + closing). Projections, not guarantees.
Landlord ↔ Tenant lean methodology
- Overall (STATE)
- 62 Landlord-Friendly
- State Pennsylvania
- 62 Landlord-Friendly · EVEN
- County
- — inherits STATE
- City
- — inherits STATE
ZIP-level market 19508
- Home prices YoY
- -25.6%
- Active inventory
- 83
- Price-to-rent
- 6.8×
Monthly cashflow live
- Estimated rent
- $2,200 medium interval (Pro) →
- Mortgage (P&I)
- −$943
- Tax from tax record
- −$246 /mo · $2,946/yr
- Insurance
- −$75
- Flood insurance flood zone
- −$66 /mo · $798/yr
- HOA
- −$0
- Vacancy / Maint / Mgmt
- −$462
- Net cashflow
- $408
Break-even live
UW: 25.0% down · 7.5% · 30yr · 1.5% tax · 5.0% vac · 8.0% maint · 8.0% mgmt
Financing live
Cash to close
- Down payment
- $44,975
- Closing costs
- $5,397
- Reserves months
- —
- Total cash needed
- —
Loan-product check · same deal, 3 products live
Conventional
25% down · 7.5% · 30yr
- Down + closing
- —
- Monthly P&I
- —
- Monthly cashflow
- —
- DSCR
- —
- Eligible?
- —
Personal DTI + credit; lowest rate.
DSCR
20% down · 8.5% · 30yr
- Down + closing
- —
- Monthly P&I
- —
- Monthly cashflow
- —
- DSCR
- —
- Eligible?
- —
No personal income docs; deal must DSCR.
Hard money
10% down · 12.0% · 12mo
- Down + closing
- —
- Monthly P&I
- —
- Monthly cashflow
- —
- DSCR
- —
- Eligible?
- —
Short-term bridge; refi at stabilization.
Rent comps 1 comps
| Address | Beds | Baths | Sqft | Rent | $/sqft | DOM | Units | Dist |
|---|---|---|---|---|---|---|---|---|
| 1226 Haycreek Rd Birdsboro, PA | 4.0 | 2.0 | 1650 | $2,200 | $1.33 | 13d | 1 | 0.14mi |
Listing history 6 events
-
2026-06-18days on market $179,900 Active 6 DOM
-
2026-06-17days on market $179,900 Active 5 DOM
-
2026-06-16days on market $179,900 Active 4 DOM
-
2026-06-15days on market $179,900 Active 3 DOM
-
2026-06-13remarks 545-char remark
-
2026-06-13$179,900 Active 1 DOM
ⓘ Source: listings_history table (triggers on properties + properties_extension) + one-shot
backfill from property_details.listing_events for pre-trigger history.
Tax reassessment forecast PA · Partial reset (capped growth)
- Current annual tax
- $2,946 · $246/mo
- Projected year-2 tax
- $2,946 · $246/mo
- Expected delta
- $0/yr ($0/mo · 0.0%)
ⓘ Screening estimate from a state-policy table — verify with the county assessor before closing.
Climate risk First Street
- Flood 8/10 Severe FEMA zone X (unshaded) · 99% chance over 30 yrs
- Wildfire 4/10 Moderate
- Heat 5/10 Major 8 d/yr ≥98°F today · 17 d/yr by 30 yrs out
- Wind 4/10 Moderate 20% chance of damaging wind over 30 yrs
- Air quality 2/10 Low 1 unhealthy d/yr today · 3 by 30 yrs out
Nearby sold comps map
Loading sold comps map…
Walkable amenities ~0.75 mi
Loading nearby amenities…
Taxation est. · year 1
- Rental income
- $26,400
- − Mortgage interest
- −$10,077
- − Property taxes
- −$2,946
- − Insurance
- −$1,697
- − Repairs & maintenance
- −$2,112
- − Management
- −$2,112
- − Depreciation
- −$5,233
- Taxable income
- $2,222
- Est. tax owed @ 24.0%
- −$533
- After-tax cash flow
- $4,359/yr
For passive investors: Depreciation is non-cash, so a rental often shows a tax loss while cash-flowing — sheltering income. Rental losses are passive: they offset passive income freely, and up to $25,000/yr can offset ordinary (W-2) income if you actively participate and your MAGI is under $100k (phasing out to $0 by $150k); unused losses carry forward. On sale, claimed depreciation is recaptured at up to 25%, and gains may owe capital-gains tax (a 1031 exchange can defer both). Figures are a year-1 estimate at your 24.0% rate — not tax advice; consult a CPA.
Schools (NCES district)
- District
- Daniel Boone Area SD
- NCES district ID
- 4207290
- Math proficiency
- 38% ▼ -9.00%
- Reading proficiency
- 52% ▼ -14.00%
- Median HH income
- $75,511
- Composite
- 41.03/100
- National rank
- #3584
- State rank
- #217 of 539 in PA
Livability — Birdsboro
- Score
- 73/100
- State rank
- #551
- US rank
- #5134
Category grades
Schools grade is shown separately in the Schools card above.
Census & demographics
- Census place
- Birdsboro, PA
- Population (ZIP)
- 15,066
Population outlook (Berks County) Hauer SSP2
- Today (2025)
- 425,767 people
- By 2030
- 428,814 · +0.7%
- By 2040
- 433,463 · +1.8%
- By 2050
- 439,426 · +3.2%
- By 2075
- 478,647 · +12.4%
- By 2100
- 518,507 · +21.8%
Race, ethnicity, and origin ACS 2023
- Neighborhood character
- Predominantly White (90%)
- Race & ethnicity
- White 90% Two or more races 6% Hispanic / Latino 3% Black 1%
- Common ancestry
- Romanian 6% Iranian 3% Lithuanian 2%
- Foreign-born
- 1% · Canada
- Languages at home
- 98% English-only · Spanish 1% Other Indo-European 1%
Political lean MEDSL · Berks
- 2024 margin
- R (+12.2) · D 43.4% · R 55.6%
- 2008→2024 swing
- -21.4pp toward R · 2008: 9.2pp · 2024: -12.2pp
- All cycles
- 2024: R+12.2 2020: R+8.2 2016: R+10.2 2012: R+0.6 2008: D+9.2
Not yet ingested
- Civics
- —
Market trends
- HPI YoY
- ▼ -94.00%
- Current HPI
- 273.8199
- Rent YoY
- —
- Metro
- —
- State GDP YoY
- ▲ 1.68%
- F500 in state
- 34
Industry mix (Fortune 500 HQ in PA)
| Industry | F500 HQs | Revenue |
|---|---|---|
| Healthcare | 2 | $309B |
|
||
| Insurance | 2 | $27B |
|
||
| Telecommunications / Media | 1 | $124B |
|
||
| Industrial Distribution | 1 | $22B |
|
||
| Financial Services | 1 | $20B |
|
||
| Chemicals / Materials | 1 | $18B |
|
||
Price history
+227.1% since first listed24 events — show timeline
- 2026-06-12 Listed $179,900 BRIGHT MLS
- 2018-06-28 Sold (Public Records) $174,900 Public Records
- 2018-06-22 Sold (MLS) $174,900 BRIGHT MLS
- 2018-06-22 Sold (MLS) $174,900 TREND
- 2018-06-01 Pending — BRIGHT MLS
- 2018-06-01 Pending — TREND
- 2018-04-19 Relisted — BRIGHT MLS
- 2018-04-19 Relisted — TREND
- 2018-04-14 Pending — BRIGHT MLS
- 2018-04-14 Pending — TREND
- 2018-03-28 Listed $174,900 BRIGHT MLS
- 2018-03-28 Listed $174,900 TREND
- 2012-12-20 Sold (MLS) $55,000 BRIGHT MLS
- 2012-12-20 Sold (MLS) $55,000 TREND
- 2012-11-26 Pending — TREND
- 2012-11-26 Listing Removed — BRIGHT MLS
- 2012-11-26 Listing Removed — BRIGHT MLS
- 2012-11-23 Price Changed $55,000 TREND
- 2012-11-14 Price Changed $65,000 TREND
- 2012-10-12 Price Changed $75,000 TREND
- 2012-09-10 Price Changed $88,000 TREND
- 2012-07-31 Listed $100,000 TREND
- 2012-07-31 Listed $55,000 BRIGHT MLS
- 2012-07-31 Listed $55,000 BRIGHT MLS
Property tax history
-0.1%/yrLatest (2026): $2,946 · +0.3% YoY. Source: county tax records.
Cash-flow waterfall
monthlySold comps — $/sqft
last 12 mo · ≤1 miLoading sold comps…