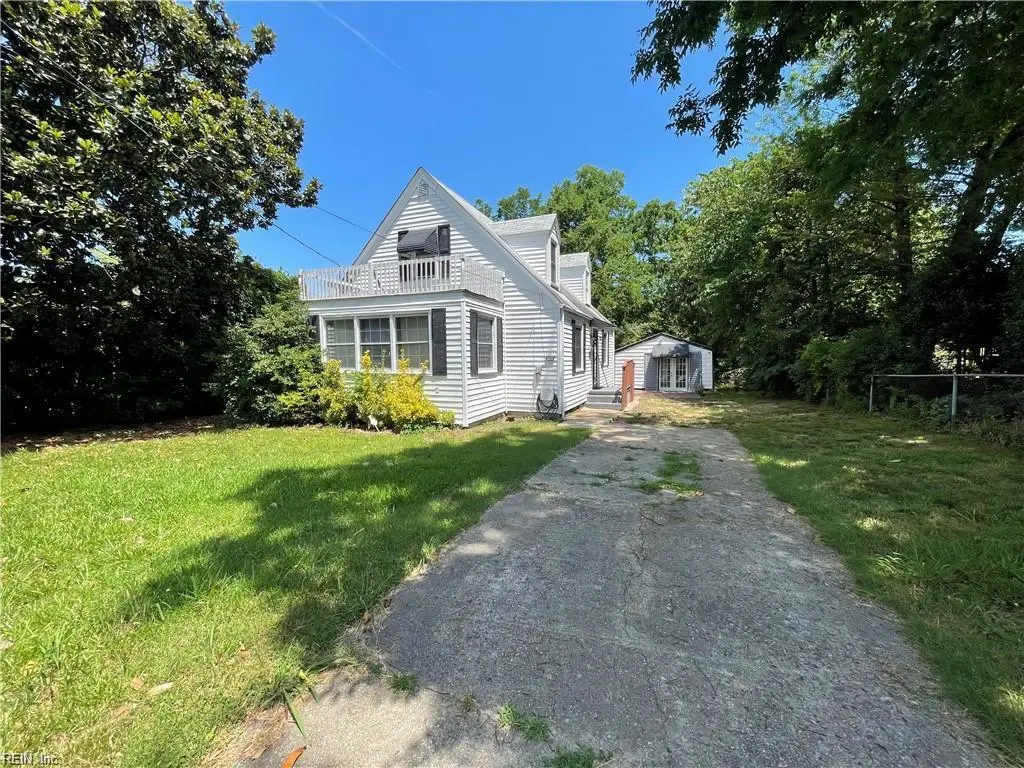
1716 Blair Ave · Norfolk, VA
Flood risk 7/10 · Major
- FEMA flood zone
- AE
- Chance of flooding over 30 yrs
- 0.94%
- Est. flood insurance / yr
- $1,737 – $8,500
Fire risk 1/10 · Minimal
- Est. fire insurance / yr
- $666 – $1,236
Heat risk 9/10 · Severe
- Hot days now (above 106°F)
- 7 days/yr
- Hot days in 30 yrs
- 16 days/yr
Wind risk 8/10 · Major
- Chance of severe wind over 30 yrs
- 80.0%
Air-quality risk 3/10 · Minor
- Unhealthy air days now
- 2 days/yr
- Unhealthy air days in 30 yrs
- 5 days/yr
Risk factors via First Street. Map © Google.
Why this score? — see what drove the D+ grade
The composite is a weighted blend of 9 inputs, each scored 0–100. Each bar is that input's sub-score; the figure is the points it added to the 100-point composite (weight × sub-score).
- ARV discount +14.3/15.0
- Cash flow +10.8/30.0
- Rent growth +5.0/5.0
- Livability +4.2/5.0
- Schools +3.5/10.0
- DSCR +3.1/10.0
- 1% rule +2.9/10.0
- Appreciation +2.9/10.0
- Condition / age +2.5/5.0
$293,000
🖨 Deal sheet 📄 Offer letter ✓ Due diligence
Listing remarks
4-bedroom Cape Cod featuring a detached garage and a cozy sunroom. This home is filled with potential. Each spacious bedroom invites natural light. Bring your creativity to add your personal touch. Located in a neighborhood with easy access to schools, parks, and shopping. Schedule your appointment today!
Key facts
- Cozy sunroom
- Detached garage
- Easy access to parks
Tags
Property features AI
Finance
- HOA & community: No HOA
Exterior
- Parking: Two parking spaces; Driveway spaces; On-street parking available; Multi-car parking
- Utilities: City/County water; City/County sewer; Electric water heater; Natural gas available
- Home design: Detached single-family Cape Cod; Two stories; Two living levels; Simple ownership
- Construction: Asphalt shingle roof; Crawl foundation
- Exterior features: Vinyl siding; Chain link fence
Interior
- Kitchen: Electric range; Microwave; Refrigerator; Dishwasher
- Bedrooms: Master bedroom (includes bath); First-floor master bedroom; Bedroom with full bathroom on first floor; Additional bedroom
- Flooring: Ceramic; Wood
- Bathrooms: Two full bathrooms
- Heating & cooling: Forced hot air heating (natural gas); Central air conditioning
- Interior features: Ceramic and wood flooring; Assigned storage; Sun room; Breakfast area
- Laundry & utility: Washer hookup; Dryer hookup; Utility room
Neighborhood map
What this means for you Summary
Snapshot
- This is a 4-bed/2.0-bath single-family listed at $293k.
Deal economics
- At list price, monthly cash flow is $-559 ($-7k/yr) — negative.
- To cash-flow at today's rent, offer at most $194k (33.7% below list).
- To meet the 1% rule (rent ≥ 1% of price), the offer needs to be $233k (20.6% below list).
- Recommended offer: $194k (33.7% below list) — sets the bar for cash-flow.
- Cap rate 5.7% vs local median 4.0% in Norfolk — top-decile yield for the area; either an underpriced asset or a hidden risk that comps aren't pricing in. Stress-test before assuming the spread holds.
Location & tenants
- Location reads 83/100 on livability (#43 in VA, #1,026 nationally) — a professional / high-income tenant draw. Strengths: amenities A+, commute A+, health & safety A+; Watch: employment C-, crime F.
- Norfolk City Public School District (urban): math 27% / reading 56% proficiency, ranked #118 of 131 in VA (top 90%) — families likely to look elsewhere, expect single-tenant / working-renter base with shorter leases.
- Zoned schools: Lindenwood Elementary (math 8% / reading 32%, grade F, #1,082 of 1,108 statewide, top 98%, 262 students, 98% FRL); Matthew Fontaine Maury High (math 46% / reading 90%, grade B, #180 of 319 statewide, top 57%, 1,697 students, 96% FRL) — zoned schools average 97% FRL vs 59% district-wide (38 pts higher); higher-poverty schools than district average — tighter screening recommended.
- Market conditions: Rents rising fast (+14.0%/yr); 77 active listings in the ZIP; 40 comparable units currently listed for rent nearby; rentals at typical pace (median 24d on market — plan ~3-4 weeks tenant-placement turnaround); 45% of comp listings sitting > 30 days — soft ceiling on asking rent; 438 units permitted in Norfolk city in 2024 (273 in 5+ unit buildings).
- This rent runs 38% of the median local income ($73k/yr) — at the standard rent-burdened threshold; future hikes will face affordability resistance.
Forward outlook
- Local home prices are declining (-3.0%/yr); year-one equity from $2k of loan paydown is wiped out by about $9k of value loss. Plan a longer hold.
Negotiation context
- It's been on market 43 days — a 3% lower offer ($284k) is reasonable based on typical stale-listing flexibility.
- 9 sale attempts since 7y ago with the ask held roughly flat each time — persistent listings suggest the price (not the market) is what's stuck; bring a comps-based counter.
Risks & watch-outs
- Watch-outs: flood insurance adds $427/mo; built in 1942 — expect roof / HVAC / electrical / plumbing capex.
- Climate carrying-cost: in FEMA flood zone AE (mandatory federal flood insurance); severe wind risk, 80% chance of damaging wind over 30y; extreme-heat days projected 7→16/yr by 2055 (HVAC capex compounding) — expect insurance premiums to compound above CPI over the hold.
Questions for the listing agent
- What do current leases actually rent for vs. the listed asking? Can we see a recent rent roll and the last 12 months of T-12 income?
- It's been on market 43 days. Have you received any prior offers? Is the seller open to a 34% concession, seller financing, or rate buy-down credit?
- Built in 1942 — when were the roof, HVAC, electrical panel, plumbing, and water heater last replaced?
- What's the actual annual flood-insurance premium (NFIP or private), and is the property in a SFHA with mandatory coverage?
- Is there a deadline driving the sale (1031 exchange, divorce, estate, relocation)? That informs how much negotiation room exists.
- Schools are A-rated — typically a magnet for longer-tenancy family renters. What's the average tenant stay here, and is there a school-zone premium baked into asking?
- Crime grade is F in this area — have there been break-ins, vandalism, or insurance claims at this property in the last 3 years? What carrier currently insures it and at what premium?
- The area grade is low — what's the realistic commute time and amenity access for the typical tenant pool here? Any planned neighborhood developments (good or bad) we should know about?
- What's the average days-on-market for RENTAL listings here right now (not sales)? A rising rental-DOM trend means longer vacancies and softer asking-rent achievability than the comps imply.
- What's the recent tenant-quality profile in this submarket — average credit score on applications, eviction rate, late-payment / NSF rate, and stable-employment percentage? A property-management company in the area should have these aggregated.
- How much new for-sale + rental construction is in the pipeline within 1–3 miles? Heavy new supply typically softens prices + rents 12–24 months out; constrained supply supports both.
Investment metrics
- 1% rule
- 0.79% ✗
- Cap rate
- 5.75%
- Cash-on-cash
- -1.94%
- DSCR
- 0.91
- GRM
- 10.5
CMA / ARV
- ARV (median comp)
- $345,500
- List price
- $293,000
- Delta
- -15.20%
- Verdict
- UNDERPRICED
- Comps
- 20 within 1.0 mi
Show comp detail 12 sales within ~0.75 mi
| Address | Dist | Beds/Ba | Sqft | Sold | Price | $/sf | Match |
|---|---|---|---|---|---|---|---|
| 3022 Lorraine Ave | 0.20mi | 4/2.0 | 1,667 (+7%) | 1mo | $425,000 | $255 | 78 |
| 3020 Vimy Ridge Ave | 0.34mi | 4/2.5 | 1,450 (-7%) | 2mo | $317,000 | $219 | 70 |
| 3018 Lorraine Ave | 0.19mi | 5/2.0 (+1) | 1,709 (+10%) | 0mo | $325,000 | $190 | 69 |
| 2629 Bapaume Ave | 0.42mi | 3/2.0 (-1) | 1,500 (-4%) | 2mo | $320,000 | $213 | 68 |
| 3109 Saint Mihiel Ave | 0.52mi | 3/1.5 (-1) | 1,571 (+1%) | 2mo | $290,750 | $185 | 65 |
| 1750 Hancock Ave | 0.15mi | 3/2.0 (-1) | 1,334 (-14%) | 1mo | $360,000 | $270 | 63 |
| 2701 Vimy Ridge Ave | 0.32mi | 3/2.0 (-1) | 1,400 (-10%) | 1mo | $310,000 | $221 | 62 |
| 1891 Barre St | 0.65mi | 4/3.0 | 1,520 (-2%) | 1mo | $325,000 | $214 | 61 |
| 912 Lindenwood Ave | 0.47mi | 3/2.5 (-1) | 1,628 (+5%) | 2mo | $301,500 | $185 | 61 |
| 822 Pollard St | 0.58mi | 3/2.0 (-1) | 1,494 (-4%) | 0mo | $290,600 | $195 | 61 |
| 3217 Verdun Ave | 0.73mi | 3/2.0 (-1) | 1,584 (+2%) | 1mo | $313,500 | $198 | 57 |
| 2721 Argonne Ave | 0.52mi | 3/2.5 (-1) | 1,680 (+8%) | 1mo | $365,000 | $217 | 54 |
Match score weights: distance 35% · size 25% · config 20% · recency 20%. Top-matched comps best support the ARV.
Projected returns pro-forma
-3.0% appreciation · 8.0% rent growth · sell at horizon
- IRR
- -24.0%
- Equity multiple
- 0.14×
- Total profit
- $-70,538
- Equity at exit
- $43,687
- IRR
- -7.8%
- Equity multiple
- 0.39×
- Total profit
- $-50,237
- Equity at exit
- $25,333
Cash invested: $82,040 (down + closing). Projections, not guarantees.
Landlord ↔ Tenant lean methodology
- Overall (STATE)
- 55 Moderately Landlord-Leaning
- State Virginia
- 55 Moderately Landlord-Leaning · D+2
- County
- — inherits STATE
- City
- — inherits STATE
ZIP-level market 23509
- Home prices YoY
- -1.3%
- Rents YoY
- 14.0%
- Active inventory
- 77
- Price-to-rent
- 10.5×
Monthly cashflow live
- Estimated rent
- $2,328 high interval (Pro) →
- Mortgage (P&I)
- −$1,537
- Tax from tax record
- −$313 /mo · $3,755/yr
- Insurance
- −$122
- Flood insurance flood zone
- −$427 /mo · $5,118/yr
- HOA
- −$0
- Vacancy / Maint / Mgmt
- −$489
- Net cashflow
- $-559
Break-even live
UW: 25.0% down · 7.5% · 30yr · 1.5% tax · 5.0% vac · 8.0% maint · 8.0% mgmt
Financing live
Cash to close
- Down payment
- $73,250
- Closing costs
- $8,790
- Reserves months
- —
- Total cash needed
- —
Loan-product check · same deal, 3 products live
Conventional
25% down · 7.5% · 30yr
- Down + closing
- —
- Monthly P&I
- —
- Monthly cashflow
- —
- DSCR
- —
- Eligible?
- —
Personal DTI + credit; lowest rate.
DSCR
20% down · 8.5% · 30yr
- Down + closing
- —
- Monthly P&I
- —
- Monthly cashflow
- —
- DSCR
- —
- Eligible?
- —
No personal income docs; deal must DSCR.
Hard money
10% down · 12.0% · 12mo
- Down + closing
- —
- Monthly P&I
- —
- Monthly cashflow
- —
- DSCR
- —
- Eligible?
- —
Short-term bridge; refi at stabilization.
Rent comps 40 comps
| Address | Beds | Baths | Sqft | Rent | $/sqft | DOM | Units | Dist |
|---|---|---|---|---|---|---|---|---|
| 1801 Saint Denis Ave Unit 3 Norfolk, VA | 4.0 | 2.0 | 1500 | $2,400 | $1.60 | 23d | 1 | 0.13mi |
| 1714 Bellevue Ave Norfolk, VA | 3.0 | 1.5 | 1500 | $1,799 | $1.20 | 43d | 1 | 0.24mi |
| 2729 Somme Ave Norfolk, VA | 3.0 | 2.5 | 1524 | $2,295 | $1.51 | 14d | 1 | 0.25mi |
| 1801 Lasalle Ave Norfolk, VA | 3.0 | 1.0 | 1102 | $1,880 | $1.71 | 44d | 1 | 0.36mi |
| 1751 Fontainebleau Cres Norfolk, VA | 3.0 | 2.0 | 1231 | $2,350 | $1.91 | 43d | 1 | 0.40mi |
| 2914 Peronne Ave Norfolk, VA | 4.0 | 2.0 | 1764 | $2,495 | $1.41 | 23d | 1 | 0.42mi |
| 2529 Tidewater Dr Norfolk, VA | 3.0 | 2.5 | 2025 | $2,370 | $1.17 | 23d | 1 | 0.44mi |
| 2605 Bapaume Ave Norfolk, VA | 3.0 | 2.0 | 2004 | $2,295 | $1.15 | 43d | 1 | 0.46mi |
| 3301 Vimy Ridge Ave Norfolk, VA | 4.0 | 2.0 | 1300 | $2,150 | $1.65 | 4d | 1 | 0.53mi |
| 2201 Pershing Ave Norfolk, VA | 3.0 | 2.5 | 1455 | $2,250 | $1.55 | 4d | 1 | 0.55mi |
| 881 Rugby St Norfolk, VA | 3.0 | 2.0 | 1600 | $2,650 | $1.66 | 23d | 1 | 0.58mi |
| 907 Rugby St Norfolk, VA | 3.0 | 2.0 | 1515 | $2,200 | $1.45 | 43d | 1 | 0.58mi |
| 2660 Chesapeake Blvd Norfolk, VA | 3.0 | 2.0 | 1375 | $2,100 | $1.53 | 17d | 1 | 0.64mi |
| 3414 Tidewater Dr Norfolk, VA | 4.0 | 2.5 | 2200 | $3,000 | $1.36 | 43d | 1 | 0.69mi |
| 3126 Marne Ave Norfolk, VA | 5.0 | 2.0 | 1943 | $3,000 | $1.54 | 43d | 1 | 0.72mi |
| 2815 Keller Ave Norfolk, VA | 3.0 | 2.0 | 1210 | $2,250 | $1.86 | 4d | 1 | 0.76mi |
| 764 B Ave Norfolk, VA | 3.0 | 2.5 | 1380 | $1,795 | $1.30 | 20d | 1 | 0.82mi |
| 3521 Brest Ave Norfolk, VA | 3.0 | 2.0 | 1234 | $2,300 | $1.86 | 43d | 1 | 0.84mi |
| 766 A Ave Norfolk, VA | 5.0 | 2.0 | 1544 | $1,400 | $0.91 | 43d | 1 | 0.84mi |
| 830 Lexington St Norfolk, VA | 3.0 | 2.5 | 1804 | $1,950 | $1.08 | 43d | 1 | 0.89mi |
| 4010 Holly Ave Unit 2 Norfolk, VA | 3.0 | 1.0 | 1400 | $1,700 | $1.21 | 43d | 1 | 0.91mi |
| 1449 Proescher St Norfolk, VA | 3.0 | 1.5 | 1400 | $1,550 | $1.11 | 23d | 1 | 0.92mi |
| 3805 Granby St Unit D Norfolk, VA | 3.0 | 2.5 | 1911 | $2,500 | $1.31 | 23d | 1 | 0.92mi |
| 2531 Vincent Ave Norfolk, VA | 3.0 | 2.0 | 1600 | $2,195 | $1.37 | 43d | 1 | 0.99mi |
| 325 W 31st St Unit 6 Norfolk, VA | 3.0 | 1.0 | 1400 | $1,750 | $1.25 | 23d | 1 | 1.04mi |
| 400 W 30th St Norfolk, VA | 3.0 | 1.5 | 1120 | $1,985 | $1.77 | 43d | 1 | 1.07mi |
| 410 W 29th St Norfolk, VA | 4.0 | 2.0 | 2001 | $2,500 | $1.25 | 14d | 1 | 1.11mi |
| 407 Pennsylvania Ave Norfolk, VA | 4.0 | 2.5 | 2200 | $3,200 | $1.45 | 43d | 1 | 1.12mi |
| 1403 Lead St Norfolk, VA | 4.0 | 2.5 | 1854 | $2,550 | $1.38 | 43d | 1 | 1.12mi |
| 426 W 28th St Norfolk, VA | 3.0 | 3.0 | 2034 | $2,850 | $1.40 | 17d | 1 | 1.16mi |
| 3640 Robin Hood Rd Norfolk, VA | 4.0 | 2.5 | 1400 | $2,999 | $2.14 | 17d | 1 | 1.16mi |
| 417 W 27th St Unit F Norfolk, VA | 3.0 | 2.0 | 1200 | $1,600 | $1.33 | 14d | 1 | 1.16mi |
| 417 W 27th St Unit F Norfolk, VA | 3.0 | 2.0 | 1200 | $1,600 | $1.33 | 21d | 1 | 1.16mi |
| 3653 Nottaway St Norfolk, VA | 3.0 | 1.5 | 1564 | $2,200 | $1.41 | 17d | 1 | 1.25mi |
| 3504 Chesapeake Blvd Norfolk, VA | 3.0 | 2.0 | 1624 | $1,995 | $1.23 | 23d | 1 | 1.26mi |
| 3504 Chesapeake Blvd Norfolk, VA | 3.0 | 2.0 | 1624 | $1,995 | $1.23 | 43d | 1 | 1.26mi |
| 527 Maryland Ave Norfolk, VA | 3.0 | 1.0 | 1200 | $2,000 | $1.67 | 43d | 1 | 1.28mi |
| 3541 Chesapeake Blvd Norfolk, VA | 5.0 | 1.0 | 1476 | $1,275 | $0.86 | 7d | 1 | 1.30mi |
| 630 W 36th St Norfolk, VA | 4.0 | 1.5 | 1650 | $2,200 | $1.33 | 23d | 1 | 1.37mi |
| 4511 Newport Ave Unit 4511 -A Norfolk, VA | 4.0 | 3.0 | 2068 | $2,600 | $1.26 | 43d | 1 | 1.39mi |
Listing history 37 events
-
2026-06-18days on market $293,000 Active 43 DOM
-
2026-06-17days on market $293,000 Active 42 DOM
-
2026-06-16days on market $293,000 Active 41 DOM
-
2026-06-15days on market $293,000 Active 40 DOM
-
2026-06-13days on market $293,000 Active 38 DOM
-
2026-06-09days on market $293,000 Active 34 DOM
-
2026-06-08days on market $293,000 Active 33 DOM
-
2026-06-07days on market $293,000 Active 32 DOM
-
2026-06-03days on market $293,000 Active 28 DOM
-
2026-06-02days on market $293,000 Active 27 DOM
-
2026-06-01days on market $293,000 Active 26 DOM
-
2026-05-31days on market $293,000 Active 25 DOM
-
2026-05-06$293,000 Active 307-char remark
-
2025-12-31historical
-
2025-09-01historical $850
-
2025-08-29$300,000 Active
-
2025-04-17$850
-
2025-02-02historical $2,200
-
2024-10-18historical
-
2024-09-19$2,200
-
2024-06-21$300,000 Active
-
2024-03-12historical $2,400
-
2024-02-28$2,400
-
2022-01-03soldstatus $260,000
-
2021-12-31historical
-
2021-09-29status Under Contract
-
2021-09-17historical Active Under Contract
-
2021-09-13price $250,000
-
2021-09-03$259,999 Active
-
2019-12-06soldstatus $205,000
-
2019-11-11status Under Contract
-
2019-11-04historical Active Under Contract
-
2019-08-22status Active
-
2019-08-02historical Active Under Contract
-
2019-07-15$209,900 Active
-
2008-08-20soldstatus $199,900
-
1998-05-12soldstatus $78,900
ⓘ Source: listings_history table (triggers on properties + properties_extension) + one-shot
backfill from property_details.listing_events for pre-trigger history.
Tax reassessment forecast VA · Resets to sale price
- Current annual tax
- $3,755 · $313/mo
- Projected year-2 tax
- $3,755 · $313/mo
- Expected delta
- $0/yr ($0/mo · 0.0%)
ⓘ Screening estimate from a state-policy table — verify with the county assessor before closing.
Climate risk First Street
- Flood 7/10 Severe FEMA zone AE · 94% chance over 30 yrs
- Wildfire 1/10 Low
- Heat 9/10 Extreme 7 d/yr ≥106°F today · 16 d/yr by 30 yrs out
- Wind 8/10 Severe 80% chance of damaging wind over 30 yrs
- Air quality 3/10 Moderate 2 unhealthy d/yr today · 5 by 30 yrs out
Nearby sold comps map
Loading sold comps map…
Walkable amenities ~0.75 mi
Loading nearby amenities…
Taxation est. · year 1
- Rental income
- $27,930
- − Mortgage interest
- −$16,413
- − Property taxes
- −$3,755
- − Insurance
- −$6,584
- − Repairs & maintenance
- −$2,234
- − Management
- −$2,234
- − Depreciation
- −$8,524
- Taxable loss
- −$11,813
- Est. tax savings @ 24.0%
- +$2,835
- After-tax cash flow
- $-3,877/yr
For passive investors: Depreciation is non-cash, so a rental often shows a tax loss while cash-flowing — sheltering income. Rental losses are passive: they offset passive income freely, and up to $25,000/yr can offset ordinary (W-2) income if you actively participate and your MAGI is under $100k (phasing out to $0 by $150k); unused losses carry forward. On sale, claimed depreciation is recaptured at up to 25%, and gains may owe capital-gains tax (a 1031 exchange can defer both). Figures are a year-1 estimate at your 24.0% rate — not tax advice; consult a CPA.
Schools (NCES district)
- District
- Norfolk City Public School District
- NCES district ID
- 5102670
- Math proficiency
- 27% ▼ -44.00%
- Reading proficiency
- 56% ▼ -10.00%
- Median HH income
- $44,358
- Composite
- 35.08/100
- National rank
- #5026
- State rank
- #118 of 131 in VA
Livability — Norfolk
- Score
- 83/100
- State rank
- #43
- US rank
- #1026
Category grades
Schools grade is shown separately in the Schools card above.
Census & demographics
- Census place
- Norfolk, VA
- County
- Norfolk City · 214,042 people
- City population
- 214,042
- Metro
- Virginia Beach-Norfolk-Newport News, VA-NC
- Population (ZIP)
- 13,105
- Household income
- $72,816
- Rent vs Own
- Severe rent burden
- 575.0
Population outlook (Norfolk County) Hauer SSP2
- Today (2025)
- 249,032 people
- By 2030
- 252,347 · +1.3%
- By 2040
- 253,644 · +1.9%
- By 2050
- 251,913 · +1.2%
- By 2075
- 245,281 · -1.5%
- By 2100
- 219,548 · -11.8%
Race, ethnicity, and origin ACS 2023
- Neighborhood character
- Diverse neighborhood (Simpson 0.64)
- Race & ethnicity
- White 44% Black 39% Hispanic / Latino 9% Two or more races 8% Asian 2%
- Hispanic origin (detail)
- Mexican 2% Puerto Rican 2%
- Common ancestry
- Italian 4% Serbian 2% Romanian 1%
- Foreign-born
- 6% · Canada, China
- Languages at home
- 91% English-only · Spanish 5% Other Asian/Pacific 1%
Political lean MEDSL · Norfolk
- 2024 margin
- Solid D (+41.5) · D 70.0% · R 28.5% · Other 1.6%
- 2008→2024 swing
- -1.4pp toward R · 2008: 43.0pp · 2024: 41.5pp
- All cycles
- 2024: D+41.5 2020: D+45.6 2016: D+42.0 2012: D+44.0 2008: D+43.0
Not yet ingested
- Civics
- —
Market trends
- HPI YoY
- ▼ -4.16%
- Current HPI
- 321.56
- Rent YoY
- ▲ 13.99%
- Metro
- Virginia Beach-Norfolk-Newport News, VA-NC
- State GDP YoY
- ▲ 2.40%
- F500 in state
- 50
Industry mix (Fortune 500 HQ in VA)
| Industry | F500 HQs | Revenue |
|---|---|---|
| Aerospace / Defense | 4 | $236B |
|
||
| Technology / Defense | 3 | $32B |
|
||
| Financial Services | 2 | $176B |
|
||
| Utilities | 2 | $27B |
|
||
| Insurance | 2 | $25B |
|
||
| Technology | 2 | $15B |
|
||
Price history
+271.4% since first listed25 events — show timeline
- 2026-05-06 Listed $293,000 REINMLS
- 2025-12-31 Listing Removed — REINMLS
- 2025-09-01 Rental Removed $850 REINMLS
- 2025-08-29 Listed $300,000 REINMLS
- 2025-04-17 Listed for Rent $850 REINMLS
- 2025-02-02 Rental Removed $2,200 REINMLS
- 2024-10-18 Listing Removed — REINMLS
- 2024-09-19 Listed for Rent $2,200 REINMLS
- 2024-06-21 Listed $300,000 REINMLS
- 2024-03-12 Rental Removed $2,400 TURBOTENANT
- 2024-02-28 Listed for Rent $2,400 TURBOTENANT
- 2022-01-03 Sold (Public Records) $260,000 Public Records
- 2021-12-31 Listing Removed — REINMLS
- 2021-09-29 Pending — REINMLS
- 2021-09-17 Contingent — REINMLS
- 2021-09-13 Price Changed $250,000 REINMLS
- 2021-09-03 Listed $259,999 REINMLS
- 2019-12-06 Sold (Public Records) $205,000 Public Records
- 2019-11-11 Pending — REINMLS
- 2019-11-04 Contingent — REINMLS
- 2019-08-22 Relisted — REINMLS
- 2019-08-02 Contingent — REINMLS
- 2019-07-15 Listed $209,900 REINMLS
- 2008-08-20 Sold (Public Records) $199,900 Public Records
- 1998-05-12 Sold (Public Records) $78,900 Public Records
Property tax history
+5.4%/yrLatest (2025): $3,755 · +9.5% YoY. Source: county tax records.
Cash-flow waterfall
monthlySold comps — $/sqft
last 12 mo · ≤1 miLoading sold comps…