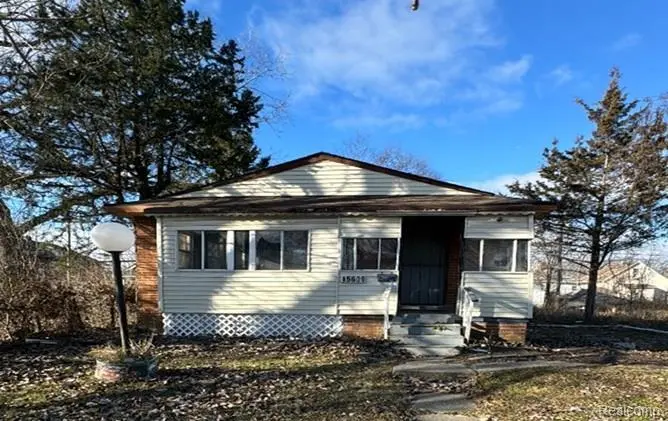
15509 Rosa Parks Blvd · Detroit, MI
Flood risk 3/10 · Minor
- FEMA flood zone
- X (unshaded)
- Chance of flooding over 30 yrs
- 0.2%
- Est. flood insurance / yr
- $473 – $860
Fire risk 1/10 · Minimal
- Est. fire insurance / yr
- $784 – $1,456
Heat risk 3/10 · Minor
- Hot days now (above 97°F)
- 7 days/yr
- Hot days in 30 yrs
- 14 days/yr
Wind risk 2/10 · Minimal
- Chance of severe wind over 30 yrs
- —
Air-quality risk 4/10 · Minor
- Unhealthy air days now
- 4 days/yr
- Unhealthy air days in 30 yrs
- 6 days/yr
Risk factors via First Street. Map © Google.
Why this score? — see what drove the B- grade
The composite is a weighted blend of 9 inputs, each scored 0–100. Each bar is that input's sub-score; the figure is the points it added to the 100-point composite (weight × sub-score).
- Cash flow +30.0/30.0
- 1% rule +10.0/10.0
- DSCR +10.0/10.0
- ARV discount +7.5/15.0
- Rent growth +4.0/5.0
- Livability +3.7/5.0
- Condition / age +2.5/5.0
- Schools +1.3/10.0
- Appreciation +0.0/10.0
$71,900
🖨 Deal sheet (PDF) 📄 Offer letter ✓ Due diligence
Listing remarks MLS
TENANT OCCUPIED RANCH HOME LOCATED NORTH OF FENKELL AND WEST OF HAMILTON AVENUE. THIS HOME FEATURES SPACIOUS LIVING ROOM, EAT IN KITCHEN, THREE BEDROOMS, ONE BATHROOM, AND AN UNFINISHED BASEMENT. THE TENANT IS IN A LEASE UNTIL 8/26/26, AND THE MONTHLY RENT IS 900 PER MONTH. THE PHOTOS ARE FROM BEFORE THE TENANT MOVING IN. PROPERTY IS SOLD AS-IS. ALL DIMENSIONS ARE ESTIMATED AND SHOULD BE VERIFIED. ALL SHOWINGS REQUIRE A LICENSED AGENT TO BE PRESENT. BUYER TO PAY DETROIT INVESTMENT CO A 295 PROCESSING FEE AT CLOSING.
Key facts
- 3,049 sq ft lot
- Built 1961
- Listed 201 days
Neighborhood map
What this means for you Summary
Snapshot
- This is a 3-bed/1.0-bath single-family listed at $72k.
Deal economics
- At list price, monthly cash flow is $427 ($5k/yr) — positive.
- The deal already cash-flows at list — no discount required.
- Meets the 1% rule at list price ($1k rent vs $72k).
- Recommended offer: $63k (12.0% below list) — sets the bar for market timing.
- Cap rate 13.4% vs local median 10.0% in Detroit — top-decile yield for the area; either an underpriced asset or a hidden risk that comps aren't pricing in. Stress-test before assuming the spread holds.
Location & tenants
- Location reads 73/100 on livability (#218 in MI) — a middle-class / working-renter tenant base. Strengths: amenities A+, commute A+, cost of living A+; Watch: schools F, crime F, employment F.
- Detroit Public Schools Community District (urban): math 10% / reading 24% proficiency, ranked #499 of 540 in MI (top 92%) — low school quality limits family demand, transient renter base, plan for 1-2y turnover; 90% free/reduced lunch — lower-income household profile, screen leases tightly.
- Market conditions: Rents rising fast (+6.1%/yr); 350 active listings in the ZIP; 27 comparable units currently listed for rent nearby; rentals at typical pace (median 26d on market — plan ~3-4 weeks tenant-placement turnaround); 44% of comp listings sitting > 30 days — soft ceiling on asking rent; lower-income renter base — watch delinquency; 2,639 units permitted in Wayne County in 2024 (1,216 in 5+ unit buildings).
- This rent runs 43% of the median local income ($33k/yr) — at the standard rent-burdened threshold; future hikes will face affordability resistance.
Forward outlook
- Local home prices are declining (-3.0%/yr); year-one equity from $497 of loan paydown is wiped out by about $2k of value loss. Plan a longer hold.
- Wayne County population projected at -17% by 2050 — secular population decline; favor cash flow + early exit over multi-decade hold.
- At projected returns (-3.0% appreciation + 6.1% rent growth), your $20k cash investment doubles in ~5 years — after that, you're playing with house money.
Negotiation context
- It's been on market 201 days — a 12% lower offer ($63k) is reasonable based on typical stale-listing flexibility.
- 2 sale attempts; this cycle's ask has dropped $8k (10%) from the opening price — seller is motivated, your offer sets the floor, not the list.
Questions for the listing agent
- It's been on market 201 days. Have you received any prior offers? Is the seller open to a 12% concession, seller financing, or rate buy-down credit?
- Built in 1961 — when were the roof, HVAC, electrical panel, plumbing, and water heater last replaced?
- Why hasn't it sold? Are there any deal-killer items the seller is aware of (foundation, flood, title, zoning, code violations)?
- Is there a deadline driving the sale (1031 exchange, divorce, estate, relocation)? That informs how much negotiation room exists.
- Schools are F-rated, which usually means shorter tenancies and higher turnover. Who's the typical renter profile here, and what's been the actual vacancy rate?
- Crime grade is F in this area — have there been break-ins, vandalism, or insurance claims at this property in the last 3 years? What carrier currently insures it and at what premium?
- What's the average days-on-market for RENTAL listings here right now (not sales)? A rising rental-DOM trend means longer vacancies and softer asking-rent achievability than the comps imply.
- What's the recent tenant-quality profile in this submarket — average credit score on applications, eviction rate, late-payment / NSF rate, and stable-employment percentage? A property-management company in the area should have these aggregated.
- How much new for-sale + rental construction is in the pipeline within 1–3 miles? Heavy new supply typically softens prices + rents 12–24 months out; constrained supply supports both.
Investment metrics
- 1% rule
- 1.65% ✓
- Cap rate
- 13.42%
- Cash-on-cash
- 25.44%
- DSCR
- 2.13
- GRM
- 5.0
CMA / ARV
- ARV (median comp)
- $37,027
- List price
- $71,900
- Delta
- 94.18%
- Verdict
- OVERPRICED
- Comps
- 20 within 1.0 mi
Show comp detail 12 sales within ~0.75 mi
| Address | Dist | Beds/Ba | Sqft | Sold | Price | $/sf | Match |
|---|---|---|---|---|---|---|---|
| 1931 Pilgrim St | 0.12mi | 3/1.0 | 931 (-0%) | 13mo | $65,000 | $70 | 83 |
| 15532 Baylis St | 0.27mi | 3/1.0 | 968 (+4%) | 12mo | $33,500 | $35 | 72 |
| 1952 Louise St | 0.44mi | 3/1.0 | 882 (-6%) | 2mo | $33,000 | $37 | 69 |
| 15560 La Salle Blvd | 0.33mi | 3/1.0 | 1,022 (+9%) | 1mo | $35,000 | $34 | 68 |
| 15611 Baylis St | 0.31mi | 3/1.0 | 968 (+4%) | 15mo | $38,500 | $40 | 67 |
| 1983 Brighton St | 0.58mi | 3/1.0 | 921 (-1%) | 5mo | $40,000 | $43 | 67 |
| 15488 Wildemere St | 0.72mi | 3/1.0 | 949 (+2%) | 1mo | $49,900 | $53 | 63 |
| 15721 Log Cabin St | 0.22mi | 2/1.0 (-1) | 844 (-10%) | 11mo | $23,000 | $27 | 60 |
| 16200 Lawton St | 0.72mi | 3/1.0 | 956 (+2%) | 4mo | $56,500 | $59 | 59 |
| 15834 Baylis St | 0.33mi | 3/1.0 | 1,065 (+14%) | 10mo | $111,500 | $105 | 53 |
| 2505 La Belle St | 0.67mi | 3/1.0 | 1,027 (+10%) | 2mo | $25,000 | $24 | 51 |
| 15893 Alden St | 0.69mi | 2/1.5 (-1) | 836 (-10%) | 1mo | $24,000 | $29 | 43 |
Match score weights: distance 35% · size 25% · config 20% · recency 20%. Top-matched comps best support the ARV.
Projected returns pro-forma
-3.0% appreciation · 6.14% rent growth · sell at horizon
- IRR
- 22.6%
- Equity multiple
- 1.97×
- Total profit
- $19,435
- Equity at exit
- $10,721
- IRR
- 32.6%
- Equity multiple
- 4.43×
- Total profit
- $68,992
- Equity at exit
- $6,217
Cash invested: $20,132 (down + closing). Projections, not guarantees.
Landlord ↔ Tenant lean methodology
- Overall (STATE)
- 62 Landlord-Friendly
- State Michigan
- 62 Landlord-Friendly · EVEN
- County
- — inherits STATE
- City
- — inherits STATE
ZIP-level market 48238
- Home prices YoY
- -14.4%
- Rents YoY
- 6.1%
- Active inventory
- 350
- Price-to-rent
- 5.0×
Monthly cashflow live
- Estimated rent
- $1,188 high interval (Pro) →
- Mortgage (P&I)
- −$377
- Tax from tax record
- −$105 /mo · $1,260/yr
- Insurance
- −$30
- HOA
- −$0
- Vacancy / Maint / Mgmt
- −$250
- Net cashflow
- $427
Break-even live
Sensitivity live
| Price | -10% $468 | -5% $447 | +0% $427 | +5% $407 | +10% $386 |
|---|---|---|---|---|---|
| Rent | -10% $333 | -5% $380 | +0% $427 | +5% $474 | +10% $521 |
| Rate | -1.0pp $463 | -0.5pp $445 | base $427 | +0.5pp $408 | +1.0pp $389 |
UW: 25.0% down · 7.5% · 30yr · 1.5% tax · 5.0% vac · 8.0% maint · 8.0% mgmt
Financing live
Cash to close
- Down payment
- $17,975
- Closing costs
- $2,157
- Reserves months
- —
- Total cash needed
- —
Loan-product check · same deal, 3 products live
Conventional
25% down · 7.5% · 30yr
- Down + closing
- —
- Monthly P&I
- —
- Monthly cashflow
- —
- DSCR
- —
- Eligible?
- —
Personal DTI + credit; lowest rate.
DSCR
20% down · 8.5% · 30yr
- Down + closing
- —
- Monthly P&I
- —
- Monthly cashflow
- —
- DSCR
- —
- Eligible?
- —
No personal income docs; deal must DSCR.
Hard money
10% down · 12.0% · 12mo
- Down + closing
- —
- Monthly P&I
- —
- Monthly cashflow
- —
- DSCR
- —
- Eligible?
- —
Short-term bridge; refi at stabilization.
Rent comps 27 comps
| Address | Beds | Baths | Sqft | Rent | $/sqft | DOM | Units | Dist |
|---|---|---|---|---|---|---|---|---|
| 16174 Princeton St Detroit, MI | 2.0 | 1.0 | 985 | $1,100 | $1.12 | 21d | 1 | 0.66mi |
| 16174 Princeton St Unit 2 Detroit, MI | 2.0 | 1.0 | 985 | $1,100 | $1.12 | 45d | 1 | 0.66mi |
| 15906 Alden St Detroit, MI | 3.0 | 1.0 | 1030 | $1,150 | $1.12 | 18d | 1 | 0.68mi |
| 2433 Pasadena St Unit 2435 Detroit, MI | 2.0 | 1.0 | 700 | $1,025 | $1.46 | 45d | 1 | 0.71mi |
| 13639 La Salle Blvd Detroit, MI | 2.0 | 1.0 | 800 | $695 | $0.87 | 12d | 1 | 0.74mi |
| 16927 Inverness St Detroit, MI | 2.0 | 1.0 | 897 | $1,650 | $1.84 | 18d | 1 | 0.80mi |
| 941 Merton Rd Highland Park, MI | 2.0 | 1.0 | 850 | $1,000 | $1.18 | 45d | 1 | 0.85mi |
| 17449 Manderson Rd Unit 1 Detroit, MI | 2.0 | 1.0 | 750 | $1,150 | $1.53 | 26d | 1 | 0.91mi |
| 730 Whitmore Rd Detroit, MI | 1.0–2.0 | 1.0 | 850 | $850 | $1.00 | 45d | 3 | 0.99mi |
| 2034 Ewald Cir Detroit, MI | 2.0 | 1.0 | 1000 | $995 | $0.99 | 6d | 1 | 1.02mi |
| 27 Pasadena St Highland Park, MI | 2.0 | 1.0 | 900 | $825 | $0.92 | 45d | 1 | 1.04mi |
| 931 Covington Dr Unit 202 Highland Park, MI | 2.0 | 2.0 | 550 | $1,400 | $2.55 | 45d | 1 | 1.05mi |
| 127 W Buena Vista St Unit 129 Highland Park, MI | 2.0 | 1.0 | 800 | $1,000 | $1.25 | 45d | 1 | 1.11mi |
| 17765 Manderson Rd Unit 8 Highland Park, MI | 2.0 | 1.0 | 1000 | $1,215 | $1.22 | 3d | 1 | 1.14mi |
| 17765 Manderson Rd Unit 14 Highland Park, MI | 2.0 | 1.0 | 1000 | $1,175 | $1.18 | 45d | 1 | 1.14mi |
| 14950 Stoepel St Detroit, MI | 2.0 | 1.0 | 600 | $900 | $1.50 | 26d | 1 | 1.24mi |
| 2285 Cortland St Detroit, MI | 2.0 | 1.0 | 900 | $1,000 | $1.11 | 18d | 1 | 1.26mi |
| 2676 Sturtevant St Unit 1 Detroit, MI | 2.0 | 1.0 | 1000 | $1,000 | $1.00 | 26d | 1 | 1.29mi |
| 3812 W Grand St Detroit, MI | 2.0 | 1.0 | 1100 | $1,025 | $0.93 | 18d | 1 | 1.33mi |
| 7350 Globe St Detroit, MI | 3.0 | 1.0 | 1000 | $1,550 | $1.55 | 5d | 1 | 1.37mi |
| 2638 Richton St Unit 2638 Richton Upper Detroit, MI | 2.0 | 1.0 | 1000 | $900 | $0.90 | 45d | 1 | 1.37mi |
| 17215 Warrington Dr Detroit, MI | 2.0 | 1.0 | 1015 | $2,000 | $1.97 | 45d | 1 | 1.44mi |
| 4045 Clements St Detroit, MI | 3.0 | 1.0 | 850 | $1,150 | $1.35 | 26d | 1 | 1.44mi |
| 4045 Clements St Detroit, MI | 3.0 | 1.0 | 850 | $1,150 | $1.35 | 45d | 1 | 1.44mi |
| 3783 Tyler St Unit Lower Detroit, MI | 3.0 | 1.0 | 1000 | $1,150 | $1.15 | 45d | 1 | 1.44mi |
| 3824 Tyler St Apt 1 Detroit, MI | 3.0 | 1.0 | 900 | $1,523 | $1.69 | 18d | 1 | 1.45mi |
| 2023 Tuxedo St Detroit, MI | 2.0 | 1.0 | 950 | $1,050 | $1.11 | 26d | 1 | 1.46mi |
Listing history 25 events
-
2026-06-21days on market $71,900 Active 201 DOM
-
2026-06-18days on market $71,900 Active 198 DOM
-
2026-06-17days on market $71,900 Active 197 DOM
-
2026-06-15days on market $71,900 Active 195 DOM
-
2026-06-13days on market $71,900 Active 193 DOM
-
2026-06-13pricedays on market $71,900 Active 192 DOM
-
2026-06-09days on market $72,900 Active 189 DOM
-
2026-06-08days on market $72,900 Active 188 DOM
-
2026-06-07days on market $72,900 Active 187 DOM
-
2026-06-04days on market $72,900 Active 184 DOM
-
2026-06-03days on market $72,900 Active 183 DOM
-
2026-06-02price $72,900 Active 181 DOM
-
2026-06-01days on market $73,900 Active 181 DOM
-
2026-05-31days on market $73,900 Active 180 DOM
-
2026-05-13price $73,900 521-char remark
Show marketing remark (521 chars)
TENANT OCCUPIED RANCH HOME LOCATED NORTH OF FENKELL AND WEST OF HAMILTON AVENUE. THIS HOME FEATURES SPACIOUS LIVING ROOM, EAT IN KITCHEN, THREE BEDROOMS, ONE BATHROOM, AND AN UNFINISHED BASEMENT. THE TENANT IS IN A LEASE UNTIL 8/26/26, AND THE MONTHLY RENT IS 900 PER MONTH. THE PHOTOS ARE FROM BEFORE THE TENANT MOVING IN. PROPERTY IS SOLD AS-IS. ALL DIMENSIONS ARE ESTIMATED AND SHOULD BE VERIFIED. ALL SHOWINGS REQUIRE A LICENSED AGENT TO BE PRESENT. BUYER TO PAY DETROIT INVESTMENT CO A 295 PROCESSING FEE AT CLOSING.
-
2026-05-12price $73,900 521-char remark
Show marketing remark (521 chars)
TENANT OCCUPIED RANCH HOME LOCATED NORTH OF FENKELL AND WEST OF HAMILTON AVENUE. THIS HOME FEATURES SPACIOUS LIVING ROOM, EAT IN KITCHEN, THREE BEDROOMS, ONE BATHROOM, AND AN UNFINISHED BASEMENT. THE TENANT IS IN A LEASE UNTIL 8/26/26, AND THE MONTHLY RENT IS 900 PER MONTH. THE PHOTOS ARE FROM BEFORE THE TENANT MOVING IN. PROPERTY IS SOLD AS-IS. ALL DIMENSIONS ARE ESTIMATED AND SHOULD BE VERIFIED. ALL SHOWINGS REQUIRE A LICENSED AGENT TO BE PRESENT. BUYER TO PAY DETROIT INVESTMENT CO A 295 PROCESSING FEE AT CLOSING.
-
2026-04-24price $75,900 521-char remark
Show marketing remark (521 chars)
TENANT OCCUPIED RANCH HOME LOCATED NORTH OF FENKELL AND WEST OF HAMILTON AVENUE. THIS HOME FEATURES SPACIOUS LIVING ROOM, EAT IN KITCHEN, THREE BEDROOMS, ONE BATHROOM, AND AN UNFINISHED BASEMENT. THE TENANT IS IN A LEASE UNTIL 8/26/26, AND THE MONTHLY RENT IS 900 PER MONTH. THE PHOTOS ARE FROM BEFORE THE TENANT MOVING IN. PROPERTY IS SOLD AS-IS. ALL DIMENSIONS ARE ESTIMATED AND SHOULD BE VERIFIED. ALL SHOWINGS REQUIRE A LICENSED AGENT TO BE PRESENT. BUYER TO PAY DETROIT INVESTMENT CO A 295 PROCESSING FEE AT CLOSING.
-
2026-04-23price $75,900 521-char remark
Show marketing remark (521 chars)
TENANT OCCUPIED RANCH HOME LOCATED NORTH OF FENKELL AND WEST OF HAMILTON AVENUE. THIS HOME FEATURES SPACIOUS LIVING ROOM, EAT IN KITCHEN, THREE BEDROOMS, ONE BATHROOM, AND AN UNFINISHED BASEMENT. THE TENANT IS IN A LEASE UNTIL 8/26/26, AND THE MONTHLY RENT IS 900 PER MONTH. THE PHOTOS ARE FROM BEFORE THE TENANT MOVING IN. PROPERTY IS SOLD AS-IS. ALL DIMENSIONS ARE ESTIMATED AND SHOULD BE VERIFIED. ALL SHOWINGS REQUIRE A LICENSED AGENT TO BE PRESENT. BUYER TO PAY DETROIT INVESTMENT CO A 295 PROCESSING FEE AT CLOSING.
-
2026-03-26price $76,900 521-char remark
Show marketing remark (521 chars)
TENANT OCCUPIED RANCH HOME LOCATED NORTH OF FENKELL AND WEST OF HAMILTON AVENUE. THIS HOME FEATURES SPACIOUS LIVING ROOM, EAT IN KITCHEN, THREE BEDROOMS, ONE BATHROOM, AND AN UNFINISHED BASEMENT. THE TENANT IS IN A LEASE UNTIL 8/26/26, AND THE MONTHLY RENT IS 900 PER MONTH. THE PHOTOS ARE FROM BEFORE THE TENANT MOVING IN. PROPERTY IS SOLD AS-IS. ALL DIMENSIONS ARE ESTIMATED AND SHOULD BE VERIFIED. ALL SHOWINGS REQUIRE A LICENSED AGENT TO BE PRESENT. BUYER TO PAY DETROIT INVESTMENT CO A 295 PROCESSING FEE AT CLOSING.
-
2026-03-25price $76,900 521-char remark
Show marketing remark (521 chars)
TENANT OCCUPIED RANCH HOME LOCATED NORTH OF FENKELL AND WEST OF HAMILTON AVENUE. THIS HOME FEATURES SPACIOUS LIVING ROOM, EAT IN KITCHEN, THREE BEDROOMS, ONE BATHROOM, AND AN UNFINISHED BASEMENT. THE TENANT IS IN A LEASE UNTIL 8/26/26, AND THE MONTHLY RENT IS 900 PER MONTH. THE PHOTOS ARE FROM BEFORE THE TENANT MOVING IN. PROPERTY IS SOLD AS-IS. ALL DIMENSIONS ARE ESTIMATED AND SHOULD BE VERIFIED. ALL SHOWINGS REQUIRE A LICENSED AGENT TO BE PRESENT. BUYER TO PAY DETROIT INVESTMENT CO A 295 PROCESSING FEE AT CLOSING.
-
2026-01-30price $78,900 521-char remark
Show marketing remark (521 chars)
TENANT OCCUPIED RANCH HOME LOCATED NORTH OF FENKELL AND WEST OF HAMILTON AVENUE. THIS HOME FEATURES SPACIOUS LIVING ROOM, EAT IN KITCHEN, THREE BEDROOMS, ONE BATHROOM, AND AN UNFINISHED BASEMENT. THE TENANT IS IN A LEASE UNTIL 8/26/26, AND THE MONTHLY RENT IS 900 PER MONTH. THE PHOTOS ARE FROM BEFORE THE TENANT MOVING IN. PROPERTY IS SOLD AS-IS. ALL DIMENSIONS ARE ESTIMATED AND SHOULD BE VERIFIED. ALL SHOWINGS REQUIRE A LICENSED AGENT TO BE PRESENT. BUYER TO PAY DETROIT INVESTMENT CO A 295 PROCESSING FEE AT CLOSING.
-
2026-01-29price $78,900 521-char remark
Show marketing remark (521 chars)
TENANT OCCUPIED RANCH HOME LOCATED NORTH OF FENKELL AND WEST OF HAMILTON AVENUE. THIS HOME FEATURES SPACIOUS LIVING ROOM, EAT IN KITCHEN, THREE BEDROOMS, ONE BATHROOM, AND AN UNFINISHED BASEMENT. THE TENANT IS IN A LEASE UNTIL 8/26/26, AND THE MONTHLY RENT IS 900 PER MONTH. THE PHOTOS ARE FROM BEFORE THE TENANT MOVING IN. PROPERTY IS SOLD AS-IS. ALL DIMENSIONS ARE ESTIMATED AND SHOULD BE VERIFIED. ALL SHOWINGS REQUIRE A LICENSED AGENT TO BE PRESENT. BUYER TO PAY DETROIT INVESTMENT CO A 295 PROCESSING FEE AT CLOSING.
-
2025-12-02$79,900 Active 521-char remark
Show marketing remark (521 chars)
TENANT OCCUPIED RANCH HOME LOCATED NORTH OF FENKELL AND WEST OF HAMILTON AVENUE. THIS HOME FEATURES SPACIOUS LIVING ROOM, EAT IN KITCHEN, THREE BEDROOMS, ONE BATHROOM, AND AN UNFINISHED BASEMENT. THE TENANT IS IN A LEASE UNTIL 8/26/26, AND THE MONTHLY RENT IS 900 PER MONTH. THE PHOTOS ARE FROM BEFORE THE TENANT MOVING IN. PROPERTY IS SOLD AS-IS. ALL DIMENSIONS ARE ESTIMATED AND SHOULD BE VERIFIED. ALL SHOWINGS REQUIRE A LICENSED AGENT TO BE PRESENT. BUYER TO PAY DETROIT INVESTMENT CO A 295 PROCESSING FEE AT CLOSING.
-
2019-01-28soldstatus $271,500
ⓘ Source: listings_history table (triggers on properties + properties_extension) + one-shot
backfill from property_details.listing_events for pre-trigger history.
Tax reassessment forecast MI · Partial reset (capped growth)
- Current annual tax
- $1,260 · $105/mo
- Projected year-2 tax
- $1,260 · $105/mo
- Expected delta
- $0/yr ($0/mo · 0.0%)
ⓘ Screening estimate from a state-policy table — verify with the county assessor before closing.
Climate risk First Street
- Flood 3/10 Moderate FEMA zone X (unshaded) · 20% chance over 30 yrs
- Wildfire 1/10 Low
- Heat 3/10 Moderate 7 d/yr ≥97°F today · 14 d/yr by 30 yrs out
- Wind 2/10 Low
- Air quality 4/10 Moderate 4 unhealthy d/yr today · 6 by 30 yrs out
Nearby sold comps map
Loading sold comps map…
Walkable amenities ~0.75 mi
Loading nearby amenities…
Taxation est. · year 1
- Rental income
- $14,261
- − Mortgage interest
- −$4,028
- − Property taxes
- −$1,260
- − Insurance
- −$360
- − Repairs & maintenance
- −$1,141
- − Management
- −$1,141
- − Depreciation
- −$2,092
- Taxable income
- $4,241
- Est. tax owed @ 24.0%
- −$1,018
- After-tax cash flow
- $4,104/yr
For passive investors: Depreciation is non-cash, so a rental often shows a tax loss while cash-flowing — sheltering income. Rental losses are passive: they offset passive income freely, and up to $25,000/yr can offset ordinary (W-2) income if you actively participate and your MAGI is under $100k (phasing out to $0 by $150k); unused losses carry forward. On sale, claimed depreciation is recaptured at up to 25%, and gains may owe capital-gains tax (a 1031 exchange can defer both). Figures are a year-1 estimate at your 24.0% rate — not tax advice; consult a CPA.
Schools (NCES district)
- District
- Detroit Public Schools Community District
- NCES district ID
- 2601103
- Math proficiency
- 10% ▼ -2.00%
- Reading proficiency
- 24% ▲ 6.00%
- Median HH income
- $25,815
- Composite
- 13.06/100
- National rank
- #9564
- State rank
- #499 of 540 in MI
Livability — Detroit
- Score
- 73/100
- State rank
- #218
- US rank
- #5427
Category grades
Schools grade is shown separately in the Schools card above.
Census & demographics
- Census place
- Detroit, MI
- County
- Wayne County · 1,562,939 people
- City population
- 572,865
- Metro
- Detroit-Warren-Dearborn, MI
- Population (ZIP)
- 24,731
- Household income
- $33,315
- Rent vs Own
- Severe rent burden
- 2172.0
Population outlook (Wayne County) Hauer SSP2
- Today (2025)
- 1,675,273 people
- By 2030
- 1,620,300 · -3.3%
- By 2040
- 1,502,341 · -10.3%
- By 2050
- 1,384,039 · -17.4%
- By 2075
- 1,124,592 · -32.9%
- By 2100
- 881,193 · -47.4%
Race, ethnicity, and origin ACS 2023
- Neighborhood character
- Predominantly Black (94%)
- Race & ethnicity
- Black 94% Two or more races 3% White 1%
- Foreign-born
- 1%
Political lean MEDSL · Wayne
- 2024 margin
- Strong D (+29.0) · D 62.7% · R 33.7% · Other 3.6%
- 2008→2024 swing
- -20.5pp toward R · 2008: 49.5pp · 2024: 29.0pp
- All cycles
- 2024: D+29.0 2020: D+38.1 2016: D+37.3 2012: D+46.9 2008: D+49.5
Not yet ingested
- Civics
- —
Market trends
- HPI YoY
- ▼ -31.96%
- Current HPI
- 189.6227
- Rent YoY
- ▲ 6.14%
- Metro
- Detroit-Warren-Dearborn, MI
- State GDP YoY
- ▲ 1.37%
- F500 in state
- 28
Industry mix (Fortune 500 HQ in MI)
| Industry | F500 HQs | Revenue |
|---|---|---|
| Automotive Parts | 3 | $48B |
|
||
| Automotive | 2 | $372B |
|
||
| Chemicals | 1 | $45B |
|
||
| Automotive Retail | 1 | $29B |
|
||
| Healthcare / Medical Devices | 1 | $23B |
|
||
| Automotive Technology | 1 | $20B |
|
||
Price history
-72.8% since first listed11 events — show timeline
- 2026-05-13 Price Changed $73,900 MiRealSource-MiMLS
- 2026-05-12 Price Changed $73,900 REALCOMP
- 2026-04-24 Price Changed $75,900 MiRealSource-MiMLS
- 2026-04-23 Price Changed $75,900 REALCOMP
- 2026-03-26 Price Changed $76,900 MiRealSource-MiMLS
- 2026-03-25 Price Changed $76,900 REALCOMP
- 2026-01-30 Price Changed $78,900 MiRealSource-MiMLS
- 2026-01-29 Price Changed $78,900 REALCOMP
- 2025-12-02 Listed $79,900 REALCOMP
- 2025-12-02 Listed $79,900 MiRealSource-MiMLS
- 2019-01-28 Sold (Public Records) $271,500 Public Records
Property tax history
+8.9%/yrLatest (2025): $1,260 · -54.0% YoY. Source: county tax records.
Cash-flow waterfall
monthlySold comps — $/sqft
last 12 mo · ≤1 miLoading sold comps…