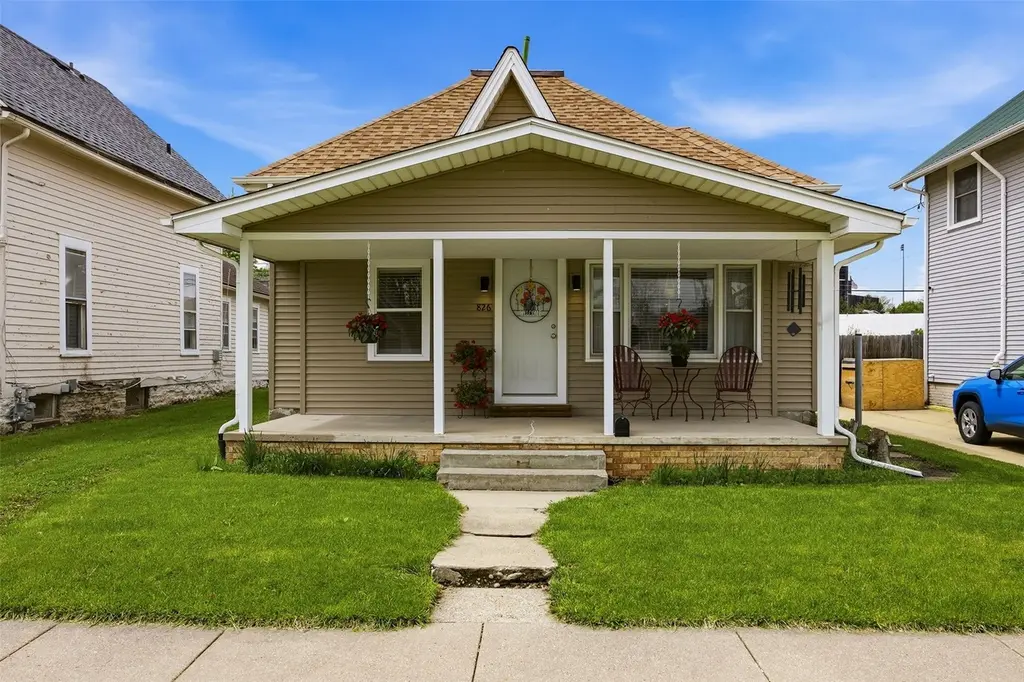
826 SW 10th St · Cedar Rapids, IA
Flood risk 4/10 · Minor
- FEMA flood zone
- X (unshaded)
- Chance of flooding over 30 yrs
- 0.21%
- Est. flood insurance / yr
- $473 – $860
Fire risk 1/10 · Minimal
- Est. fire insurance / yr
- $902 – $1,676
Heat risk 3/10 · Minor
- Hot days now (above 103°F)
- 7 days/yr
- Hot days in 30 yrs
- 15 days/yr
Wind risk 2/10 · Minimal
- Chance of severe wind over 30 yrs
- —
Air-quality risk 2/10 · Minimal
- Unhealthy air days now
- 0 days/yr
- Unhealthy air days in 30 yrs
- 1 days/yr
Risk factors via First Street. Map © Google.
Why this score? — see what drove the D grade
The composite is a weighted blend of 9 inputs, each scored 0–100. Each bar is that input's sub-score; the figure is the points it added to the 100-point composite (weight × sub-score).
- Cash flow +18.0/30.0
- DSCR +5.6/10.0
- 1% rule +4.8/10.0
- Rent growth +4.7/5.0
- Schools +4.7/10.0
- Livability +3.9/5.0
- Condition / age +2.5/5.0
- ARV discount +0.0/15.0
- Appreciation +0.0/10.0
$140,000
🖨 Deal sheet (PDF) 📄 Offer letter ✓ Due diligence
Listing remarks MLS
Investor or First-Time Buyer Alert! Affordable, updated, and in a location that delivers—welcome to 826 10th St SW. Major updates were completed in 2022, including flooring, windows, plumbing, electrical, and a refreshed kitchen with appliances. Functional layout with main-level laundry and an updated bath. Fenced yard, 3 car garage, and—best of all—walkable to Kingston Stadium, Memorial Stadium, and a local restaurant/bar. At $140,000, this is a smart move whether you're buying your first home or adding to your portfolio.
Key facts
- Fenced yard
- Updated kitchen
- 5,663 sq ft lot
Tags
Property features AI
Finance
- HOA & community: Association fee paid annually
Exterior
- Parking: 3 parking spaces
- Security: Smoke detector(s)
- Utilities: Public water; Public sewer
- Home design: Single family residence; Residential property
- Construction: Frame construction
- Exterior features: Deck; Patio; Fenced yard; Lot dimensions approx. 42 x 140
Interior
- Kitchen: Dishwasher; Refrigerator
- Bathrooms: 1 full bathroom
- Heating & cooling: Forced air heating; Central air; Ceiling fans
- Interior features: Other interior features; Smoke detectors
- Laundry & utility: Laundry on lower level
Neighborhood map
What this means for you Summary
Snapshot
- This is a 2-bed/1.0-bath single-family listed at $140k.
Deal economics
- At list price, monthly cash flow is $121 ($1k/yr) — positive.
- The deal already cash-flows at list — no discount required.
- To meet the 1% rule (rent ≥ 1% of price), the offer needs to be $137k (2.3% below list).
- Recommended offer: $137k (2.3% below list) — sets the bar for 1% rule.
- Cap rate 7.3% vs local median 3.5% in Cedar Rapids — top-decile yield for the area; either an underpriced asset or a hidden risk that comps aren't pricing in. Stress-test before assuming the spread holds.
Location & tenants
- Location reads 78/100 on livability (#134 in IA, #2,474 nationally) — a middle-class / working-renter tenant base. Strengths: cost of living A+, housing A+, health & safety A+; Watch: crime C-, commute F.
- Cedar Rapids Community School District (urban): math 50% / reading 59% proficiency, ranked #265 of 289 in IA (top 92%) — acceptable for families but not a draw, mixed tenant base, ~2y average lease.
- Zoned schools: Cedar River Academy At Taylor (math 22% / reading 27%, grade F, #613 of 616 statewide, top 100%, 296 students, 78% FRL); Wilson Middle School (math 42% / reading 49%, grade D+, #231 of 246 statewide, top 94%, 395 students, 72% FRL); Thomas Jefferson High School (math 41% / reading 62%, grade D+, #307 of 336 statewide, top 91%, 1,543 students, 56% FRL) — zoned schools average 69% FRL vs 43% district-wide (26 pts higher); higher-poverty schools than district average — tighter screening recommended.
- Zoned-school proficiency averages 40% at this address vs 54% district-wide (-14 pts) — the specific schools serving this property underperform the Cedar Rapids Community School District average; the district grade overstates school quality for this exact location.
- Market conditions: Rents rising fast (+8.8%/yr); 419 active listings in the ZIP; 3 comparable units currently listed for rent nearby; rentals at typical pace (median 22d on market — plan ~3-4 weeks tenant-placement turnaround); 1,023 units permitted in Linn County in 2024 (456 in 5+ unit buildings).
Forward outlook
- Local home prices are declining (-3.0%/yr); year-one equity from $968 of loan paydown is wiped out by about $4k of value loss. Plan a longer hold.
- Linn County population projected at +16% by 2050 — long-run rental-demand tailwind backs the buy-and-hold thesis.
- At projected returns (-3.0% appreciation + 8.0% rent growth), your $39k cash investment doubles in ~10 years — after that, you're playing with house money.
Negotiation context
- Only 2 days on market — expect competitive offers; lowballing is unlikely to land.
- 3 sale attempts since 4y ago with the ask held roughly flat each time — persistent listings suggest the price (not the market) is what's stuck; bring a comps-based counter.
Risks & watch-outs
- Watch-outs: built in 1895 — expect roof / HVAC / electrical / plumbing capex.
Questions for the listing agent
- Built in 1895 — when were the roof, HVAC, electrical panel, plumbing, and water heater last replaced?
- Is there a deadline driving the sale (1031 exchange, divorce, estate, relocation)? That informs how much negotiation room exists.
- Schools are B-rated — typically a magnet for longer-tenancy family renters. What's the average tenant stay here, and is there a school-zone premium baked into asking?
- The area grade is low — what's the realistic commute time and amenity access for the typical tenant pool here? Any planned neighborhood developments (good or bad) we should know about?
- What's the average days-on-market for RENTAL listings here right now (not sales)? A rising rental-DOM trend means longer vacancies and softer asking-rent achievability than the comps imply.
- What's the recent tenant-quality profile in this submarket — average credit score on applications, eviction rate, late-payment / NSF rate, and stable-employment percentage? A property-management company in the area should have these aggregated.
- How much new for-sale + rental construction is in the pipeline within 1–3 miles? Heavy new supply typically softens prices + rents 12–24 months out; constrained supply supports both.
Investment metrics
- 1% rule
- 0.98% ✗
- Cap rate
- 7.33%
- Cash-on-cash
- 3.70%
- DSCR
- 1.16
- GRM
- 8.5
CMA / ARV
- ARV (on-the-fly)
- $119,016
- Comps found
- 12
Show comp detail 12 sales within ~0.75 mi
| Address | Dist | Beds/Ba | Sqft | Sold | Price | $/sf | Match |
|---|---|---|---|---|---|---|---|
| 702 8th St SW | 0.18mi | 2/1.0 | 720 (+3%) | 5mo | $83,000 | $115 | 82 |
| 826 SW 10th St | 0.00mi | 2/1.0 | 800 (+15%) | 0mo | $140,000 | $175 | 75 |
| 522 8th St St SW | 0.22mi | 2/1.0 | 791 (+14%) | 1mo | $135,000 | $171 | 66 |
| 1137 15th Ave | 0.36mi | 2/1.0 | 763 (+10%) | 10mo | $97,000 | $127 | 59 |
| 1209 16th St St SW | 0.53mi | 2/1.0 | 768 (+10%) | 1mo | $142,000 | $185 | 57 |
| 925 21st Ave SW | 0.70mi | 2/1.0 | 648 (-7%) | 1mo | $108,000 | $167 | 55 |
| 938 18th Avenue Ave SW | 0.45mi | 2/1.0 | 760 (+9%) | 13mo | $92,500 | $122 | 53 |
| 1506 13th Ave SW | 0.53mi | 3/1.0 (+1) | 768 (+10%) | 1mo | $168,000 | $219 | 52 |
| 620 15th Ave SW | 0.41mi | 2/1.0 | 616 (-12%) | 12mo | $90,000 | $146 | 52 |
| 1116 21st Ave SW | 0.67mi | 2/1.0 | 668 (-4%) | 13mo | $80,000 | $120 | 51 |
| 944 L St St SW | 0.58mi | 2/1.0 | 636 (-9%) | 9mo | $118,500 | $186 | 51 |
| 945 19th Ave SW | 0.55mi | 2/1.0 | 792 (+14%) | 13mo | $136,900 | $173 | 40 |
Match score weights: distance 35% · size 25% · config 20% · recency 20%. Top-matched comps best support the ARV.
Projected returns pro-forma
-3.0% appreciation · 8.0% rent growth · sell at horizon
- IRR
- -5.0%
- Equity multiple
- 0.80×
- Total profit
- $-7,752
- Equity at exit
- $20,874
- IRR
- 9.7%
- Equity multiple
- 1.92×
- Total profit
- $36,115
- Equity at exit
- $12,105
Cash invested: $39,200 (down + closing). Projections, not guarantees.
Landlord ↔ Tenant lean methodology
- Overall (STATE)
- 83 Strongly Landlord-Friendly
- State Iowa
- 83 Strongly Landlord-Friendly · R+6
- County
- — inherits STATE
- City
- — inherits STATE
ZIP-level market 52404
- Rents YoY
- 8.8%
- Active inventory
- 419
- Price-to-rent
- 8.5×
Monthly cashflow live
- Estimated rent
- $1,368 medium interval (Pro) →
- Mortgage (P&I)
- −$734
- Tax from tax record
- −$167 /mo · $2,008/yr
- Insurance
- −$58
- HOA
- −$0
- Vacancy / Maint / Mgmt
- −$287
- Net cashflow
- $121
Break-even live
Sensitivity live
| Price | -10% $200 | -5% $160 | +0% $121 | +5% $81 | +10% $41 |
|---|---|---|---|---|---|
| Rent | -10% $13 | -5% $67 | +0% $121 | +5% $175 | +10% $229 |
| Rate | -1.0pp $191 | -0.5pp $156 | base $121 | +0.5pp $84 | +1.0pp $48 |
UW: 25.0% down · 7.5% · 30yr · 1.5% tax · 5.0% vac · 8.0% maint · 8.0% mgmt
Financing live
Cash to close
- Down payment
- $35,000
- Closing costs
- $4,200
- Reserves months
- —
- Total cash needed
- —
Loan-product check · same deal, 3 products live
Conventional
25% down · 7.5% · 30yr
- Down + closing
- —
- Monthly P&I
- —
- Monthly cashflow
- —
- DSCR
- —
- Eligible?
- —
Personal DTI + credit; lowest rate.
DSCR
20% down · 8.5% · 30yr
- Down + closing
- —
- Monthly P&I
- —
- Monthly cashflow
- —
- DSCR
- —
- Eligible?
- —
No personal income docs; deal must DSCR.
Hard money
10% down · 12.0% · 12mo
- Down + closing
- —
- Monthly P&I
- —
- Monthly cashflow
- —
- DSCR
- —
- Eligible?
- —
Short-term bridge; refi at stabilization.
Rent comps 3 comps
| Address | Beds | Baths | Sqft | Rent | $/sqft | DOM | Units | Dist |
|---|---|---|---|---|---|---|---|---|
| 612 4th Ave SW Unit 612 Upper Cedar Rapids, IA | 2.0 | 1.0 | 616 | $2,000 | $3.25 | 22d | 1 | 0.34mi |
| 640 16th Ave SW Cedar Rapids, IA | 1.0 | 1.0 | 595 | $850 | $1.43 | 45d | 2 | 0.46mi |
| 400 2nd St SW Cedar Rapids, IA | 1.0 | 1.0 | 615 | $1,195 | $1.94 | 22d | 1 | 0.63mi |
Listing history 8 events
-
2026-05-01status Pending
Show marketing remark (546 chars)
Investor or First-Time Buyer Alert! Affordable, updated, and in a location that delivers—welcome to 826 10th St SW. Major updates were completed in 2022, including flooring, windows, plumbing, electrical, and a refreshed kitchen with appliances. Functional layout with main-level laundry and an updated bath. Fenced yard, 3 car garage, and—best of all—walkable to Kingston Stadium, Memorial Stadium, and a local restaurant/bar. At $140,000, this is a smart move whether you're buying your first home or adding to your portfolio.
-
2026-05-01status Pending 546-char remark
Show marketing remark (546 chars)
Investor or First-Time Buyer Alert! Affordable, updated, and in a location that delivers—welcome to 826 10th St SW. Major updates were completed in 2022, including flooring, windows, plumbing, electrical, and a refreshed kitchen with appliances. Functional layout with main-level laundry and an updated bath. Fenced yard, 3 car garage, and—best of all—walkable to Kingston Stadium, Memorial Stadium, and a local restaurant/bar. At $140,000, this is a smart move whether you're buying your first home or adding to your portfolio.
-
2026-04-29$140,000 Active
Show marketing remark (546 chars)
Investor or First-Time Buyer Alert! Affordable, updated, and in a location that delivers—welcome to 826 10th St SW. Major updates were completed in 2022, including flooring, windows, plumbing, electrical, and a refreshed kitchen with appliances. Functional layout with main-level laundry and an updated bath. Fenced yard, 3 car garage, and—best of all—walkable to Kingston Stadium, Memorial Stadium, and a local restaurant/bar. At $140,000, this is a smart move whether you're buying your first home or adding to your portfolio.
-
2026-04-29$140,000 Active 546-char remark
Show marketing remark (546 chars)
Investor or First-Time Buyer Alert! Affordable, updated, and in a location that delivers—welcome to 826 10th St SW. Major updates were completed in 2022, including flooring, windows, plumbing, electrical, and a refreshed kitchen with appliances. Functional layout with main-level laundry and an updated bath. Fenced yard, 3 car garage, and—best of all—walkable to Kingston Stadium, Memorial Stadium, and a local restaurant/bar. At $140,000, this is a smart move whether you're buying your first home or adding to your portfolio.
-
2022-04-19soldstatus $138,000
-
2022-04-12soldstatus $137,600 584-char remark
Show marketing remark (584 chars)
Completely remodeled Ranch home in Cedar Rapids w/ 3 car garage is waiting for a new owner. Open concept layout, Updates include windows, flooring, Brand new kitchen & appliances, pantry space, Laundry area, All new bathroom, Fresh Paint, some Plumbing & Electrical. New roof, new siding and you can also check a fenced-in yard off your list. Close to shopping, 380, restaurants and there's a park just down the street. From the front porch relaxation to the nights by your backyard firepit or projects and entertaining in the garage you'll have plenty to look forward to!
-
2022-03-02$130,000 584-char remark
Show marketing remark (584 chars)
Completely remodeled Ranch home in Cedar Rapids w/ 3 car garage is waiting for a new owner. Open concept layout, Updates include windows, flooring, Brand new kitchen & appliances, pantry space, Laundry area, All new bathroom, Fresh Paint, some Plumbing & Electrical. New roof, new siding and you can also check a fenced-in yard off your list. Close to shopping, 380, restaurants and there's a park just down the street. From the front porch relaxation to the nights by your backyard firepit or projects and entertaining in the garage you'll have plenty to look forward to!
-
2014-02-12soldstatus $60,000
ⓘ Source: listings_history table (triggers on properties + properties_extension) + one-shot
backfill from property_details.listing_events for pre-trigger history.
Tax reassessment forecast IA · Partial reset (capped growth)
- Current annual tax
- $2,008 · $167/mo
- Projected year-2 tax
- $2,103 · $175/mo
- Expected delta
- +$95/yr (+$8/mo · 4.7%)
ⓘ Screening estimate from a state-policy table — verify with the county assessor before closing.
Climate risk First Street
- Flood 4/10 Moderate FEMA zone X (unshaded) · 21% chance over 30 yrs
- Wildfire 1/10 Low
- Heat 3/10 Moderate 7 d/yr ≥103°F today · 15 d/yr by 30 yrs out
- Wind 2/10 Low
- Air quality 2/10 Low 0 unhealthy d/yr today · 1 by 30 yrs out
Nearby sold comps map
Loading sold comps map…
Walkable amenities ~0.75 mi
Loading nearby amenities…
Taxation est. · year 1
- Rental income
- $16,414
- − Mortgage interest
- −$7,842
- − Property taxes
- −$2,008
- − Insurance
- −$700
- − Repairs & maintenance
- −$1,313
- − Management
- −$1,313
- − Depreciation
- −$4,073
- Taxable loss
- −$835
- Est. tax savings @ 24.0%
- +$200
- After-tax cash flow
- $1,649/yr
For passive investors: Depreciation is non-cash, so a rental often shows a tax loss while cash-flowing — sheltering income. Rental losses are passive: they offset passive income freely, and up to $25,000/yr can offset ordinary (W-2) income if you actively participate and your MAGI is under $100k (phasing out to $0 by $150k); unused losses carry forward. On sale, claimed depreciation is recaptured at up to 25%, and gains may owe capital-gains tax (a 1031 exchange can defer both). Figures are a year-1 estimate at your 24.0% rate — not tax advice; consult a CPA.
Schools (NCES district)
- District
- Cedar Rapids Community School District
- NCES district ID
- 1906540
- Math proficiency
- 50% ▼ -12.00%
- Reading proficiency
- 59% ▼ -6.00%
- Median HH income
- $53,568
- Composite
- 46.82/100
- National rank
- #2378
- State rank
- #265 of 289 in IA
Livability — Cedar Rapids
- Score
- 78/100
- State rank
- #134
- US rank
- #2474
Category grades
Schools grade is shown separately in the Schools card above.
Census & demographics
- Census place
- Cedar Rapids, IA
- County
- Linn County · 179,860 people
- City population
- 137,154
- Metro
- Cedar Rapids, IA
- Population (ZIP)
- 42,958
- Household income
- $61,870
- Rent vs Own
- Severe rent burden
- 1041.0
Population outlook (Linn County) Hauer SSP2
- Today (2025)
- 239,589 people
- By 2030
- 248,587 · +3.8%
- By 2040
- 264,817 · +10.5%
- By 2050
- 278,685 · +16.3%
- By 2075
- 311,754 · +30.1%
- By 2100
- 336,773 · +40.6%
Race, ethnicity, and origin ACS 2023
- Neighborhood character
- Predominantly White (74%)
- Race & ethnicity
- White 74% Black 10% Two or more races 10% Hispanic / Latino 7%
- Hispanic origin (detail)
- Mexican 5%
- Common ancestry
- Portuguese 3% Lithuanian 2% Romanian 2%
- Foreign-born
- 8% · Canada
- Languages at home
- 90% English-only · Spanish 3% French/Haitian/Cajun 2% Other Asian/Pacific 1%
Political lean MEDSL · Linn
- 2024 margin
- Lean D (+9.9) · D 54.2% · R 44.3% · Other 1.4%
- 2008→2024 swing
- -11.6pp toward R · 2008: 21.5pp · 2024: 9.9pp
- All cycles
- 2024: D+9.9 2020: D+13.7 2016: D+9.0 2012: D+17.6 2008: D+21.5
Not yet ingested
- Civics
- —
Market trends
- HPI YoY
- ▼ -154.96%
- Current HPI
- 241.81
- Rent YoY
- ▲ 8.79%
- Metro
- Cedar Rapids, IA
- State GDP YoY
- ▲ 2.48%
- F500 in state
- 4
Industry mix (Fortune 500 HQ in IA)
| Industry | F500 HQs | Revenue |
|---|---|---|
| Financial Services | 1 | $16B |
|
||
| Retail / Convenience | 1 | $15B |
|
||
Price history
+133.3% since first listed8 events — show timeline
- 2026-05-01 Pending — ICAARMLS
- 2026-05-01 Pending — CRAAR, CDRMLS
- 2026-04-29 Listed $140,000 ICAARMLS
- 2026-04-29 Listed $140,000 CRAAR, CDRMLS
- 2022-04-19 Sold (Public Records) $138,000 Public Records
- 2022-04-12 Sold (MLS) $137,600 CRAAR, CDRMLS
- 2022-03-02 Listed $130,000 CRAAR, CDRMLS
- 2014-02-12 Sold (Public Records) $60,000 Public Records
Property tax history
+2.7%/yrLatest (2025): $2,008 · +2.3% YoY. Source: county tax records.
Cash-flow waterfall
monthlySold comps — $/sqft
last 12 mo · ≤1 miLoading sold comps…