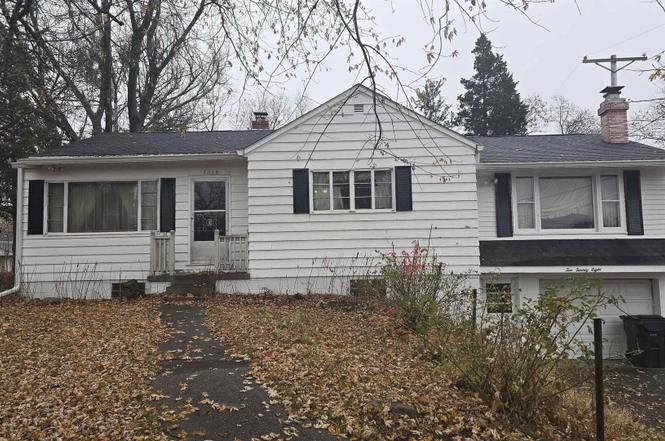
1028 Coyne Center Rd · Coyne Center, IL
Flood risk 1/10 · Minimal
- FEMA flood zone
- X (unshaded)
- Chance of flooding over 30 yrs
- 0.0%
- Est. flood insurance / yr
- $507 – $1,088
Fire risk 1/10 · Minimal
- Est. fire insurance / yr
- $804 – $1,492
Heat risk 3/10 · Minor
- Hot days now (above 103°F)
- 7 days/yr
- Hot days in 30 yrs
- 16 days/yr
Wind risk 2/10 · Minimal
- Chance of severe wind over 30 yrs
- —
Air-quality risk 2/10 · Minimal
- Unhealthy air days now
- 2 days/yr
- Unhealthy air days in 30 yrs
- 2 days/yr
Risk factors via First Street. Map © Google.
Why this score? — see what drove the B- grade
The composite is a weighted blend of 9 inputs, each scored 0–100. Each bar is that input's sub-score; the figure is the points it added to the 100-point composite (weight × sub-score).
- Cash flow +30.0/30.0
- 1% rule +10.0/10.0
- DSCR +10.0/10.0
- ARV discount +7.5/15.0
- Livability +3.4/5.0
- Schools +2.7/10.0
- Rent growth +2.5/5.0
- Condition / age +2.5/5.0
- Appreciation +0.0/10.0
$79,900
🖨 Deal sheet 📄 Offer letter ✓ Due diligence
Listing remarks
Great flip or handyman home. Hardwood floors in some rooms, eat in kitchen, family room over the garage. .72 acre lot. Septic has been maintained by B & B Septic on contract over the years. Home is being sold "as is" condition. Roof approximately 2013, Gutters 2020 or so, per seller. Furnace and central air, age unknown. Buyers and buyer's agent to verify sq. footage. Per seller, Coyn Center Community water fee is $300 per year with two wells and 8 houses on each well. Septic fee is $300 per year to the Coyne Center Sanitation District. B & B Drain Tech pumps every 4 years. Last pumping was 5/13/2024. Dirt was noticed in tank and not in best condition are on the notes sh
Key facts
- 0.73 acre lot
- Garage
- Built 1951
Neighborhood map
What this means for you Summary
Snapshot
- This is a 3-bed/2.0-bath other listed at $80k.
Deal economics
- At list price, monthly cash flow is $621 ($7k/yr) — positive.
- The deal already cash-flows at list — no discount required.
- Meets the 1% rule at list price ($2k rent vs $80k).
Location & tenants
- Location reads 67/100 on livability (#526 in IL) — a middle-class / working-renter tenant base. Strengths: crime A+, employment A+, housing A+; Watch: schools F, amenities F, commute F.
- Sherrard CUSD 200 (rural): math 29% / reading 30% proficiency, ranked #240 of 620 in IL (top 39%) — low school quality limits family demand, transient renter base, plan for 1-2y turnover.
- Market conditions: 33 active listings in the ZIP; 116 units permitted in Rock Island County in 2024 (50 in 5+ unit buildings).
Forward outlook
- Local home prices are declining (-3.0%/yr); year-one equity from $552 of loan paydown is wiped out by about $2k of value loss. Plan a longer hold.
- Rock Island County population projected at -12% by 2050 — secular population decline; favor cash flow + early exit over multi-decade hold.
- At projected returns (-3.0% appreciation + 3.0% rent growth), your $22k cash investment doubles in ~4 years — after that, you're playing with house money.
Negotiation context
- Only 0 days on market — expect competitive offers; lowballing is unlikely to land.
- 2 sale attempts with the ask held roughly flat each time — persistent listings suggest the price (not the market) is what's stuck; bring a comps-based counter.
Risks & watch-outs
- Watch-outs: property tax is 2.8% of price; built in 1951 — expect roof / HVAC / electrical / plumbing capex.
Questions for the listing agent
- Built in 1951 — when were the roof, HVAC, electrical panel, plumbing, and water heater last replaced?
- Property tax is high relative to price — has the assessment been appealed recently, and will the sale trigger a re-assessment?
- Is there a deadline driving the sale (1031 exchange, divorce, estate, relocation)? That informs how much negotiation room exists.
- Schools are F-rated, which usually means shorter tenancies and higher turnover. Who's the typical renter profile here, and what's been the actual vacancy rate?
- What's the average days-on-market for RENTAL listings here right now (not sales)? A rising rental-DOM trend means longer vacancies and softer asking-rent achievability than the comps imply.
- What's the recent tenant-quality profile in this submarket — average credit score on applications, eviction rate, late-payment / NSF rate, and stable-employment percentage? A property-management company in the area should have these aggregated.
- How much new for-sale + rental construction is in the pipeline within 1–3 miles? Heavy new supply typically softens prices + rents 12–24 months out; constrained supply supports both.
Investment metrics
- 1% rule
- 2.00% ✓
- Cap rate
- 15.62%
- Cash-on-cash
- 33.30%
- DSCR
- 2.48
- GRM
- 4.2
CMA / ARV
No comps found within radius.
Projected returns pro-forma
-3.0% appreciation · 3.0% rent growth · sell at horizon
- IRR
- 28.6%
- Equity multiple
- 2.19×
- Total profit
- $26,667
- Equity at exit
- $11,913
- IRR
- 36.0%
- Equity multiple
- 4.33×
- Total profit
- $74,447
- Equity at exit
- $6,908
Cash invested: $22,372 (down + closing). Projections, not guarantees.
Landlord ↔ Tenant lean methodology
- Overall (STATE)
- 43 Moderately Tenant-Leaning
- State Illinois
- 43 Moderately Tenant-Leaning · D+7
- County
- — inherits STATE
- City
- — inherits STATE
ZIP-level market 61264
- Active inventory
- 33
- Price-to-rent
- 4.2×
Monthly cashflow live
- Estimated rent
- $1,595 medium interval (Pro) →
- Mortgage (P&I)
- −$419
- Tax from tax record
- −$187 /mo · $2,242/yr
- Insurance
- −$33
- HOA
- −$0
- Vacancy / Maint / Mgmt
- −$335
- Net cashflow
- $621
Break-even live
UW: 25.0% down · 7.5% · 30yr · 1.5% tax · 5.0% vac · 8.0% maint · 8.0% mgmt
Financing live
Cash to close
- Down payment
- $19,975
- Closing costs
- $2,397
- Reserves months
- —
- Total cash needed
- —
Loan-product check · same deal, 3 products live
Conventional
25% down · 7.5% · 30yr
- Down + closing
- —
- Monthly P&I
- —
- Monthly cashflow
- —
- DSCR
- —
- Eligible?
- —
Personal DTI + credit; lowest rate.
DSCR
20% down · 8.5% · 30yr
- Down + closing
- —
- Monthly P&I
- —
- Monthly cashflow
- —
- DSCR
- —
- Eligible?
- —
No personal income docs; deal must DSCR.
Hard money
10% down · 12.0% · 12mo
- Down + closing
- —
- Monthly P&I
- —
- Monthly cashflow
- —
- DSCR
- —
- Eligible?
- —
Short-term bridge; refi at stabilization.
Listing history 15 events
-
2026-05-24status Pending
-
2026-05-24status Pending
-
2026-05-23status Pending
-
2026-01-27status Pending
-
2026-01-27soldstatus $71,180 Closed
-
2026-01-27soldstatus $71,180 Closed
-
2026-01-27soldstatus $71,180 Closed
-
2026-01-27soldstatus $71,180 Closed
-
2026-01-27soldstatus $71,180 Closed
-
2026-01-27soldstatus $71,180
-
2025-12-01status Pending
-
2025-11-27historical
-
2025-11-27historical
-
2025-11-20$79,900
-
2025-11-20Active
ⓘ Source: listings_history table (triggers on properties + properties_extension) + one-shot
backfill from property_details.listing_events for pre-trigger history.
Tax reassessment forecast IL · Partial reset (capped growth)
- Current annual tax
- $2,242 · $187/mo
- Projected year-2 tax
- $2,242 · $187/mo
- Expected delta
- $0/yr ($0/mo · 0.0%)
ⓘ Screening estimate from a state-policy table — verify with the county assessor before closing.
Climate risk First Street
- Flood 1/10 Low FEMA zone X (unshaded) · 0% chance over 30 yrs
- Wildfire 1/10 Low
- Heat 3/10 Moderate 7 d/yr ≥103°F today · 16 d/yr by 30 yrs out
- Wind 2/10 Low
- Air quality 2/10 Low 2 unhealthy d/yr today · 2 by 30 yrs out
Nearby sold comps map
Loading sold comps map…
Walkable amenities ~0.75 mi
Loading nearby amenities…
Taxation est. · year 1
- Rental income
- $19,138
- − Mortgage interest
- −$4,476
- − Property taxes
- −$2,242
- − Insurance
- −$400
- − Repairs & maintenance
- −$1,531
- − Management
- −$1,531
- − Depreciation
- −$2,324
- Taxable income
- $6,634
- Est. tax owed @ 24.0%
- −$1,592
- After-tax cash flow
- $5,857/yr
For passive investors: Depreciation is non-cash, so a rental often shows a tax loss while cash-flowing — sheltering income. Rental losses are passive: they offset passive income freely, and up to $25,000/yr can offset ordinary (W-2) income if you actively participate and your MAGI is under $100k (phasing out to $0 by $150k); unused losses carry forward. On sale, claimed depreciation is recaptured at up to 25%, and gains may owe capital-gains tax (a 1031 exchange can defer both). Figures are a year-1 estimate at your 24.0% rate — not tax advice; consult a CPA.
Schools (NCES district)
- District
- Sherrard CUSD 200
- NCES district ID
- 1736180
- Math proficiency
- 29% ▼ -9.00%
- Reading proficiency
- 30% ▼ -16.00%
- Median HH income
- $60,194
- Composite
- 26.77/100
- National rank
- #7129
- State rank
- #240 of 620 in IL
Livability — Coyne Center
- Score
- 67/100
- State rank
- #526
- US rank
- #10896
Category grades
Schools grade is shown separately in the Schools card above.
Census & demographics
- Census place
- Coyne Center, IL
- Population (ZIP)
- 10,056
Population outlook (Rock Island County) Hauer SSP2
- Today (2025)
- 140,982 people
- By 2030
- 137,705 · -2.3%
- By 2040
- 130,512 · -7.4%
- By 2050
- 123,841 · -12.2%
- By 2075
- 109,851 · -22.1%
- By 2100
- 90,922 · -35.5%
Race, ethnicity, and origin ACS 2023
- Neighborhood character
- Predominantly White (89%)
- Race & ethnicity
- White 89% Hispanic / Latino 5% Two or more races 5% Black 1% Asian 1%
- Hispanic origin (detail)
- Mexican 4%
- Common ancestry
- English 3% Romanian 2% Portuguese 2%
- Foreign-born
- 2% · Canada
- Languages at home
- 97% English-only · Spanish 2% Other Asian/Pacific 1%
Political lean MEDSL · Rock Island
- 2024 margin
- Lean D (+9.6) · D 53.9% · R 44.4% · Other 1.7%
- 2008→2024 swing
- -15.0pp toward R · 2008: 24.6pp · 2024: 9.6pp
- All cycles
- 2024: D+9.6 2020: D+12.1 2016: D+8.4 2012: D+21.9 2008: D+24.6
Not yet ingested
- Civics
- —
Market trends
- HPI YoY
- ▼ -126.95%
- Current HPI
- 160.4359
- Rent YoY
- —
- Metro
- —
- State GDP YoY
- ▲ 1.59%
- F500 in state
- 60
Industry mix (Fortune 500 HQ in IL)
| Industry | F500 HQs | Revenue |
|---|---|---|
| Insurance | 4 | $201B |
|
||
| Consumer Goods | 4 | $87B |
|
||
| Industrial Machinery | 3 | $64B |
|
||
| Healthcare | 2 | $55B |
|
||
| Retail / Pharmacy | 1 | $148B |
|
||
| Agriculture / Food | 1 | $86B |
|
||
Price history
-10.9% since first listed15 events — show timeline
- 2026-05-24 Pending — MRED as Distributed by MLS Grid
- 2026-05-24 Pending — MRED as Distributed by MLS Grid
- 2026-05-23 Pending — MRED as Distributed by MLS Grid
- 2026-01-27 Pending — MRED as Distributed by MLS Grid
- 2026-01-27 Sold (Public Records) $71,180 Public Records
- 2026-01-27 Sold (MLS) $71,180 MRED as Distributed by MLS Grid
- 2026-01-27 Sold (MLS) $71,180 MRED as Distributed by MLS Grid
- 2026-01-27 Sold (MLS) $71,180 MRED as Distributed by MLS Grid
- 2026-01-27 Sold (MLS) $71,180 MRED as Distributed by MLS Grid
- 2026-01-27 Sold (MLS) $71,180 MRED as Distributed by MLS Grid
- 2025-12-01 Pending — RMLSA as Distributed by MLS Grid
- 2025-11-27 Listing Removed — RMLSA as Distributed by MLS Grid
- 2025-11-27 Listing Removed — MRED as Distributed by MLS Grid
- 2025-11-20 Listed — RMLSA as Distributed by MLS Grid
- 2025-11-20 Listed $79,900 MRED as Distributed by MLS Grid
Property tax history
+7.0%/yrLatest (2024): $2,242 · +7.1% YoY. Source: county tax records.
Cash-flow waterfall
monthlySold comps — $/sqft
last 12 mo · ≤1 miLoading sold comps…