2550 State Rd. 580 #0417 Plan · Clearwater, FL
Flood risk 1/10 · Minimal
- FEMA flood zone
- X (unshaded)
- Chance of flooding over 30 yrs
- 0.0%
- Est. flood insurance / yr
- $507 – $1,088
Fire risk 1/10 · Minimal
- Est. fire insurance / yr
- $947 – $1,759
Heat risk 10/10 · Severe
- Hot days now (above 107°F)
- 7 days/yr
- Hot days in 30 yrs
- 24 days/yr
Wind risk 10/10 · Severe
- Chance of severe wind over 30 yrs
- 99.0%
Air-quality risk 3/10 · Minor
- Unhealthy air days now
- 3 days/yr
- Unhealthy air days in 30 yrs
- 3 days/yr
Risk factors via First Street. Map © Google.
Why this score? — see what drove the B- grade
The composite is a weighted blend of 9 inputs, each scored 0–100. Each bar is that input's sub-score; the figure is the points it added to the 100-point composite (weight × sub-score).
- Cash flow +27.7/30.0
- DSCR +9.7/10.0
- 1% rule +7.6/10.0
- ARV discount +7.5/15.0
- Condition / age +4.8/5.0
- Schools +4.3/10.0
- Livability +4.1/5.0
- Rent growth +2.5/5.0
- Appreciation +0.0/10.0
$179,995
🖨 Deal sheet (PDF) 📄 Offer letter ✓ Due diligence
Listing remarks
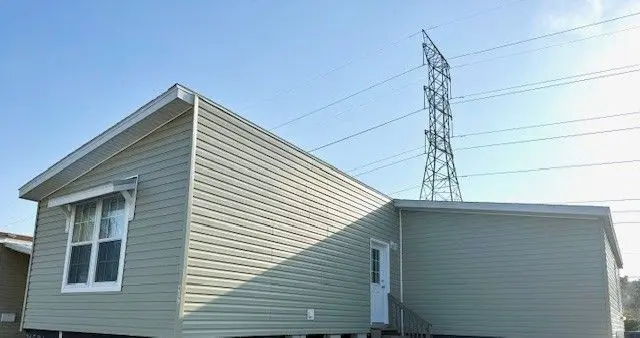
Welcome to Paradise in This Brand-New 2026 Jacobsen Home! This stunning 2-bedroom, 2-bath residence is a must-see, offering over 1,500 square feet of beautifully designed living space. Perfectly positioned along the desirable 4th street perimeter, you ll enjoy extra backyard space and added privacy an uncommon bonus in community living. Step inside and experience comfort and elegance at every turn. The spacious kitchen is a true centerpiece, featuring an oversized island ideal for entertaining or casual dining. Just steps away, the open-concept living room is bathed in natural light, thanks to elegant French doors that create a warm, inviting atmosphere throughout the home. Refined details
Key facts
- French doors
- Backyard space
- Oversized island
Tags
Property features AI
Finance
- Financial info: List price $179,995
Exterior
- Home design: Plan inventory type; Plan name: 2550 State Rd. 580 #0417
Interior
- Bedrooms: 2 bedrooms
- Bathrooms: 2 full bathrooms
- Interior features: Living area of 1568
Neighborhood map
What this means for you Summary
Snapshot
- This is a 2-bed/2.0-bath manufactured listed at $180k. Condition is rated excellent.
Deal economics
- At list price, monthly cash flow is $542 ($7k/yr) — positive.
- The deal already cash-flows at list — no discount required.
- Meets the 1% rule at list price ($2k rent vs $180k).
- Recommended offer: $169k (6.0% below list) — sets the bar for market timing.
- Cap rate 9.9% vs local median 3.0% in Clearwater — top-decile yield for the area; either an underpriced asset or a hidden risk that comps aren't pricing in. Stress-test before assuming the spread holds.
Location & tenants
- Location reads 82/100 on livability (#60 in FL, #988 nationally) — a professional / high-income tenant draw. Strengths: commute A+, housing A+, health & safety A+; Watch: schools C-, employment C-.
- Pinellas (suburban): math 51% / reading 51% proficiency, ranked #31 of 73 in FL (top 42%) — acceptable for families but not a draw, mixed tenant base, ~2y average lease.
- Market conditions: Rents flat; 205 active listings in the ZIP; 27 comparable units currently listed for rent nearby; rentals leasing fast (median 9d on market — plan ~1-2 weeks tenant-placement turnaround); 2,676 units permitted in Pinellas County in 2024 (1,422 in 5+ unit buildings).
- This rent runs 36% of the median local income ($75k/yr) — at the standard rent-burdened threshold; future hikes will face affordability resistance.
Forward outlook
- Local home prices are declining (-3.0%/yr); year-one equity from $1k of loan paydown is wiped out by about $5k of value loss. Plan a longer hold.
- Pinellas County population projected at +14% by 2050 — modest demand growth; plan on rents tracking national, not racing it.
Negotiation context
- It's been on market 82 days — a 6% lower offer ($169k) is reasonable based on typical stale-listing flexibility.
Risks & watch-outs
- Climate carrying-cost: severe wind risk, 99% chance of damaging wind over 30y; extreme-heat days projected 7→24/yr by 2055 (HVAC capex compounding) — expect insurance premiums to compound above CPI over the hold.
Questions for the listing agent
- It's been on market 82 days. Have you received any prior offers? Is the seller open to a 6% concession, seller financing, or rate buy-down credit?
- Why hasn't it sold? Are there any deal-killer items the seller is aware of (foundation, flood, title, zoning, code violations)?
- Is there a deadline driving the sale (1031 exchange, divorce, estate, relocation)? That informs how much negotiation room exists.
- What's the average days-on-market for RENTAL listings here right now (not sales)? A rising rental-DOM trend means longer vacancies and softer asking-rent achievability than the comps imply.
- What's the recent tenant-quality profile in this submarket — average credit score on applications, eviction rate, late-payment / NSF rate, and stable-employment percentage? A property-management company in the area should have these aggregated.
- How much new for-sale + rental construction is in the pipeline within 1–3 miles? Heavy new supply typically softens prices + rents 12–24 months out; constrained supply supports both.
Investment metrics
- 1% rule
- 1.26% ✓
- Cap rate
- 9.91%
- Cash-on-cash
- 12.90%
- DSCR
- 1.57
- GRM
- 6.6
CMA / ARV
No comps found within radius.
Projected returns pro-forma
-3.0% appreciation · 0.11% rent growth · sell at horizon
- IRR
- -0.5%
- Equity multiple
- 0.98×
- Total profit
- $-1,007
- Equity at exit
- $26,838
- IRR
- 5.8%
- Equity multiple
- 1.38×
- Total profit
- $18,961
- Equity at exit
- $15,563
Cash invested: $50,399 (down + closing). Projections, not guarantees.
Landlord ↔ Tenant lean methodology
- Overall (STATE)
- 87 Strongly Landlord-Friendly
- State Florida
- 87 Strongly Landlord-Friendly · R+3
- County
- — inherits STATE
- City
- — inherits STATE
ZIP-level market 33761
- Rents YoY
- 0.1%
- Active inventory
- 205
- Price-to-rent
- 6.6×
Monthly cashflow live
- Estimated rent
- $2,261 high interval (Pro) →
- Mortgage (P&I)
- −$944
- Tax est. 1.5%
- −$225 /mo · $2,700/yr
- Insurance
- −$75
- HOA
- −$0
- Vacancy / Maint / Mgmt
- −$475
- Net cashflow
- $542
Break-even live
Sensitivity live
| Price | -10% $666 | -5% $604 | +0% $542 | +5% $480 | +10% $418 |
|---|---|---|---|---|---|
| Rent | -10% $363 | -5% $453 | +0% $542 | +5% $631 | +10% $720 |
| Rate | -1.0pp $633 | -0.5pp $588 | base $542 | +0.5pp $495 | +1.0pp $448 |
UW: 25.0% down · 7.5% · 30yr · 1.5% tax · 5.0% vac · 8.0% maint · 8.0% mgmt
Financing live
Cash to close
- Down payment
- $44,999
- Closing costs
- $5,400
- Reserves months
- —
- Total cash needed
- —
Loan-product check · same deal, 3 products live
Conventional
25% down · 7.5% · 30yr
- Down + closing
- —
- Monthly P&I
- —
- Monthly cashflow
- —
- DSCR
- —
- Eligible?
- —
Personal DTI + credit; lowest rate.
DSCR
20% down · 8.5% · 30yr
- Down + closing
- —
- Monthly P&I
- —
- Monthly cashflow
- —
- DSCR
- —
- Eligible?
- —
No personal income docs; deal must DSCR.
Hard money
10% down · 12.0% · 12mo
- Down + closing
- —
- Monthly P&I
- —
- Monthly cashflow
- —
- DSCR
- —
- Eligible?
- —
Short-term bridge; refi at stabilization.
Rent comps 27 comps
| Address | Beds | Baths | Sqft | Rent | $/sqft | DOM | Units | Dist |
|---|---|---|---|---|---|---|---|---|
| 2524 Newbern Ave Clearwater, FL | 3.0 | 2.5 | 1740 | $2,800 | $1.61 | 25d | 1 | 0.15mi |
| 2713 Countryside Blvd #108 Clearwater, FL | 2.0 | 2.0 | 1100 | $1,850 | $1.68 | 4d | 1 | 0.46mi |
| 2999 Fieldbrook Pl Clearwater, FL | 2.0 | 2.0 | 1164 | $2,300 | $1.98 | 25d | 1 | 0.52mi |
| 2581 Countryside Blvd Unit 304 Clearwater, FL | 2.0 | 2.0 | 1200 | $2,100 | $1.75 | 25d | 1 | 0.53mi |
| 2773 Cypress Dr Unit C Clearwater, FL | 3.0 | 2.0 | 1507 | $2,400 | $1.59 | 25d | 1 | 0.62mi |
| 2307 Cumberland Cir Clearwater, FL | 1.0–2.0 | 1.0–2.0 | 873 | $2,099 | $2.40 | 4d | 15 | 0.65mi |
| 2561 Forest Run Ct Clearwater, FL | 3.0 | 2.0 | 1145 | $2,000 | $1.75 | 4d | 1 | 0.70mi |
| 2523 North Field Ln Clearwater, FL | 3.0 | 2.5 | 1832 | $2,850 | $1.56 | 8d | 1 | 0.73mi |
| 2690 Enterprise Rd E Clearwater, FL | 1.0–2.0 | 1.0–2.0 | 1051 | $2,564 | $2.44 | 4d | 9 | 0.86mi |
| 2524 Alexander Pl Clearwater, FL | 1.0–3.0 | 1.0–2.0 | 991 | $2,090 | $2.11 | 3d | 20 | 0.86mi |
| 373 Majesty Dr Unit 373 Clearwater, FL | 2.0 | 2.0 | 1200 | $1,600 | $1.33 | 25d | 1 | 0.90mi |
| 2918 Deer Run N Clearwater, FL | 3.0 | 2.0 | 1869 | $2,951 | $1.58 | 19d | 1 | 1.00mi |
| 2386 Sumatran Way #14 Clearwater, FL | 2.0 | 2.0 | 1100 | $1,600 | $1.45 | 19d | 1 | 1.08mi |
| 2384 Tahitian Ln #28 Clearwater, FL | 2.0 | 2.0 | 1400 | $1,700 | $1.21 | 25d | 1 | 1.11mi |
| 3235 Buckhorn Dr Clearwater, FL | 3.0 | 2.0 | 1548 | $3,500 | $2.26 | 5d | 1 | 1.12mi |
| 1112 Glenwood Dr Dunedin, FL | 3.0 | 3.0 | 1670 | $2,700 | $1.62 | 5d | 1 | 1.15mi |
| 2471 Sumatran Way Clearwater, FL | 2.0 | 2.0 | 1400 | $1,500 | $1.07 | 19d | 2 | 1.16mi |
| 2257 Palmwood Dr Dunedin, FL | 3.0 | 2.0 | 1150 | $2,475 | $2.15 | 5d | 1 | 1.19mi |
| 302 Archimedes St Dunedin, FL | 3.0 | 2.0 | 1635 | $3,499 | $2.14 | 5d | 1 | 1.21mi |
| 2460 Persian Dr #44 Clearwater, FL | 2.0 | 2.0 | 1100 | $1,800 | $1.64 | 5d | 1 | 1.24mi |
| 2652 N McMullen Booth Rd Clearwater, FL | 1.0–3.0 | 1.0–2.0 | 1037 | $1,698 | $1.64 | 2d | 15 | 1.27mi |
| 1281 Stony Brook Ln Dunedin, FL | 3.0 | 2.0 | 2040 | $2,600 | $1.27 | 23d | 1 | 1.29mi |
| 2228 Richter St Unit A Dunedin, FL | 2.0 | 2.0 | 1225 | $1,900 | $1.55 | 25d | 1 | 1.30mi |
| 1404 Sandalwood Dr Dunedin, FL | 3.0 | 2.0 | 1553 | $2,900 | $1.87 | 5d | 1 | 1.36mi |
| 3062 Eastland Blvd #202 Clearwater, FL | 2.0 | 2.0 | 1250 | $2,300 | $1.84 | 25d | 1 | 1.37mi |
| 25350 US Highway 19 N Clearwater, FL | 3.0 | 1.0–2.0 | 875 | $1,732 | $1.98 | 3d | 28 | 1.37mi |
| 2363 Israeli Dr #67 Clearwater, FL | 2.0 | 2.0 | 1100 | $1,600 | $1.45 | 25d | 1 | 1.43mi |
Listing history 12 events
-
2026-06-18days on market $179,995 Active 82 DOM
-
2026-06-17days on market $179,995 Active 81 DOM
-
2026-06-16days on market $179,995 Active 80 DOM
-
2026-06-15days on market $179,995 Active 79 DOM
-
2026-06-13days on market $179,995 Active 77 DOM
-
2026-06-09days on market $179,995 Active 73 DOM
-
2026-06-08days on market $179,995 Active 72 DOM
-
2026-06-07days on market $179,995 Active 71 DOM
-
2026-06-04days on market $179,995 Active 68 DOM
-
2026-06-03days on market $179,995 Active 67 DOM
-
2026-06-01days on market $179,995 Active 65 DOM
-
2026-05-31days on market $179,995 Active 64 DOM
ⓘ Source: listings_history table (triggers on properties + properties_extension) + one-shot
backfill from property_details.listing_events for pre-trigger history.
Climate risk First Street
- Flood 1/10 Low FEMA zone X (unshaded) · 0% chance over 30 yrs
- Wildfire 1/10 Low
- Heat 10/10 Extreme 7 d/yr ≥107°F today · 24 d/yr by 30 yrs out
- Wind 10/10 Extreme 99% chance of damaging wind over 30 yrs
- Air quality 3/10 Moderate 3 unhealthy d/yr today · 3 by 30 yrs out
Nearby sold comps map
Loading sold comps map…
Walkable amenities ~0.75 mi
Loading nearby amenities…
Taxation est. · year 1
- Rental income
- $27,126
- − Mortgage interest
- −$10,083
- − Property taxes
- −$2,700
- − Insurance
- −$900
- − Repairs & maintenance
- −$2,170
- − Management
- −$2,170
- − Depreciation
- −$5,236
- Taxable income
- $3,867
- Est. tax owed @ 24.0%
- −$928
- After-tax cash flow
- $5,575/yr
For passive investors: Depreciation is non-cash, so a rental often shows a tax loss while cash-flowing — sheltering income. Rental losses are passive: they offset passive income freely, and up to $25,000/yr can offset ordinary (W-2) income if you actively participate and your MAGI is under $100k (phasing out to $0 by $150k); unused losses carry forward. On sale, claimed depreciation is recaptured at up to 25%, and gains may owe capital-gains tax (a 1031 exchange can defer both). Figures are a year-1 estimate at your 24.0% rate — not tax advice; consult a CPA.
Condition & rehab AI · 13 photos
This brand-new 2026 Jacobsen home is in excellent condition with no visible repairs needed. It offers a great investment opportunity with high resale and rental value.
Value-add opportunities
- Both Painting the exterior siding — Enhances curb appeal and value
- Both Landscaping the front yard — Improves curb appeal and rental value
- Resale Upgrading the kitchen appliances — Modernizes the kitchen and appeals to buyers
- Both Adding a smart home system — Enhances convenience and energy efficiency
Renovation cost estimate screening
Value-add ROI direction
- Both Painting the exterior siding — Enhances curb appeal and value ↑
- Both Landscaping the front yard — Improves curb appeal and rental value ↑
- Resale Upgrading the kitchen appliances — Modernizes the kitchen and appeals to buyers ↑
- Both Adding a smart home system — Enhances convenience and energy efficiency ↑
ⓘ Cost ranges are severity-bucket heuristics (US national rule-of-thumb). Get contractor quotes + a written scope before underwriting a rehab budget.
Schools (NCES district)
- District
- Pinellas
- NCES district ID
- 1201560
- Math proficiency
- 51% ▼ -5.00%
- Reading proficiency
- 51% ▼ -3.00%
- Median HH income
- $46,270
- Composite
- 43.27/100
- National rank
- #3046
- State rank
- #31 of 73 in FL
Livability — Clearwater
- Score
- 82/100
- State rank
- #60
- US rank
- #988
Category grades
Schools grade is shown separately in the Schools card above.
Census & demographics
- County
- Pinellas County · 939,478 people
- City population
- 170,933
- Metro
- Tampa-St. Petersburg-Clearwater, FL
- Population (ZIP)
- 18,290
- Household income
- $74,728
- Rent vs Own
- Severe rent burden
- 336.0
Population outlook (Pinellas County) Hauer SSP2
- Today (2025)
- 1,027,532 people
- By 2030
- 1,063,586 · +3.5%
- By 2040
- 1,125,020 · +9.5%
- By 2050
- 1,168,637 · +13.7%
- By 2075
- 1,265,188 · +23.1%
- By 2100
- 1,260,357 · +22.7%
Race, ethnicity, and origin ACS 2023
- Neighborhood character
- Predominantly White (86%)
- Race & ethnicity
- White 86% Hispanic / Latino 7% Two or more races 6% Asian 4%
- Hispanic origin (detail)
- Puerto Rican 1% Cuban 1%
- Common ancestry
- Romanian 5% Lithuanian 4% Italian 2%
- Foreign-born
- 15% · Canada, Jamaica, Vietnam
- Languages at home
- 83% English-only · Spanish 5% Russian/Polish/Slavic 4% Other Indo-European 3%
Political lean MEDSL · Pinellas
- 2024 margin
- Lean R (+5.2) · D 46.9% · R 52.1%
- 2008→2024 swing
- -13.5pp toward R · 2008: 8.3pp · 2024: -5.2pp
- All cycles
- 2024: R+5.2 2020: D+0.2 2016: R+1.1 2012: D+5.6 2008: D+8.3
Not yet ingested
- Civics
- —
Market trends
- HPI YoY
- ▼ -316.31%
- Current HPI
- 281.6948
- Rent YoY
- ▲ 0.11%
- Metro
- Tampa-St. Petersburg-Clearwater, FL
- State GDP YoY
- ▲ 3.28%
- F500 in state
- 36
Industry mix (Fortune 500 HQ in FL)
| Industry | F500 HQs | Revenue |
|---|---|---|
| Industrial Technology | 2 | $29B |
|
||
| Insurance | 2 | $17B |
|
||
| Retail | 1 | $60B |
|
||
| Technology Distribution | 1 | $58B |
|
||
| Homebuilding | 1 | $35B |
|
||
| Technology Manufacturing | 1 | $35B |
|
||
Cash-flow waterfall
monthlySold comps — $/sqft
last 12 mo · ≤1 miLoading sold comps…