804 1/2 Azelia St · Alamogordo, NM
Flood risk 1/10 · Minimal
- FEMA flood zone
- X (unshaded)
- Chance of flooding over 30 yrs
- 0.0%
- Est. flood insurance / yr
- $507 – $1,088
Fire risk 4/10 · Minor
- Est. fire insurance / yr
- $706 – $1,312
Heat risk 5/10 · Moderate
- Hot days now (above 96°F)
- 7 days/yr
- Hot days in 30 yrs
- 23 days/yr
Wind risk 1/10 · Minimal
- Chance of severe wind over 30 yrs
- —
Air-quality risk 1/10 · Minimal
- Unhealthy air days now
- 0 days/yr
- Unhealthy air days in 30 yrs
- 0 days/yr
Risk factors via First Street. Map © Google.
Why this score? — see what drove the D+ grade
The composite is a weighted blend of 9 inputs, each scored 0–100. Each bar is that input's sub-score; the figure is the points it added to the 100-point composite (weight × sub-score).
- Cash flow +19.6/30.0
- ARV discount +7.5/15.0
- DSCR +6.2/10.0
- 1% rule +5.2/10.0
- Livability +3.9/5.0
- Schools +3.0/10.0
- Rent growth +2.9/5.0
- Condition / age +1.0/5.0
- Appreciation +0.0/10.0
$162,000
🖨 Deal sheet (PDF) 📄 Offer letter ✓ Due diligence
Listing remarks MLS
New Listing! New Roof and New Laminate wood flooring make this a Dream Home for First Time Buyers, retirees, vacation home or great rental for an Investor! Three bedrooms and open living area plus patio and fenced in yard for family fun! Dont miss the Fig Tree and Pomegranate trees. Great views of the mountains from your private back yard! Shed and Carport are a bonus. Well Maintained! New Kitchen Refrigerator does convey! Close to shopping and restaurants! Minutes from Holloman AFB. Call today !!!
Key facts
- 6,011 sq ft lot
- Built 1997
Neighborhood map
What this means for you Summary
Snapshot
- This is a 3-bed/2.0-bath single-family listed at $162k. Condition is rated poor.
Deal economics
- At list price, monthly cash flow is $188 ($2k/yr) — positive.
- The deal already cash-flows at list — no discount required.
- Meets the 1% rule at list price ($2k rent vs $162k).
Location & tenants
- Location reads 77/100 on livability (#5 in NM, #3,233 nationally) — a middle-class / working-renter tenant base. Strengths: commute A+, cost of living A+, housing A+; Watch: crime D, employment D, schools F.
- Alamogordo Public Schools (town): math 26% / reading 39% proficiency, ranked #26 of 95 in NM (top 27%) — families likely to look elsewhere, expect single-tenant / working-renter base with shorter leases.
- Market conditions: Rents rising (+1.6%/yr); 449 active listings in the ZIP; 1 comparable units currently listed for rent nearby; 6 units permitted in Otero County in 2024 (0 in 5+ unit buildings).
- This rent runs 35% of the median local income ($57k/yr) — at the standard rent-burdened threshold; future hikes will face affordability resistance.
Forward outlook
- Local home prices are declining (-3.0%/yr); year-one equity from $1k of loan paydown is wiped out by about $5k of value loss. Plan a longer hold.
- Otero County population projected to shrink 7% by 2050 — rents likely to lag national; underwrite the cash flow, not the appreciation.
Negotiation context
- Only 0 days on market — expect competitive offers; lowballing is unlikely to land.
- 2 sale attempts since 8y ago with the ask held roughly flat each time — persistent listings suggest the price (not the market) is what's stuck; bring a comps-based counter.
Risks & watch-outs
- Climate carrying-cost: extreme-heat days projected 7→23/yr by 2055 (HVAC capex compounding) — expect insurance premiums to compound above CPI over the hold.
Questions for the listing agent
- Have any recent inspections been done? Can we get a copy of the seller's disclosures and any deferred-maintenance estimates?
- Is there a deadline driving the sale (1031 exchange, divorce, estate, relocation)? That informs how much negotiation room exists.
- Schools are F-rated, which usually means shorter tenancies and higher turnover. Who's the typical renter profile here, and what's been the actual vacancy rate?
- Crime grade is D in this area — have there been break-ins, vandalism, or insurance claims at this property in the last 3 years? What carrier currently insures it and at what premium?
- The area grade is low — what's the realistic commute time and amenity access for the typical tenant pool here? Any planned neighborhood developments (good or bad) we should know about?
- What's the average days-on-market for RENTAL listings here right now (not sales)? A rising rental-DOM trend means longer vacancies and softer asking-rent achievability than the comps imply.
- What's the recent tenant-quality profile in this submarket — average credit score on applications, eviction rate, late-payment / NSF rate, and stable-employment percentage? A property-management company in the area should have these aggregated.
- How much new for-sale + rental construction is in the pipeline within 1–3 miles? Heavy new supply typically softens prices + rents 12–24 months out; constrained supply supports both.
Investment metrics
- 1% rule
- 1.02% ✓
- Cap rate
- 7.69%
- Cash-on-cash
- 4.98%
- DSCR
- 1.22
- GRM
- 8.2
CMA / ARV
No comps found within radius.
Projected returns pro-forma
-3.0% appreciation · 1.65% rent growth · sell at horizon
- IRR
- -10.1%
- Equity multiple
- 0.64×
- Total profit
- $-16,456
- Equity at exit
- $24,155
- IRR
- -2.7%
- Equity multiple
- 0.83×
- Total profit
- $-7,651
- Equity at exit
- $14,007
Cash invested: $45,360 (down + closing). Projections, not guarantees.
Landlord ↔ Tenant lean methodology
- Overall (STATE)
- 55 Moderately Landlord-Leaning
- State New Mexico
- 55 Moderately Landlord-Leaning · D+3
- County
- — inherits STATE
- City
- — inherits STATE
ZIP-level market 88310
- Rents YoY
- 1.6%
- Active inventory
- 449
- Price-to-rent
- 8.2×
Monthly cashflow live
- Estimated rent
- $1,655 medium interval (Pro) →
- Mortgage (P&I)
- −$850
- Tax est. 1.5%
- −$202 /mo · $2,430/yr
- Insurance
- −$68
- HOA
- −$0
- Vacancy / Maint / Mgmt
- −$348
- Net cashflow
- $188
Break-even live
Sensitivity live
| Price | -10% $300 | -5% $244 | +0% $188 | +5% $132 | +10% $76 |
|---|---|---|---|---|---|
| Rent | -10% $57 | -5% $123 | +0% $188 | +5% $254 | +10% $319 |
| Rate | -1.0pp $270 | -0.5pp $229 | base $188 | +0.5pp $146 | +1.0pp $104 |
UW: 25.0% down · 7.5% · 30yr · 1.5% tax · 5.0% vac · 8.0% maint · 8.0% mgmt
Financing live
Cash to close
- Down payment
- $40,500
- Closing costs
- $4,860
- Reserves months
- —
- Total cash needed
- —
Loan-product check · same deal, 3 products live
Conventional
25% down · 7.5% · 30yr
- Down + closing
- —
- Monthly P&I
- —
- Monthly cashflow
- —
- DSCR
- —
- Eligible?
- —
Personal DTI + credit; lowest rate.
DSCR
20% down · 8.5% · 30yr
- Down + closing
- —
- Monthly P&I
- —
- Monthly cashflow
- —
- DSCR
- —
- Eligible?
- —
No personal income docs; deal must DSCR.
Hard money
10% down · 12.0% · 12mo
- Down + closing
- —
- Monthly P&I
- —
- Monthly cashflow
- —
- DSCR
- —
- Eligible?
- —
Short-term bridge; refi at stabilization.
Rent comps 1 comps
| Address | Beds | Baths | Sqft | Rent | $/sqft | DOM | Units | Dist |
|---|---|---|---|---|---|---|---|---|
| 2200 1st St Alamogordo, NM | 1.0–3.0 | 1.0–3.0 | 1011 | $1,979 | $1.96 | 5d | 18 | 1.13mi |
Listing history 2 events
-
2026-06-08remarks 153-char remark
-
2026-06-08$162,000 Pending
ⓘ Source: listings_history table (triggers on properties + properties_extension) + one-shot
backfill from property_details.listing_events for pre-trigger history.
Climate risk First Street
- Flood 1/10 Low FEMA zone X (unshaded) · 0% chance over 30 yrs
- Wildfire 4/10 Moderate
- Heat 5/10 Major 7 d/yr ≥96°F today · 23 d/yr by 30 yrs out
- Wind 1/10 Low
- Air quality 1/10 Low 0 unhealthy d/yr today · 0 by 30 yrs out
Nearby sold comps map
Loading sold comps map…
Walkable amenities ~0.75 mi
Loading nearby amenities…
Taxation est. · year 1
- Rental income
- $19,865
- − Mortgage interest
- −$9,075
- − Property taxes
- −$2,430
- − Insurance
- −$810
- − Repairs & maintenance
- −$1,589
- − Management
- −$1,589
- − Depreciation
- −$4,713
- Taxable loss
- −$341
- Est. tax savings @ 24.0%
- +$82
- After-tax cash flow
- $2,341/yr
For passive investors: Depreciation is non-cash, so a rental often shows a tax loss while cash-flowing — sheltering income. Rental losses are passive: they offset passive income freely, and up to $25,000/yr can offset ordinary (W-2) income if you actively participate and your MAGI is under $100k (phasing out to $0 by $150k); unused losses carry forward. On sale, claimed depreciation is recaptured at up to 25%, and gains may owe capital-gains tax (a 1031 exchange can defer both). Figures are a year-1 estimate at your 24.0% rate — not tax advice; consult a CPA.
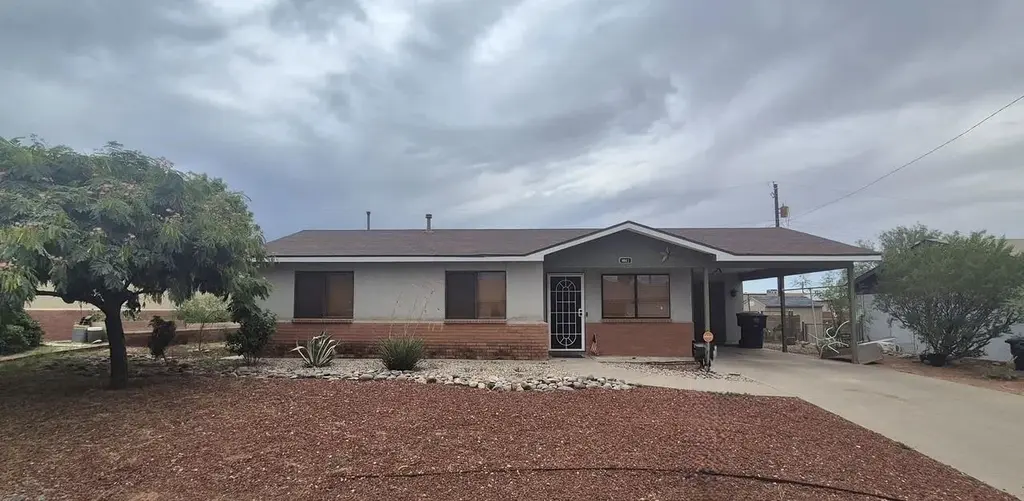
Condition & rehab AI · 1 photo
This home requires extensive repairs and updates to bring it up to a livable condition. Significant investments in the roof, exterior, interior, HVAC, and landscaping are necessary to improve its value.
Repairs flagged
- Major Kitchen — No kitchen visible in the photo.
- Major Bathrooms — No bathrooms visible in the photo.
- Major Roof — No roof visible in the photo.
- Major Exterior — No exterior visible in the photo.
- Major Flooring — No flooring visible in the photo.
- Major Interior walls/paint — No interior walls/paint visible in the photo.
- Major Windows — No windows visible in the photo.
- Major Foundation/structure — No foundation/structure visible in the photo.
- Major HVAC/mechanicals — No HVAC/mechanicals visible in the photo.
- Major Landscaping/curb appeal — No landscaping/curb appeal visible in the photo.
Value-add opportunities
- Both New roof and exterior paint — A new roof and exterior paint would significantly improve the home's curb appeal and overall condition, making it more attractive to buyers and renters.
- Both New flooring and kitchen appliances — Upgrading the flooring and replacing the kitchen appliances would enhance the home's functionality and aesthetic, making it more appealing to both buyers and renters.
- Both Landscaping and curb appeal improvements — Enhancing the landscaping and curb appeal would make the home more inviting and attractive, increasing its resale and rental value.
- Both HVAC and mechanical upgrades — Upgrading the HVAC and mechanical systems would improve the home's comfort and energy efficiency, making it more attractive to buyers and renters.
- Both Interior updates and paint — Updating the interior and painting the walls would improve the home's overall condition and aesthetic, making it more attractive to buyers and renters.
- Both New windows and doors — Replacing old windows and doors with energy-efficient ones would improve the home's energy efficiency and curb appeal, making it more attractive to buyers and renters.
- Both Foundation and structural repairs — Addressing any foundation or structural issues would ensure the home's safety and stability, making it more attractive to buyers and renters.
Renovation cost estimate screening
| Repair item | Severity | Est. cost |
|---|---|---|
| Kitchen · No kitchen visible in the photo. | Major | $15,000–50,000 |
| Bathrooms · No bathrooms visible in the photo. | Major | $15,000–50,000 |
| Roof · No roof visible in the photo. | Major | $15,000–50,000 |
| Exterior · No exterior visible in the photo. | Major | $15,000–50,000 |
| Flooring · No flooring visible in the photo. | Major | $15,000–50,000 |
| Interior walls/paint · No interior walls/paint visible in the photo. | Major | $15,000–50,000 |
| Windows · No windows visible in the photo. | Major | $15,000–50,000 |
| Foundation/structure · No foundation/structure visible in the photo. | Major | $15,000–50,000 |
| HVAC/mechanicals · No HVAC/mechanicals visible in the photo. | Major | $15,000–50,000 |
| Landscaping/curb appeal · No landscaping/curb appeal visible in the photo. | Major | $15,000–50,000 |
| Total estimated repair cost · 10 items | $150,000–500,000 |
Value-add ROI direction
- Both New roof and exterior paint — A new roof and exterior paint would significantly improve the home's curb appeal and overall condition, making it more attractive to buyers and renters. ↑
- Both New flooring and kitchen appliances — Upgrading the flooring and replacing the kitchen appliances would enhance the home's functionality and aesthetic, making it more appealing to both buyers and renters. ↑
- Both Landscaping and curb appeal improvements — Enhancing the landscaping and curb appeal would make the home more inviting and attractive, increasing its resale and rental value. ↑
- Both HVAC and mechanical upgrades — Upgrading the HVAC and mechanical systems would improve the home's comfort and energy efficiency, making it more attractive to buyers and renters. ↑
- Both Interior updates and paint — Updating the interior and painting the walls would improve the home's overall condition and aesthetic, making it more attractive to buyers and renters. ↑
- Both New windows and doors — Replacing old windows and doors with energy-efficient ones would improve the home's energy efficiency and curb appeal, making it more attractive to buyers and renters. ↑
- Both Foundation and structural repairs — Addressing any foundation or structural issues would ensure the home's safety and stability, making it more attractive to buyers and renters. ↑
ⓘ Cost ranges are severity-bucket heuristics (US national rule-of-thumb). Get contractor quotes + a written scope before underwriting a rehab budget.
Schools (NCES district)
- District
- Alamogordo Public Schools
- NCES district ID
- 3500030
- Math proficiency
- 26% —
- Reading proficiency
- 39% —
- Median HH income
- $42,194
- Composite
- 30.24/100
- National rank
- #11572
- State rank
- #26 of 95 in NM
Livability — Alamogordo
- Score
- 77/100
- State rank
- #5
- US rank
- #3233
Category grades
Schools grade is shown separately in the Schools card above.
Census & demographics
- Census place
- Alamogordo, NM
- County
- Otero County · 36,983 people
- City population
- 36,983
- Metro
- Alamogordo, NM
- Population (ZIP)
- 36,983
- Household income
- $57,214
- Rent vs Own
- Severe rent burden
- 1231.0
Population outlook (Otero County) Hauer SSP2
- Today (2025)
- 62,967 people
- By 2030
- 62,164 · -1.3%
- By 2040
- 60,253 · -4.3%
- By 2050
- 58,575 · -7.0%
- By 2075
- 55,411 · -12.0%
- By 2100
- 48,551 · -22.9%
Race, ethnicity, and origin ACS 2023
- Neighborhood character
- Diverse neighborhood (Simpson 0.59)
- Race & ethnicity
- White 56% Hispanic / Latino 31% Two or more races 18% Black 5% Asian 2% Native American 2%
- Hispanic origin (detail)
- Mexican 25%
- Common ancestry
- Slovak 3% Lithuanian 2% Italian 1%
- Foreign-born
- 6% · Canada
- Languages at home
- 85% English-only · Spanish 12% Tagalog/Filipino 1%
Political lean MEDSL · Otero
- 2024 margin
- Strong R (+27.0) · D 35.4% · R 62.4% · Other 2.2%
- 2008→2024 swing
- -7.7pp toward R · 2008: -19.3pp · 2024: -27.0pp
- All cycles
- 2024: R+27.0 2020: R+25.6 2016: R+29.1 2012: R+28.0 2008: R+19.3
Not yet ingested
- Civics
- —
Market trends
- HPI YoY
- ▼ -174.88%
- Current HPI
- 181.737
- Rent YoY
- ▲ 1.65%
- Metro
- Alamogordo, NM
- State GDP YoY
- —
- F500 in state
- 0
Price history
+73.3% since first listed4 events — show timeline
- 2026-06-07 Delisted — OCAOR
- 2026-06-05 Listed $162,000 OCAOR
- 2018-11-30 Sold (MLS) — OCAOR
- 2018-07-02 Listed $93,500 OCAOR
Cash-flow waterfall
monthlySold comps — $/sqft
last 12 mo · ≤1 miLoading sold comps…