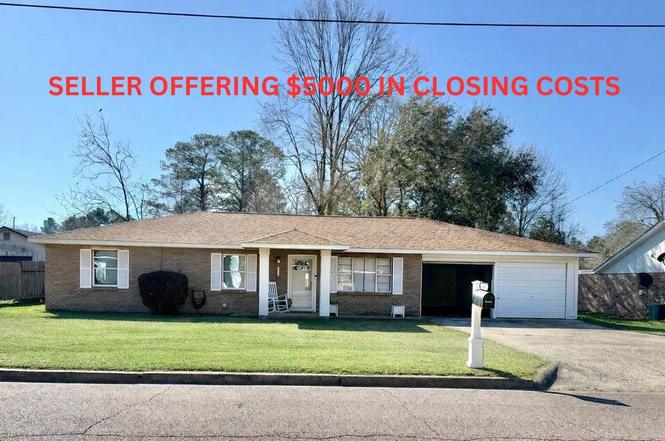
1016 Pinehurst Dr · Columbia, MS
Flood risk 1/10 · Minimal
- FEMA flood zone
- X (unshaded)
- Chance of flooding over 30 yrs
- 0.0%
- Est. flood insurance / yr
- $507 – $1,088
Fire risk 4/10 · Minor
- Est. fire insurance / yr
- $1,241 – $2,305
Heat risk 8/10 · Major
- Hot days now (above 111°F)
- 7 days/yr
- Hot days in 30 yrs
- 21 days/yr
Wind risk 8/10 · Major
- Chance of severe wind over 30 yrs
- 99.0%
Air-quality risk 1/10 · Minimal
- Unhealthy air days now
- 0 days/yr
- Unhealthy air days in 30 yrs
- 0 days/yr
Risk factors via First Street. Map © Google.
Why this score? — see what drove the D- grade
The composite is a weighted blend of 9 inputs, each scored 0–100. Each bar is that input's sub-score; the figure is the points it added to the 100-point composite (weight × sub-score).
- Cash flow +14.2/30.0
- ARV discount +5.8/15.0
- DSCR +4.3/10.0
- Schools +3.2/10.0
- Livability +3.2/5.0
- 1% rule +3.1/10.0
- Rent growth +2.5/5.0
- Condition / age +2.5/5.0
- Appreciation +0.0/10.0
$169,000
🖨 Deal sheet 📄 Offer letter ✓ Due diligence
Listing remarks
Beautifully updated 4 BR/2 BA brick home in the wonderful Sunset Circle. An older established neighborhood with a lot of charm and appeal. This home features a spacious open floor plan perfect for entertaining and everyday living. The bright and airy living area flows seamlessly into the dining area and kitchen creating a warm and inviting atmosphere. In addition, there is a den w/ sliding door going out onto the covered patio. Large fenced in backyard, great for children playing and pets. A 2- car garage with 2 garage doors. This home is truly move-in ready and offers the perfect combination of style, comfort and functionality. Don't miss your opportunity to make it yours.
Key facts
- Open floor plan
- Fenced in backyard
- Covered patio
Tags
Neighborhood map
What this means for you Summary
Snapshot
- This is a 4-bed/1.0-bath single-family listed at $169k.
Deal economics
- At list price, monthly cash flow is $26 ($318/yr) — positive.
- The deal already cash-flows at list — no discount required.
- To meet the 1% rule (rent ≥ 1% of price), the offer needs to be $137k (18.7% below list).
- Recommended offer: $137k (18.7% below list) — sets the bar for 1% rule.
Location & tenants
- Location reads 63/100 on livability (#154 in MS) — a middle-class / working-renter tenant base. Strengths: cost of living A+, crime B, housing B; Watch: schools D, health & safety D, amenities F.
- Columbia School District (town): math 39% / reading 39% proficiency, ranked #45 of 130 in MS (top 35%) — families likely to look elsewhere, expect single-tenant / working-renter base with shorter leases; 67% free/reduced lunch — lower-income household profile, screen leases tightly.
- Market conditions: 133 active listings in the ZIP; 2 units permitted in Marion County in 2024 (0 in 5+ unit buildings).
Forward outlook
- Local home prices are declining (-3.0%/yr); year-one equity from $1k of loan paydown is wiped out by about $5k of value loss. Plan a longer hold.
- Marion County population projected at -33% by 2050 — secular population decline; favor cash flow + early exit over multi-decade hold.
Negotiation context
- It's been on market 44 days — a 3% lower offer ($164k) is reasonable based on typical stale-listing flexibility.
Risks & watch-outs
- Climate carrying-cost: severe wind risk, 99% chance of damaging wind over 30y; extreme-heat days projected 7→21/yr by 2055 (HVAC capex compounding) — expect insurance premiums to compound above CPI over the hold.
Questions for the listing agent
- It's been on market 44 days. Have you received any prior offers? Is the seller open to a 19% concession, seller financing, or rate buy-down credit?
- Built in 1970 — when were the roof, HVAC, electrical panel, plumbing, and water heater last replaced?
- Is there a deadline driving the sale (1031 exchange, divorce, estate, relocation)? That informs how much negotiation room exists.
- Schools are D-rated, which usually means shorter tenancies and higher turnover. Who's the typical renter profile here, and what's been the actual vacancy rate?
- The area grade is low — what's the realistic commute time and amenity access for the typical tenant pool here? Any planned neighborhood developments (good or bad) we should know about?
- What's the average days-on-market for RENTAL listings here right now (not sales)? A rising rental-DOM trend means longer vacancies and softer asking-rent achievability than the comps imply.
- What's the recent tenant-quality profile in this submarket — average credit score on applications, eviction rate, late-payment / NSF rate, and stable-employment percentage? A property-management company in the area should have these aggregated.
- How much new for-sale + rental construction is in the pipeline within 1–3 miles? Heavy new supply typically softens prices + rents 12–24 months out; constrained supply supports both.
Investment metrics
- 1% rule
- 0.81% ✗
- Cap rate
- 6.48%
- Cash-on-cash
- 0.67%
- DSCR
- 1.03
- GRM
- 10.3
CMA / ARV
- ARV (on-the-fly)
- $162,750
- Comps found
- 1
Show comp detail 1 sale within ~0.75 mi
| Address | Dist | Beds/Ba | Sqft | Sold | Price | $/sf | Match |
|---|---|---|---|---|---|---|---|
| 1011 Chickasaw Trl | 0.28mi | 4/2.0 | 1,688 (+9%) | 18mo | $178,000 | $105 | 53 |
Match score weights: distance 35% · size 25% · config 20% · recency 20%. Top-matched comps best support the ARV.
Projected returns pro-forma
-3.0% appreciation · 3.0% rent growth · sell at horizon
- IRR
- -15.3%
- Equity multiple
- 0.46×
- Total profit
- $-25,745
- Equity at exit
- $25,198
- IRR
- -6.8%
- Equity multiple
- 0.57×
- Total profit
- $-20,436
- Equity at exit
- $14,612
Cash invested: $47,320 (down + closing). Projections, not guarantees.
Landlord ↔ Tenant lean methodology
- Overall (STATE)
- 90 Strongly Landlord-Friendly
- State Mississippi
- 90 Strongly Landlord-Friendly · R+11
- County
- — inherits STATE
- City
- — inherits STATE
ZIP-level market 39429
- Active inventory
- 133
- Price-to-rent
- 10.3×
Monthly cashflow live
- Estimated rent
- $1,373 medium interval (Pro) →
- Mortgage (P&I)
- −$886
- Tax from tax record
- −$102 /mo · $1,220/yr
- Insurance
- −$70
- HOA
- −$0
- Vacancy / Maint / Mgmt
- −$288
- Net cashflow
- $26
Break-even live
UW: 25.0% down · 7.5% · 30yr · 1.5% tax · 5.0% vac · 8.0% maint · 8.0% mgmt
Financing live
Cash to close
- Down payment
- $42,250
- Closing costs
- $5,070
- Reserves months
- —
- Total cash needed
- —
Loan-product check · same deal, 3 products live
Conventional
25% down · 7.5% · 30yr
- Down + closing
- —
- Monthly P&I
- —
- Monthly cashflow
- —
- DSCR
- —
- Eligible?
- —
Personal DTI + credit; lowest rate.
DSCR
20% down · 8.5% · 30yr
- Down + closing
- —
- Monthly P&I
- —
- Monthly cashflow
- —
- DSCR
- —
- Eligible?
- —
No personal income docs; deal must DSCR.
Hard money
10% down · 12.0% · 12mo
- Down + closing
- —
- Monthly P&I
- —
- Monthly cashflow
- —
- DSCR
- —
- Eligible?
- —
Short-term bridge; refi at stabilization.
Listing history 3 events
-
2026-04-12status Pending
-
2026-03-24price $169,000
-
2026-02-27$175,000 Active
ⓘ Source: listings_history table (triggers on properties + properties_extension) + one-shot
backfill from property_details.listing_events for pre-trigger history.
Tax reassessment forecast MS · Resets to sale price
- Current annual tax
- $1,220 · $102/mo
- Projected year-2 tax
- $1,335 · $111/mo
- Expected delta
- +$115/yr (+$10/mo · 9.5%)
ⓘ Screening estimate from a state-policy table — verify with the county assessor before closing.
Climate risk First Street
- Flood 1/10 Low FEMA zone X (unshaded) · 0% chance over 30 yrs
- Wildfire 4/10 Moderate
- Heat 8/10 Severe 7 d/yr ≥111°F today · 21 d/yr by 30 yrs out
- Wind 8/10 Severe 99% chance of damaging wind over 30 yrs
- Air quality 1/10 Low 0 unhealthy d/yr today · 0 by 30 yrs out
Nearby sold comps map
Loading sold comps map…
Walkable amenities ~0.75 mi
Loading nearby amenities…
Taxation est. · year 1
- Rental income
- $16,478
- − Mortgage interest
- −$9,467
- − Property taxes
- −$1,220
- − Insurance
- −$845
- − Repairs & maintenance
- −$1,318
- − Management
- −$1,318
- − Depreciation
- −$4,916
- Taxable loss
- −$2,606
- Est. tax savings @ 24.0%
- +$625
- After-tax cash flow
- $943/yr
For passive investors: Depreciation is non-cash, so a rental often shows a tax loss while cash-flowing — sheltering income. Rental losses are passive: they offset passive income freely, and up to $25,000/yr can offset ordinary (W-2) income if you actively participate and your MAGI is under $100k (phasing out to $0 by $150k); unused losses carry forward. On sale, claimed depreciation is recaptured at up to 25%, and gains may owe capital-gains tax (a 1031 exchange can defer both). Figures are a year-1 estimate at your 24.0% rate — not tax advice; consult a CPA.
Schools (NCES district)
- District
- Columbia School District
- NCES district ID
- 2801170
- Math proficiency
- 39% ▼ -9.00%
- Reading proficiency
- 39% ▼ -3.00%
- Median HH income
- $31,192
- Composite
- 31.87/100
- National rank
- #5866
- State rank
- #45 of 130 in MS
Livability — Columbia
- Score
- 63/100
- State rank
- #154
- US rank
- #15293
Category grades
Schools grade is shown separately in the Schools card above.
Census & demographics
- Census place
- Columbia, MS
- Population (ZIP)
- 16,583
Population outlook (Marion County) Hauer SSP2
- Today (2025)
- 22,813 people
- By 2030
- 21,301 · -6.6%
- By 2040
- 18,176 · -20.3%
- By 2050
- 15,215 · -33.3%
- By 2075
- 9,388 · -58.8%
- By 2100
- 5,335 · -76.6%
Race, ethnicity, and origin ACS 2023
- Neighborhood character
- Majority White (62%)
- Race & ethnicity
- White 62% Black 34% Two or more races 2% Hispanic / Latino 1%
- Common ancestry
- Lithuanian 2% Serbian 1% Slovak 1%
- Foreign-born
- 1% · Canada
- Languages at home
- 98% English-only · Spanish 1%
Political lean MEDSL · Marion
- 2024 margin
- Solid R (+41.6) · D 28.7% · R 70.4%
- 2008→2024 swing
- -10.2pp toward R · 2008: -31.4pp · 2024: -41.6pp
- All cycles
- 2024: R+41.6 2020: R+36.8 2016: R+36.0 2012: R+29.8 2008: R+31.4
Not yet ingested
- Civics
- —
Market trends
- HPI YoY
- ▼ -88.11%
- Current HPI
- 132.3278
- Rent YoY
- —
- Metro
- —
- State GDP YoY
- —
- F500 in state
- 0
Price history
-3.4% since first listed3 events — show timeline
- 2026-04-12 Pending — HAAR
- 2026-03-24 Price Changed $169,000 HAAR
- 2026-02-27 Listed $175,000 HAAR
Property tax history
+5.0%/yrLatest (2025): $1,220 · +26.4% YoY. Source: county tax records.
Cash-flow waterfall
monthlySold comps — $/sqft
last 12 mo · ≤1 miLoading sold comps…