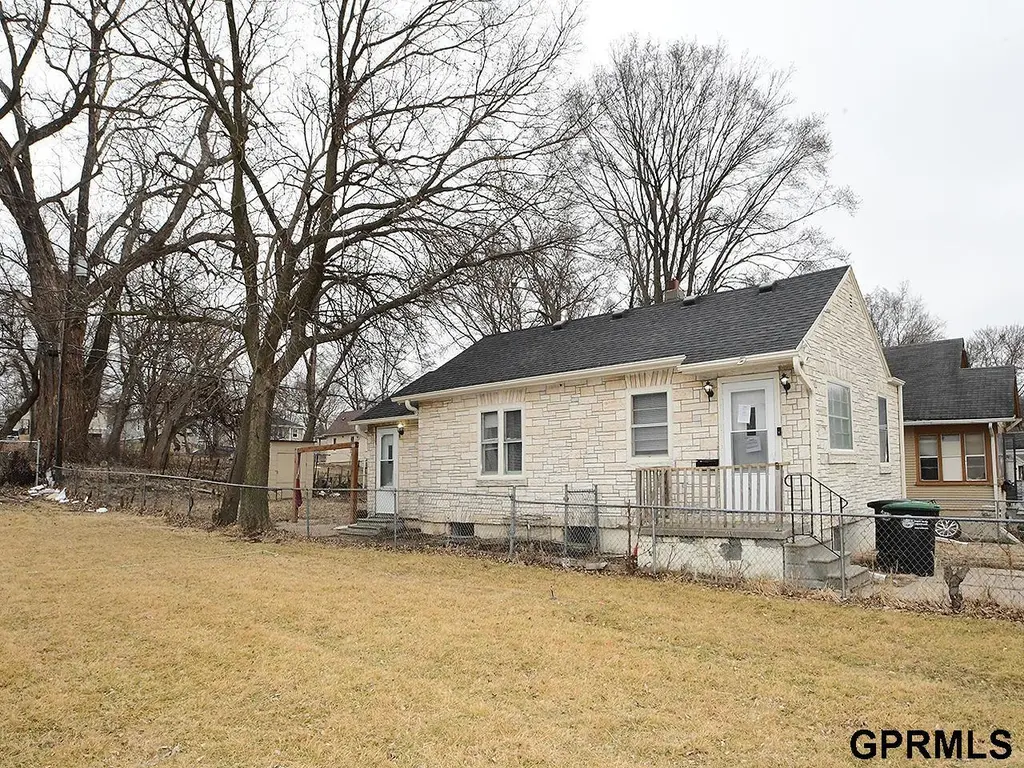
5337 N 35th St · Omaha, NE
Flood risk 1/10 · Minimal
- FEMA flood zone
- X (unshaded)
- Chance of flooding over 30 yrs
- 0.0%
- Est. flood insurance / yr
- $473 – $860
Fire risk 1/10 · Minimal
- Est. fire insurance / yr
- $1,161 – $2,155
Heat risk 3/10 · Minor
- Hot days now (above 105°F)
- 7 days/yr
- Hot days in 30 yrs
- 15 days/yr
Wind risk 2/10 · Minimal
- Chance of severe wind over 30 yrs
- —
Air-quality risk 2/10 · Minimal
- Unhealthy air days now
- 0 days/yr
- Unhealthy air days in 30 yrs
- 1 days/yr
Risk factors via First Street. Map © Google.
Why this score? — see what drove the B- grade
The composite is a weighted blend of 9 inputs, each scored 0–100. Each bar is that input's sub-score; the figure is the points it added to the 100-point composite (weight × sub-score).
- Cash flow +19.9/30.0
- ARV discount +15.0/15.0
- Appreciation +10.0/10.0
- DSCR +6.3/10.0
- 1% rule +5.4/10.0
- Livability +4.2/5.0
- Rent growth +3.3/5.0
- Condition / age +2.5/5.0
- Schools +2.1/10.0
$139,000
🖨 Deal sheet 📄 Offer letter ✓ Due diligence
Listing remarks MLS
Short sale opportunity with strong upside. This 3 bedroom, 2 bathroom home features a timeless all stone exterior and solid curb appeal. The main level offers durable LVP flooring and an updated kitchen with new cabinets and modern touches. A great option for buyers looking to build equity or investors seeking value. Property is being sold as a short sale and is subject to lender approval.
Key facts
- New cabinets
- Stone exterior
- Updated kitchen
Tags
Neighborhood map
What this means for you Summary
Snapshot
- This is a 2-bed/1.5-bath single-family listed at $139k.
Deal economics
- At list price, monthly cash flow is $168 ($2k/yr) — positive.
- The deal already cash-flows at list — no discount required.
- Meets the 1% rule at list price ($1k rent vs $139k).
- Recommended offer: $126k (9.0% below list) — sets the bar for market timing.
- Cap rate 7.7% vs local median 3.6% in Omaha — top-decile yield for the area; either an underpriced asset or a hidden risk that comps aren't pricing in. Stress-test before assuming the spread holds.
Location & tenants
- Location reads 84/100 on livability (#7 in NE, #663 nationally) — a professional / high-income tenant draw. Strengths: amenities A+, commute A+, cost of living A+; Watch: crime F.
- Omaha Public Schools (urban): math 20% / reading 28% proficiency, ranked #110 of 111 in NE (top 99%) — low school quality limits family demand, transient renter base, plan for 1-2y turnover; 62% free/reduced lunch — lower-income household profile, screen leases tightly.
- Market conditions: Rents rising (+3.2%/yr); 139 active listings in the ZIP; 23 comparable units currently listed for rent nearby; rentals at typical pace (median 24d on market — plan ~3-4 weeks tenant-placement turnaround); lower-income renter base — watch delinquency; 4,539 units permitted in Douglas County in 2024 (2,583 in 5+ unit buildings).
- This rent runs 41% of the median local income ($42k/yr) — at the standard rent-burdened threshold; future hikes will face affordability resistance.
Forward outlook
- In year one you build about $15k of equity ($961 loan paydown + $14k appreciation (10.0% local appreciation)).
- Douglas County population projected at +28% by 2050 — long-run rental-demand tailwind backs the buy-and-hold thesis.
- At projected returns (10.0% appreciation + 3.2% rent growth), your $39k cash investment doubles in ~3 years — after that, you're playing with house money.
- By year 3, paydown + projected appreciation supports a ~$38k cash-out refi (75% LTV) — recoverable capital for the next deal without selling this one.
Negotiation context
- It's been on market 106 days — a 9% lower offer ($126k) is reasonable based on typical stale-listing flexibility.
- 6 sale attempts since 7y ago; this cycle's ask has dropped $10k (7%) from the opening price — seller is motivated, your offer sets the floor, not the list.
Risks & watch-outs
- Watch-outs: built in 1920 — expect roof / HVAC / electrical / plumbing capex.
Questions for the listing agent
- It's been on market 106 days. Have you received any prior offers? Is the seller open to a 9% concession, seller financing, or rate buy-down credit?
- Built in 1920 — when were the roof, HVAC, electrical panel, plumbing, and water heater last replaced?
- Why hasn't it sold? Are there any deal-killer items the seller is aware of (foundation, flood, title, zoning, code violations)?
- Is there a deadline driving the sale (1031 exchange, divorce, estate, relocation)? That informs how much negotiation room exists.
- Crime grade is F in this area — have there been break-ins, vandalism, or insurance claims at this property in the last 3 years? What carrier currently insures it and at what premium?
- What's the average days-on-market for RENTAL listings here right now (not sales)? A rising rental-DOM trend means longer vacancies and softer asking-rent achievability than the comps imply.
- What's the recent tenant-quality profile in this submarket — average credit score on applications, eviction rate, late-payment / NSF rate, and stable-employment percentage? A property-management company in the area should have these aggregated.
- How much new for-sale + rental construction is in the pipeline within 1–3 miles? Heavy new supply typically softens prices + rents 12–24 months out; constrained supply supports both.
Investment metrics
- 1% rule
- 1.04% ✓
- Cap rate
- 7.75%
- Cash-on-cash
- 5.19%
- DSCR
- 1.23
- GRM
- 8.0
CMA / ARV
- ARV (median comp)
- $191,594
- List price
- $139,000
- Delta
- -27.45%
- Verdict
- UNDERPRICED
- Comps
- 20 within 1.0 mi
Show comp detail 12 sales within ~0.75 mi
| Address | Dist | Beds/Ba | Sqft | Sold | Price | $/sf | Match |
|---|---|---|---|---|---|---|---|
| 5302 N 39th Cir | 0.35mi | 3/2.0 (+1) | 1,300 (+1%) | 5mo | $120,000 | $92 | 72 |
| 3071 Arcadia Ave | 0.42mi | 3/1.5 (+1) | 1,301 (+1%) | 4mo | $115,000 | $88 | 71 |
| 3468 Fowler Cir | 0.43mi | 3/1.5 (+1) | 1,220 (-6%) | 0mo | $225,000 | $184 | 65 |
| 5202 N 33 St | 0.21mi | 3/1.0 (+1) | 1,428 (+10%) | 6mo | $168,000 | $118 | 61 |
| 3302 Larimore Ave | 0.41mi | 3/2.0 (+1) | 1,404 (+9%) | 1mo | $137,000 | $98 | 58 |
| 6341 N 37th St | 0.66mi | 3/1.0 (+1) | 1,332 (+3%) | 2mo | $155,000 | $116 | 55 |
| 5611 N 27th St | 0.70mi | 3/1.5 (+1) | 1,248 (-3%) | 4mo | $200,000 | $160 | 53 |
| 4319 N 32nd St | 0.73mi | 2/2.0 | 1,372 (+6%) | 6mo | $160,000 | $117 | 49 |
| 5208 N 28th Ave | 0.55mi | 3/1.0 (+1) | 1,150 (-11%) | 2mo | $130,000 | $113 | 48 |
| 5307 N 42nd St | 0.56mi | 3/1.0 (+1) | 1,120 (-13%) | 2mo | $177,000 | $158 | 43 |
| 6520 N 33 St | 0.72mi | 3/1.0 (+1) | 1,404 (+9%) | 4mo | $150,000 | $107 | 41 |
| 3167 Curtis Ave | 0.58mi | 3/1.0 (+1) | 1,132 (-12%) | 6mo | $130,000 | $115 | 41 |
Match score weights: distance 35% · size 25% · config 20% · recency 20%. Top-matched comps best support the ARV.
Projected returns pro-forma
10.0% appreciation · 3.22% rent growth · sell at horizon
- IRR
- 28.1%
- Equity multiple
- 3.23×
- Total profit
- $86,773
- Equity at exit
- $125,222
- IRR
- 24.6%
- Equity multiple
- 7.37×
- Total profit
- $247,811
- Equity at exit
- $270,046
Cash invested: $38,920 (down + closing). Projections, not guarantees.
Landlord ↔ Tenant lean methodology
- Overall (STATE)
- 83 Strongly Landlord-Friendly
- State Nebraska
- 83 Strongly Landlord-Friendly · R+13
- County
- — inherits STATE
- City
- — inherits STATE
ZIP-level market 68111
- Home prices YoY
- 4.0%
- Rents YoY
- 3.2%
- Active inventory
- 139
- Price-to-rent
- 8.0×
Monthly cashflow live
- Estimated rent
- $1,442 high interval (Pro) →
- Mortgage (P&I)
- −$729
- Tax from tax record
- −$184 /mo · $2,205/yr
- Insurance
- −$58
- HOA
- −$0
- Vacancy / Maint / Mgmt
- −$303
- Net cashflow
- $168
Break-even live
UW: 25.0% down · 7.5% · 30yr · 1.5% tax · 5.0% vac · 8.0% maint · 8.0% mgmt
Financing live
Cash to close
- Down payment
- $34,750
- Closing costs
- $4,170
- Reserves months
- —
- Total cash needed
- —
Loan-product check · same deal, 3 products live
Conventional
25% down · 7.5% · 30yr
- Down + closing
- —
- Monthly P&I
- —
- Monthly cashflow
- —
- DSCR
- —
- Eligible?
- —
Personal DTI + credit; lowest rate.
DSCR
20% down · 8.5% · 30yr
- Down + closing
- —
- Monthly P&I
- —
- Monthly cashflow
- —
- DSCR
- —
- Eligible?
- —
No personal income docs; deal must DSCR.
Hard money
10% down · 12.0% · 12mo
- Down + closing
- —
- Monthly P&I
- —
- Monthly cashflow
- —
- DSCR
- —
- Eligible?
- —
Short-term bridge; refi at stabilization.
Rent comps 23 comps
| Address | Beds | Baths | Sqft | Rent | $/sqft | DOM | Units | Dist |
|---|---|---|---|---|---|---|---|---|
| 4707 N 40th Ave Omaha, NE | 3.0 | 1.0 | 1337 | $1,500 | $1.12 | 21d | 1 | 0.60mi |
| 3901 Curtis Ave Omaha, NE | 2.0 | 2.5 | 1745 | $1,850 | $1.06 | 2d | 1 | 0.61mi |
| 6124 N 30th St Unit STREET2 Omaha, NE | 2.0 | 1.0 | 1190 | $1,075 | $0.90 | 43d | 1 | 0.64mi |
| 2873 Kansas Ave Omaha, NE | 3.0 | 2.0 | 1112 | $1,450 | $1.30 | 23d | 1 | 0.64mi |
| 4018 Bauman Ave Omaha, NE | 3.0 | 1.0 | 925 | $1,380 | $1.49 | 43d | 1 | 0.86mi |
| 4470 Redman Ave Unit 4470A Omaha, NE | 2.0 | 1.5 | 980 | $1,050 | $1.07 | 10d | 1 | 0.88mi |
| 2436 Laurel Ave Omaha, NE | 3.0 | 1.0 | 1582 | $1,495 | $0.95 | 23d | 1 | 0.91mi |
| 3164 Ida St Omaha, NE | 3.0 | 1.0 | 946 | $1,600 | $1.69 | 1d | 1 | 0.96mi |
| 3164 Ida St Omaha, NE | 3.0 | 1.0 | 946 | $1,600 | $1.69 | 43d | 1 | 0.96mi |
| 3164 Ida St Omaha, NE | 3.0 | 1.0 | 946 | $1,600 | $1.69 | 10d | 1 | 0.96mi |
| 2723 Newport Ave Omaha, NE | 2.0 | 1.0 | 1079 | $1,450 | $1.34 | 1d | 1 | 0.99mi |
| 4657 Camden Ave Omaha, NE | 3.0 | 1.0 | 1250 | $1,500 | $1.20 | 43d | 1 | 1.06mi |
| 3501 Weber Cir Omaha, NE | 3.0 | 2.0 | 1600 | $1,700 | $1.06 | 10d | 1 | 1.19mi |
| 3030 Ernst St Omaha, NE | 3.0 | 2.0 | 1500 | $1,500 | $1.00 | 2d | 1 | 1.22mi |
| 4201 N 22nd St Omaha, NE | 3.0 | 1.0 | 1380 | $1,545 | $1.12 | 43d | 1 | 1.31mi |
| 4918 Ames Ave Apt 13 Omaha, NE | 1.0 | 1.0 | 974 | $750 | $0.77 | 43d | 1 | 1.32mi |
| 4918 Ames Ave Unit 17 Omaha, NE | 2.0 | 1.5 | 1074 | $850 | $0.79 | 23d | 1 | 1.32mi |
| 3323 N 40th St Omaha, NE | 2.0 | 1.0 | 1000 | $1,575 | $1.57 | 2d | 1 | 1.34mi |
| 4852 Boyd St Omaha, NE | 2.0 | 2.0 | 912 | $1,500 | $1.64 | 43d | 1 | 1.37mi |
| 3535 N 45th Ave Omaha, NE | 3.0 | 1.0 | 1325 | $1,800 | $1.36 | 43d | 1 | 1.41mi |
| 3212 N 39th St Omaha, NE | 1.0 | 1.0 | 1025 | $785 | $0.77 | 23d | 1 | 1.45mi |
| 3808 N 48th St Omaha, NE | 3.0 | 2.0 | 1400 | $2,000 | $1.43 | 2d | 1 | 1.47mi |
| 4125 N 19th St Omaha, NE | 3.0 | 1.0 | 1266 | $1,532 | $1.21 | 43d | 1 | 1.48mi |
Listing history 30 events
-
2026-06-18days on market $139,000 Active 106 DOM
-
2026-06-17days on market $139,000 Active 105 DOM
-
2026-06-16days on market $139,000 Active 104 DOM
-
2026-06-15days on market $139,000 Active 103 DOM
-
2026-06-13days on market $139,000 Active 101 DOM
-
2026-06-10days on market $139,000 Active 98 DOM
-
2026-06-09days on market $139,000 Active 97 DOM
-
2026-06-08days on market $139,000 Active 96 DOM
-
2026-06-07days on market $139,000 Active 95 DOM
-
2026-06-03days on market $139,000 Active 91 DOM
-
2026-06-03days on market $139,000 Active 90 DOM
-
2026-06-01days on market $139,000 Active 89 DOM
-
2026-06-01days on market $139,000 Active 88 DOM
-
2026-04-02price $139,000 392-char remark
Show marketing remark (392 chars)
Short sale opportunity with strong upside. This 3 bedroom, 2 bathroom home features a timeless all stone exterior and solid curb appeal. The main level offers durable LVP flooring and an updated kitchen with new cabinets and modern touches. A great option for buyers looking to build equity or investors seeking value. Property is being sold as a short sale and is subject to lender approval.
-
2026-03-04$149,000 New 392-char remark
Show marketing remark (392 chars)
Short sale opportunity with strong upside. This 3 bedroom, 2 bathroom home features a timeless all stone exterior and solid curb appeal. The main level offers durable LVP flooring and an updated kitchen with new cabinets and modern touches. A great option for buyers looking to build equity or investors seeking value. Property is being sold as a short sale and is subject to lender approval.
-
2026-02-01historical
-
2025-12-08price $159,900
-
2025-10-31$164,900 New
-
2024-10-31soldstatus $160,000
-
2024-10-08soldstatus $160,000 Sold
-
2024-09-09status Pending
-
2024-08-30$165,000 New
-
2020-10-16historical
-
2020-09-11$118,000 Active - New
-
2019-11-05soldstatus $99,000
-
2019-11-01soldstatus $99,000 Sold
-
2019-09-23status Pending
-
2019-09-03status Back On Market
-
2019-08-12status Pending
-
2019-08-05$99,000 Active - New
ⓘ Source: listings_history table (triggers on properties + properties_extension) + one-shot
backfill from property_details.listing_events for pre-trigger history.
Tax reassessment forecast NE · Resets to sale price
- Current annual tax
- $2,205 · $184/mo
- Projected year-2 tax
- $2,405 · $200/mo
- Expected delta
- +$199/yr (+$17/mo · 9.0%)
ⓘ Screening estimate from a state-policy table — verify with the county assessor before closing.
Climate risk First Street
- Flood 1/10 Low FEMA zone X (unshaded) · 0% chance over 30 yrs
- Wildfire 1/10 Low
- Heat 3/10 Moderate 7 d/yr ≥105°F today · 15 d/yr by 30 yrs out
- Wind 2/10 Low
- Air quality 2/10 Low 0 unhealthy d/yr today · 1 by 30 yrs out
Nearby sold comps map
Loading sold comps map…
Walkable amenities ~0.75 mi
Loading nearby amenities…
Taxation est. · year 1
- Rental income
- $17,301
- − Mortgage interest
- −$7,786
- − Property taxes
- −$2,205
- − Insurance
- −$695
- − Repairs & maintenance
- −$1,384
- − Management
- −$1,384
- − Depreciation
- −$4,044
- Taxable loss
- −$197
- Est. tax savings @ 24.0%
- +$47
- After-tax cash flow
- $2,068/yr
For passive investors: Depreciation is non-cash, so a rental often shows a tax loss while cash-flowing — sheltering income. Rental losses are passive: they offset passive income freely, and up to $25,000/yr can offset ordinary (W-2) income if you actively participate and your MAGI is under $100k (phasing out to $0 by $150k); unused losses carry forward. On sale, claimed depreciation is recaptured at up to 25%, and gains may owe capital-gains tax (a 1031 exchange can defer both). Figures are a year-1 estimate at your 24.0% rate — not tax advice; consult a CPA.
Schools (NCES district)
- District
- Omaha Public Schools
- NCES district ID
- 3174820
- Math proficiency
- 20% ▼ -10.00%
- Reading proficiency
- 28% ▼ -5.00%
- Median HH income
- $46,039
- Composite
- 20.83/100
- National rank
- #8502
- State rank
- #110 of 111 in NE
Livability — Omaha
- Score
- 84/100
- State rank
- #7
- US rank
- #663
Category grades
Schools grade is shown separately in the Schools card above.
Census & demographics
- Census place
- Omaha, NE
- County
- Douglas County · 538,646 people
- City population
- 552,986
- Metro
- Omaha-Council Bluffs, NE-IA
- Population (ZIP)
- 24,210
- Household income
- $42,185
- Rent vs Own
- Severe rent burden
- 1913.0
Population outlook (Douglas County) Hauer SSP2
- Today (2025)
- 625,245 people
- By 2030
- 661,613 · +5.8%
- By 2040
- 732,395 · +17.1%
- By 2050
- 801,988 · +28.3%
- By 2075
- 968,637 · +54.9%
- By 2100
- 1,101,871 · +76.2%
Race, ethnicity, and origin ACS 2023
- Neighborhood character
- Diverse neighborhood (Simpson 0.65)
- Race & ethnicity
- Black 52% Hispanic / Latino 21% White 17% Two or more races 15% Asian 3% Native American 1%
- Hispanic origin (detail)
- Mexican 14%
- Common ancestry
- Ukrainian 3% Lithuanian 0%
- Foreign-born
- 14% · Canada, Philippines
- Languages at home
- 75% English-only · Spanish 16% Other Asian/Pacific 3% French/Haitian/Cajun 1%
Political lean MEDSL · Douglas
- 2024 margin
- D (+10.2) · D 54.4% · R 44.2% · Other 1.4%
- 2008→2024 swing
- +5.5pp toward D · 2008: 4.6pp · 2024: 10.2pp
- All cycles
- 2024: D+10.2 2020: D+11.3 2016: D+1.4 2012: R+4.3 2008: D+4.6
Not yet ingested
- Civics
- —
Market trends
- HPI YoY
- ▲ 13.82%
- Current HPI
- 358.7174
- Rent YoY
- ▲ 3.22%
- Metro
- Omaha-Council Bluffs, NE-IA
- State GDP YoY
- ▲ 0.68%
- F500 in state
- 2
Industry mix (Fortune 500 HQ in NE)
| Industry | F500 HQs | Revenue |
|---|---|---|
| Conglomerate | 1 | $371B |
|
||
Price history
+40.4% since first listed17 events — show timeline
- 2026-04-02 Price Changed $139,000 GPRMLS
- 2026-03-04 Listed $149,000 GPRMLS
- 2026-02-01 Listing Removed — GPRMLS
- 2025-12-08 Price Changed $159,900 GPRMLS
- 2025-10-31 Listed $164,900 GPRMLS
- 2024-10-31 Sold (Public Records) $160,000 Public Records
- 2024-10-08 Sold (MLS) $160,000 GPRMLS
- 2024-09-09 Pending — GPRMLS
- 2024-08-30 Listed $165,000 GPRMLS
- 2020-10-16 Listing Removed — GPRMLS
- 2020-09-11 Listed $118,000 GPRMLS
- 2019-11-05 Sold (Public Records) $99,000 Public Records
- 2019-11-01 Sold (MLS) $99,000 GPRMLS
- 2019-09-23 Pending — GPRMLS
- 2019-09-03 Relisted — GPRMLS
- 2019-08-12 Pending — GPRMLS
- 2019-08-05 Listed $99,000 GPRMLS
Property tax history
+15.2%/yrLatest (2025): $2,205 · +0.4% YoY. Source: county tax records.
Cash-flow waterfall
monthlySold comps — $/sqft
last 12 mo · ≤1 miLoading sold comps…