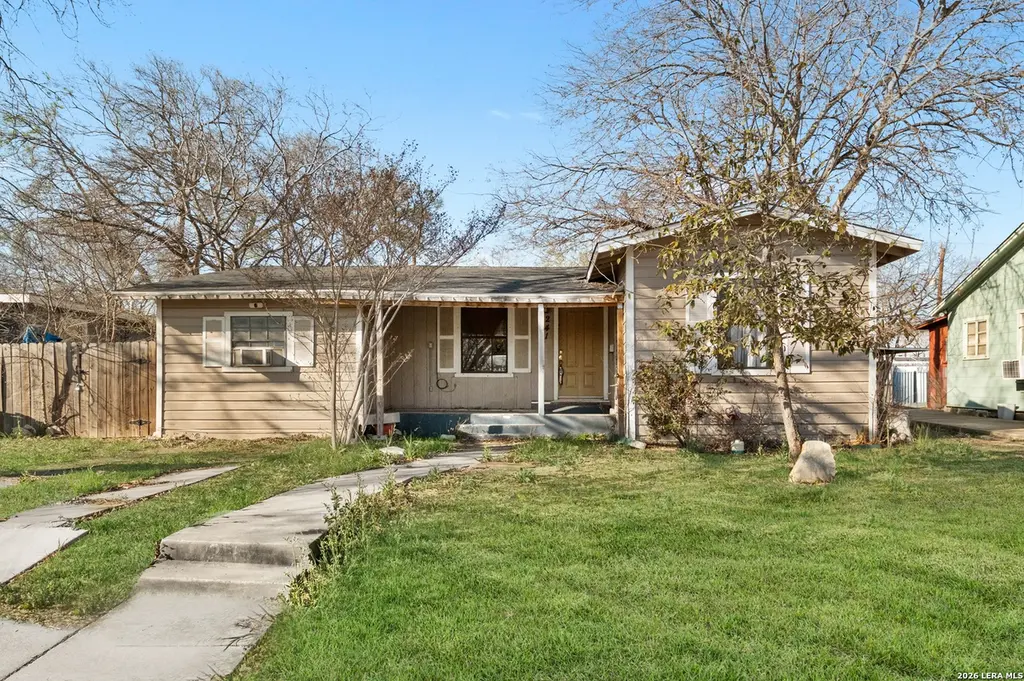
241 Archimedes Dr · San Antonio, TX
Flood risk 1/10 · Minimal
- FEMA flood zone
- X (unshaded)
- Chance of flooding over 30 yrs
- 0.0%
- Est. flood insurance / yr
- $507 – $1,088
Fire risk 3/10 · Minor
- Est. fire insurance / yr
- $1,222 – $2,270
Heat risk 8/10 · Major
- Hot days now (above 108°F)
- 7 days/yr
- Hot days in 30 yrs
- 20 days/yr
Wind risk 8/10 · Major
- Chance of severe wind over 30 yrs
- 80.0%
Air-quality risk 2/10 · Minimal
- Unhealthy air days now
- 0 days/yr
- Unhealthy air days in 30 yrs
- 2 days/yr
Risk factors via First Street. Map © Google.
Why this score? — see what drove the C- grade
The composite is a weighted blend of 9 inputs, each scored 0–100. Each bar is that input's sub-score; the figure is the points it added to the 100-point composite (weight × sub-score).
- Cash flow +16.0/30.0
- ARV discount +14.2/15.0
- 1% rule +6.1/10.0
- DSCR +5.0/10.0
- Livability +4.0/5.0
- Condition / age +2.5/5.0
- Rent growth +1.7/5.0
- Schools +1.4/10.0
- Appreciation +0.0/10.0
$124,900
🖨 Deal sheet (PDF) 📄 Offer letter ✓ Due diligence
Listing remarks MLS
This charming and move-in ready single-family home featuring three bedrooms and one full bathroom, freshly designed with an open living room that flows into a separate dining area and convenient breakfast space in the kitchen. The spacious master bedroom and generous secondary rooms offer comfortable living, while central heat and air provide year-round comfort. Set on a large lot with a huge backyard shaded by mature trees and complemented by a covered patio, this home invites outdoor relaxation and entertaining. Located in the desirable Highland Hills area of San Antonio with easy access to Hwy 37 and Interstate 35, this property delivers both comfort and convenience in a well-established neighborhood.
Key facts
- Open living room
- Huge backyard
- Covered patio
Tags
Neighborhood map
What this means for you Summary
Snapshot
- This is a 3-bed/1.0-bath single-family listed at $125k.
Deal economics
- At list price, monthly cash flow is $62 ($748/yr) — positive.
- The deal already cash-flows at list — no discount required.
- Meets the 1% rule at list price ($1k rent vs $125k).
- Recommended offer: $114k (9.0% below list) — sets the bar for market timing.
- Cap rate 6.9% vs local median 3.8% in San Antonio — top-decile yield for the area; either an underpriced asset or a hidden risk that comps aren't pricing in. Stress-test before assuming the spread holds.
Location & tenants
- Location reads 80/100 on livability (#31 in TX, #1,616 nationally) — a professional / high-income tenant draw. Strengths: amenities A+, commute A+, cost of living A+; Watch: schools C-, crime F.
- San Antonio ISD (urban): math 12% / reading 22% proficiency, ranked #805 of 826 in TX (top 98%) — low school quality limits family demand, transient renter base, plan for 1-2y turnover; 80% free/reduced lunch — lower-income household profile, screen leases tightly.
- Market conditions: Rents falling (-3.4%/yr); 329 active listings in the ZIP; 38 comparable units currently listed for rent nearby; rentals at typical pace (median 22d on market — plan ~3-4 weeks tenant-placement turnaround); 8,308 units permitted in Bexar County in 2024 (2,506 in 5+ unit buildings).
- This rent runs 32% of the median local income ($52k/yr) — at the standard rent-burdened threshold; future hikes will face affordability resistance.
Forward outlook
- Local home prices are declining (-3.0%/yr); year-one equity from $864 of loan paydown is wiped out by about $4k of value loss. Plan a longer hold.
- Bexar County population projected at +50% by 2050 — long-run rental-demand tailwind backs the buy-and-hold thesis.
Negotiation context
- It's been on market 110 days — a 9% lower offer ($114k) is reasonable based on typical stale-listing flexibility.
- 7 sale attempts since 22y ago with the ask held roughly flat each time — persistent listings suggest the price (not the market) is what's stuck; bring a comps-based counter.
Risks & watch-outs
- Watch-outs: property tax is 3.2% of price; built in 1951 — expect roof / HVAC / electrical / plumbing capex.
- Climate carrying-cost: severe wind risk, 80% chance of damaging wind over 30y; extreme-heat days projected 7→20/yr by 2055 (HVAC capex compounding) — expect insurance premiums to compound above CPI over the hold.
Questions for the listing agent
- It's been on market 110 days. Have you received any prior offers? Is the seller open to a 9% concession, seller financing, or rate buy-down credit?
- Built in 1951 — when were the roof, HVAC, electrical panel, plumbing, and water heater last replaced?
- Property tax is high relative to price — has the assessment been appealed recently, and will the sale trigger a re-assessment?
- Why hasn't it sold? Are there any deal-killer items the seller is aware of (foundation, flood, title, zoning, code violations)?
- Is there a deadline driving the sale (1031 exchange, divorce, estate, relocation)? That informs how much negotiation room exists.
- Crime grade is F in this area — have there been break-ins, vandalism, or insurance claims at this property in the last 3 years? What carrier currently insures it and at what premium?
- What's the average days-on-market for RENTAL listings here right now (not sales)? A rising rental-DOM trend means longer vacancies and softer asking-rent achievability than the comps imply.
- What's the recent tenant-quality profile in this submarket — average credit score on applications, eviction rate, late-payment / NSF rate, and stable-employment percentage? A property-management company in the area should have these aggregated.
- How much new for-sale + rental construction is in the pipeline within 1–3 miles? Heavy new supply typically softens prices + rents 12–24 months out; constrained supply supports both.
Investment metrics
- 1% rule
- 1.11% ✓
- Cap rate
- 6.89%
- Cash-on-cash
- 2.14%
- DSCR
- 1.10
- GRM
- 7.5
CMA / ARV
- ARV (median comp)
- $146,848
- List price
- $124,900
- Delta
- -14.95%
- Verdict
- UNDERPRICED
- Comps
- 20 within 1.0 mi
Show comp detail 12 sales within ~0.75 mi
| Address | Dist | Beds/Ba | Sqft | Sold | Price | $/sf | Match |
|---|---|---|---|---|---|---|---|
| 811 Cravens | 0.54mi | 3/1.0 | 1,023 (-1%) | 4mo | $155,000 | $152 | 70 |
| 106 Sublett | 0.32mi | 3/1.0 | 920 (-11%) | 2mo | $175,000 | $190 | 64 |
| 607 Kashmuir Pl | 0.64mi | 3/1.0 | 1,002 (-4%) | 1mo | $100,000 | $100 | 64 |
| 401 Kashmuir | 0.60mi | 3/1.0 | 1,080 (+4%) | 2mo | $184,900 | $171 | 63 |
| 611 Kashmuir Pl | 0.64mi | 3/1.0 | 1,008 (-3%) | 4mo | $150,000 | $149 | 62 |
| 207 Michael | 0.60mi | 3/1.0 | 963 (-7%) | 1mo | $155,000 | $161 | 59 |
| 239 Coral Ave | 0.65mi | 3/1.0 | 974 (-6%) | 2mo | $159,900 | $164 | 58 |
| 230 Metz | 0.27mi | 2/1.0 (-1) | 912 (-12%) | 8mo | $189,999 | $208 | 56 |
| 836 Avondale | 0.49mi | 2/1.0 (-1) | 1,150 (+11%) | 1mo | $96,000 | $83 | 54 |
| 343 W Palfrey | 0.73mi | 3/1.0 | 963 (-7%) | 1mo | $165,000 | $171 | 53 |
| 330 Pool Dr | 0.47mi | 3/1.0 | 1,160 (+12%) | 7mo | $199,500 | $172 | 53 |
| 402 Mcdougal | 0.55mi | 3/1.0 | 1,180 (+14%) | 8mo | $149,900 | $127 | 45 |
Match score weights: distance 35% · size 25% · config 20% · recency 20%. Top-matched comps best support the ARV.
Projected returns pro-forma
-3.0% appreciation · 0.0% rent growth · sell at horizon
- IRR
- -16.9%
- Equity multiple
- 0.42×
- Total profit
- $-20,219
- Equity at exit
- $18,623
- IRR
- -17.2%
- Equity multiple
- 0.21×
- Total profit
- $-27,728
- Equity at exit
- $10,799
Cash invested: $34,972 (down + closing). Projections, not guarantees.
Landlord ↔ Tenant lean methodology
- Overall (STATE)
- 87 Strongly Landlord-Friendly
- State Texas
- 87 Strongly Landlord-Friendly · R+5
- County
- — inherits STATE
- City
- — inherits STATE
ZIP-level market 78223
- Home prices YoY
- -16.4%
- Rents YoY
- -3.4%
- Active inventory
- 329
- Price-to-rent
- 7.5×
Monthly cashflow live
- Estimated rent
- $1,391 high interval (Pro) →
- Mortgage (P&I)
- −$655
- Tax from tax record
- −$329 /mo · $3,950/yr
- Insurance
- −$52
- HOA
- −$0
- Vacancy / Maint / Mgmt
- −$292
- Net cashflow
- $62
Break-even live
Sensitivity live
| Price | -10% $133 | -5% $98 | +0% $62 | +5% $27 | +10% $-8 |
|---|---|---|---|---|---|
| Rent | -10% $-48 | -5% $7 | +0% $62 | +5% $117 | +10% $172 |
| Rate | -1.0pp $125 | -0.5pp $94 | base $62 | +0.5pp $30 | +1.0pp $-3 |
UW: 25.0% down · 7.5% · 30yr · 1.5% tax · 5.0% vac · 8.0% maint · 8.0% mgmt
Financing live
Cash to close
- Down payment
- $31,225
- Closing costs
- $3,747
- Reserves months
- —
- Total cash needed
- —
Loan-product check · same deal, 3 products live
Conventional
25% down · 7.5% · 30yr
- Down + closing
- —
- Monthly P&I
- —
- Monthly cashflow
- —
- DSCR
- —
- Eligible?
- —
Personal DTI + credit; lowest rate.
DSCR
20% down · 8.5% · 30yr
- Down + closing
- —
- Monthly P&I
- —
- Monthly cashflow
- —
- DSCR
- —
- Eligible?
- —
No personal income docs; deal must DSCR.
Hard money
10% down · 12.0% · 12mo
- Down + closing
- —
- Monthly P&I
- —
- Monthly cashflow
- —
- DSCR
- —
- Eligible?
- —
Short-term bridge; refi at stabilization.
Rent comps 38 comps
| Address | Beds | Baths | Sqft | Rent | $/sqft | DOM | Units | Dist |
|---|---|---|---|---|---|---|---|---|
| 815 Soria Pl Unit 101 San Antonio, TX | 3.0 | 2.5 | 1300 | $1,395 | $1.07 | 0d | 1 | 0.44mi |
| 326 Sublett Dr San Antonio, TX | 2.0 | 1.0 | 912 | $1,350 | $1.48 | 25d | 1 | 0.48mi |
| 4622 Clark Ave San Antonio, TX | 1.0–4.0 | 1.0–2.0 | 859 | $1,380 | $1.61 | 45d | 1 | 0.56mi |
| 768 Avondale Ave Unit 202 San Antonio, TX | 3.0 | 1.5 | 1050 | $1,195 | $1.14 | 4d | 1 | 0.60mi |
| 4700 Stringfellow Dr San Antonio, TX | 1.0–2.0 | 1.0–2.0 | 807 | $950 | $1.18 | 0d | 6 | 0.60mi |
| 2011 Dollarhide Ave San Antonio, TX | 1.0–2.0 | 1.0 | 730 | $1,150 | $1.58 | 23d | 5 | 0.61mi |
| 317 Kashmuir Pl Unit 3 San Antonio, TX | 2.0 | 1.0 | 732 | $1,197 | $1.64 | 17d | 1 | 0.63mi |
| 611 Kashmuir Pl San Antonio, TX | 3.0 | 1.0 | 1008 | $1,800 | $1.79 | 45d | 1 | 0.63mi |
| 311 Glamis Ave Unit 1 San Antonio, TX | 3.0 | 2.0 | 1200 | $1,395 | $1.16 | 45d | 1 | 0.64mi |
| 311 Glamis Ave Unit 2 San Antonio, TX | 3.0 | 1.0 | 900 | $1,395 | $1.55 | 45d | 1 | 0.64mi |
| 311 Glamis Ave San Antonio, TX | 3.0 | 1.0 | 1100 | $1,195 | $1.09 | 0d | 1 | 0.64mi |
| 242 Glamis Ave San Antonio, TX | 4.0 | 2.0 | 1464 | $1,900 | $1.30 | 12d | 1 | 0.65mi |
| 3522 Bob Billa St San Antonio, TX | 3.0 | 2.0 | 1177 | $1,200 | $1.02 | 45d | 1 | 0.82mi |
| 114 Killarney Dr San Antonio, TX | 3.0 | 2.0 | 988 | $1,500 | $1.52 | 16d | 1 | 0.82mi |
| 2303 Goliad Rd San Antonio, TX | 1.0–2.0 | 1.0 | 675 | $1,013 | $1.50 | 0d | 7 | 0.84mi |
| 3435 E Southcross Blvd San Antonio, TX | 1.0–2.0 | 1.0–2.0 | 867 | $1,254 | $1.45 | 45d | 1 | 0.85mi |
| 3607 Bremen Ave #2 San Antonio, TX | 2.0 | 1.0 | 940 | $999 | $1.06 | 0d | 1 | 0.88mi |
| 3602 Bremen St San Antonio, TX | 4.0 | 2.0 | 1092 | $1,595 | $1.46 | 25d | 1 | 0.89mi |
| 6410 S New Braunfels Ave San Antonio, TX | 1.0–3.0 | 1.0–2.0 | 1017 | $1,555 | $1.53 | 4d | 21 | 0.95mi |
| 534 Cosgrove St San Antonio, TX | 3.0 | 2.0 | 1430 | $1,875 | $1.31 | 45d | 1 | 1.03mi |
| 115 Harcourt Ave San Antonio, TX | 3.0 | 1.0 | 912 | $1,500 | $1.64 | 23d | 1 | 1.07mi |
| 6222 S New Braunfels Ave San Antonio, TX | 1.0–4.0 | 1.0–2.0 | 1258 | $1,359 | $1.08 | 11d | 12 | 1.09mi |
| 6222 S New Braunfels Ave San Antonio, TX | 1.0–4.0 | 1.0–2.0 | 1211 | $1,359 | $1.12 | 0d | 24 | 1.09mi |
| 271 Kate Schenck Ave San Antonio, TX | 3.0 | 2.0 | 1250 | $1,450 | $1.16 | 21d | 1 | 1.09mi |
| 462 Utopia Ln Unit W248 San Antonio, TX | 2.0 | 1.0 | 837 | $1,239 | $1.48 | 19d | 1 | 1.11mi |
| 462 Utopia Ln San Antonio, TX | 2.0 | 1.0 | 837 | $1,215 | $1.45 | 45d | 1 | 1.13mi |
| 2335 Nopal St Unit 108 San Antonio, TX | 2.0 | 1.0 | 805 | $975 | $1.21 | 5d | 1 | 1.27mi |
| 2307 McKinley Ave San Antonio, TX | 3.0 | 2.0 | 1059 | $1,495 | $1.41 | 45d | 1 | 1.30mi |
| 1124 Vanderbilt St San Antonio, TX | 3.0 | 1.0 | 1095 | $1,350 | $1.23 | 45d | 1 | 1.32mi |
| 329 Hot Wells Blvd Unit FRONT UNIT San Antonio, TX | 2.0 | 1.0 | 756 | $1,150 | $1.52 | 0d | 1 | 1.33mi |
| 414 Stanfield Ave San Antonio, TX | 3.0 | 1.0 | 1250 | $1,300 | $1.04 | 45d | 1 | 1.34mi |
| 515 Stratford Ct Unit NA San Antonio, TX | 3.0 | 1.0 | 895 | $1,550 | $1.73 | 45d | 1 | 1.36mi |
| 7310 S New Braunfels Ave Unit 710 San Antonio, TX | 2.0 | 2.0 | 871 | $1,124 | $1.29 | 0d | 1 | 1.39mi |
| 2566 Goliad Rd San Antonio, TX | 1.0–2.0 | 1.0 | 600 | $1,300 | $2.17 | 25d | 23 | 1.40mi |
| 2566 Goliad Rd San Antonio, TX | 2.0 | 1.0 | 600 | $1,350 | $2.25 | 5d | 20 | 1.40mi |
| 1811 McKinley Ave San Antonio, TX | 2.0 | 2.0 | 1248 | $975 | $0.78 | 4d | 1 | 1.46mi |
| 204 E Dullnig Ct Unit 20 San Antonio, TX | 2.0 | 1.0 | 750 | $950 | $1.27 | 23d | 1 | 1.48mi |
| 3007 SE Military Dr Unit 710 San Antonio, TX | 2.0 | 2.0 | 1010 | $847 | $0.84 | 0d | 1 | 1.49mi |
Listing history 41 events
-
2026-06-21days on market $124,900 Active 110 DOM
-
2026-06-18days on market $124,900 Active 107 DOM
-
2026-06-17days on market $124,900 Active 106 DOM
-
2026-06-16days on market $124,900 Active 105 DOM
-
2026-06-15days on market $124,900 Active 104 DOM
-
2026-06-13days on market $124,900 Active 102 DOM
-
2026-06-09days on market $124,900 Active 98 DOM
-
2026-06-08days on market $124,900 Active 97 DOM
-
2026-06-07days on market $124,900 Active 96 DOM
-
2026-06-04days on market $124,900 Active 93 DOM
-
2026-06-03days on market $124,900 Active 92 DOM
-
2026-06-02days on market $124,900 Active 91 DOM
-
2026-06-01days on market $124,900 Active 90 DOM
-
2026-05-31days on market $124,900 Active 89 DOM
-
2026-03-03$124,900 New 713-char remark
Show marketing remark (713 chars)
This charming and move-in ready single-family home featuring three bedrooms and one full bathroom, freshly designed with an open living room that flows into a separate dining area and convenient breakfast space in the kitchen. The spacious master bedroom and generous secondary rooms offer comfortable living, while central heat and air provide year-round comfort. Set on a large lot with a huge backyard shaded by mature trees and complemented by a covered patio, this home invites outdoor relaxation and entertaining. Located in the desirable Highland Hills area of San Antonio with easy access to Hwy 37 and Interstate 35, this property delivers both comfort and convenience in a well-established neighborhood.
-
2017-06-23soldstatus
-
2017-06-20soldstatus Sold 324-char remark
Show marketing remark (324 chars)
Move-in ready 3 bed 1 bath with an open living room, separate dining area, breakfast area in kitchen, large master bedroom, spacious secondary rooms, and central heat/air. Huge back yard boasts mature trees and covered patio perfect for relaxing. Part of San Antonio I.S.D. with ideal location near Hwy 37 and Interstate 35.
-
2017-04-17status Pending 324-char remark
Show marketing remark (324 chars)
Move-in ready 3 bed 1 bath with an open living room, separate dining area, breakfast area in kitchen, large master bedroom, spacious secondary rooms, and central heat/air. Huge back yard boasts mature trees and covered patio perfect for relaxing. Part of San Antonio I.S.D. with ideal location near Hwy 37 and Interstate 35.
-
2017-03-28historical Active Option 324-char remark
Show marketing remark (324 chars)
Move-in ready 3 bed 1 bath with an open living room, separate dining area, breakfast area in kitchen, large master bedroom, spacious secondary rooms, and central heat/air. Huge back yard boasts mature trees and covered patio perfect for relaxing. Part of San Antonio I.S.D. with ideal location near Hwy 37 and Interstate 35.
-
2017-03-04price $109,880 324-char remark
Show marketing remark (324 chars)
Move-in ready 3 bed 1 bath with an open living room, separate dining area, breakfast area in kitchen, large master bedroom, spacious secondary rooms, and central heat/air. Huge back yard boasts mature trees and covered patio perfect for relaxing. Part of San Antonio I.S.D. with ideal location near Hwy 37 and Interstate 35.
-
2017-02-17price $109,890 324-char remark
Show marketing remark (324 chars)
Move-in ready 3 bed 1 bath with an open living room, separate dining area, breakfast area in kitchen, large master bedroom, spacious secondary rooms, and central heat/air. Huge back yard boasts mature trees and covered patio perfect for relaxing. Part of San Antonio I.S.D. with ideal location near Hwy 37 and Interstate 35.
-
2016-12-03$109,900 New 324-char remark
Show marketing remark (324 chars)
Move-in ready 3 bed 1 bath with an open living room, separate dining area, breakfast area in kitchen, large master bedroom, spacious secondary rooms, and central heat/air. Huge back yard boasts mature trees and covered patio perfect for relaxing. Part of San Antonio I.S.D. with ideal location near Hwy 37 and Interstate 35.
-
2015-01-30historical
-
2015-01-09price $75,000
-
2015-01-06status Back on Market
-
2014-12-30historical Active Option
-
2014-06-30price $79,900 Price Change
-
2014-06-13price $81,900 Price Change
-
2014-04-04$85,000 New
-
2014-03-11soldstatus
-
2012-04-02soldstatus
-
2012-04-02soldstatus
-
2012-03-23historical
-
2012-02-03$67,900
-
2011-12-26historical
-
2011-12-02$62,000
-
2005-02-28soldstatus
-
2004-12-08historical
-
2004-09-16$69,900
-
2003-08-27soldstatus
-
2003-08-27soldstatus
ⓘ Source: listings_history table (triggers on properties + properties_extension) + one-shot
backfill from property_details.listing_events for pre-trigger history.
Tax reassessment forecast TX · Resets to sale price
- Current annual tax
- $3,950 · $329/mo
- Projected year-2 tax
- $3,950 · $329/mo
- Expected delta
- $0/yr ($0/mo · 0.0%)
ⓘ Screening estimate from a state-policy table — verify with the county assessor before closing.
Climate risk First Street
- Flood 1/10 Low FEMA zone X (unshaded) · 0% chance over 30 yrs
- Wildfire 3/10 Moderate
- Heat 8/10 Severe 7 d/yr ≥108°F today · 20 d/yr by 30 yrs out
- Wind 8/10 Severe 80% chance of damaging wind over 30 yrs
- Air quality 2/10 Low 0 unhealthy d/yr today · 2 by 30 yrs out
Nearby sold comps map
Loading sold comps map…
Walkable amenities ~0.75 mi
Loading nearby amenities…
Taxation est. · year 1
- Rental income
- $16,687
- − Mortgage interest
- −$6,996
- − Property taxes
- −$3,950
- − Insurance
- −$624
- − Repairs & maintenance
- −$1,335
- − Management
- −$1,335
- − Depreciation
- −$3,633
- Taxable loss
- −$1,188
- Est. tax savings @ 24.0%
- +$285
- After-tax cash flow
- $1,033/yr
For passive investors: Depreciation is non-cash, so a rental often shows a tax loss while cash-flowing — sheltering income. Rental losses are passive: they offset passive income freely, and up to $25,000/yr can offset ordinary (W-2) income if you actively participate and your MAGI is under $100k (phasing out to $0 by $150k); unused losses carry forward. On sale, claimed depreciation is recaptured at up to 25%, and gains may owe capital-gains tax (a 1031 exchange can defer both). Figures are a year-1 estimate at your 24.0% rate — not tax advice; consult a CPA.
Schools (NCES district)
- District
- San Antonio ISD
- NCES district ID
- 4838730
- Math proficiency
- 12% ▼ -21.00%
- Reading proficiency
- 22% ▼ -7.00%
- Median HH income
- $30,952
- Composite
- 13.57/100
- National rank
- #9512
- State rank
- #805 of 826 in TX
Livability — San Antonio
- Score
- 80/100
- State rank
- #31
- US rank
- #1616
Category grades
Schools grade is shown separately in the Schools card above.
Census & demographics
- Census place
- San Antonio, TX
- County
- Bexar County · 1,990,555 people
- City population
- 1,806,925
- Metro
- San Antonio-New Braunfels, TX
- Population (ZIP)
- 58,983
- Household income
- $52,088
- Rent vs Own
- Severe rent burden
- 2809.0
Population outlook (Bexar County) Hauer SSP2
- Today (2025)
- 2,336,851 people
- By 2030
- 2,560,728 · +9.6%
- By 2040
- 3,020,569 · +29.3%
- By 2050
- 3,493,522 · +49.5%
- By 2075
- 4,668,459 · +99.8%
- By 2100
- 5,533,242 · +136.8%
Race, ethnicity, and origin ACS 2023
- Neighborhood character
- Predominantly Hispanic (76%)
- Race & ethnicity
- Hispanic / Latino 76% Two or more races 28% White 16% Black 5% Asian 2% Native American 1%
- Hispanic origin (detail)
- Mexican 67%
- Common ancestry
- Lithuanian 2% Romanian 1% Slovak 1%
- Foreign-born
- 10% · Canada, Vietnam
- Languages at home
- 63% English-only · Spanish 36%
Political lean MEDSL · Bexar
- 2024 margin
- Lean D (+9.8) · D 54.3% · R 44.6% · Other 1.1%
- 2008→2024 swing
- +4.2pp toward D · 2008: 5.6pp · 2024: 9.8pp
- All cycles
- 2024: D+9.8 2020: D+18.2 2016: D+13.5 2012: D+4.6 2008: D+5.6
Not yet ingested
- Civics
- —
Market trends
- HPI YoY
- ▼ -52.06%
- Current HPI
- 265.2235
- Rent YoY
- ▼ -3.36%
- Metro
- San Antonio-New Braunfels, TX
- State GDP YoY
- ▲ 3.95%
- F500 in state
- 110
Industry mix (Fortune 500 HQ in TX)
| Industry | F500 HQs | Revenue |
|---|---|---|
| Energy | 16 | $1,198B |
|
||
| Technology | 5 | $198B |
|
||
| Engineering / Construction | 4 | $72B |
|
||
| Energy Services | 3 | $60B |
|
||
| Utilities | 3 | $41B |
|
||
| Healthcare | 2 | $330B |
|
||
Price history
+78.7% since first listed27 events — show timeline
- 2026-03-03 Listed $124,900 LERA
- 2017-06-23 Sold (Public Records) — Public Records
- 2017-06-20 Sold (MLS) — LERA
- 2017-04-17 Pending — LERA
- 2017-03-28 Contingent — LERA
- 2017-03-04 Price Changed $109,880 LERA
- 2017-02-17 Price Changed $109,890 LERA
- 2016-12-03 Listed $109,900 LERA
- 2015-01-30 Listing Removed — LERA
- 2015-01-09 Price Changed $75,000 LERA
- 2015-01-06 Relisted — LERA
- 2014-12-30 Contingent — LERA
- 2014-06-30 Price Changed $79,900 LERA
- 2014-06-13 Price Changed $81,900 LERA
- 2014-04-04 Listed $85,000 LERA
- 2014-03-11 Sold (Public Records) — Public Records
- 2012-04-02 Sold (MLS) — LERA
- 2012-04-02 Sold (Public Records) — Public Records
- 2012-03-23 Listing Removed — LERA
- 2012-02-03 Listed $67,900 LERA
- 2011-12-26 Listing Removed — LERA
- 2011-12-02 Listed $62,000 LERA
- 2005-02-28 Sold (Public Records) — Public Records
- 2004-12-08 Listing Removed — LERA
- 2004-09-16 Listed $69,900 LERA
- 2003-08-27 Sold (Public Records) — Public Records
- 2003-08-27 Sold (Public Records) — Public Records
Property tax history
+8.6%/yrLatest (2025): $3,950 · -2.1% YoY. Source: county tax records.
Cash-flow waterfall
monthlySold comps — $/sqft
last 12 mo · ≤1 miLoading sold comps…