 Duplex
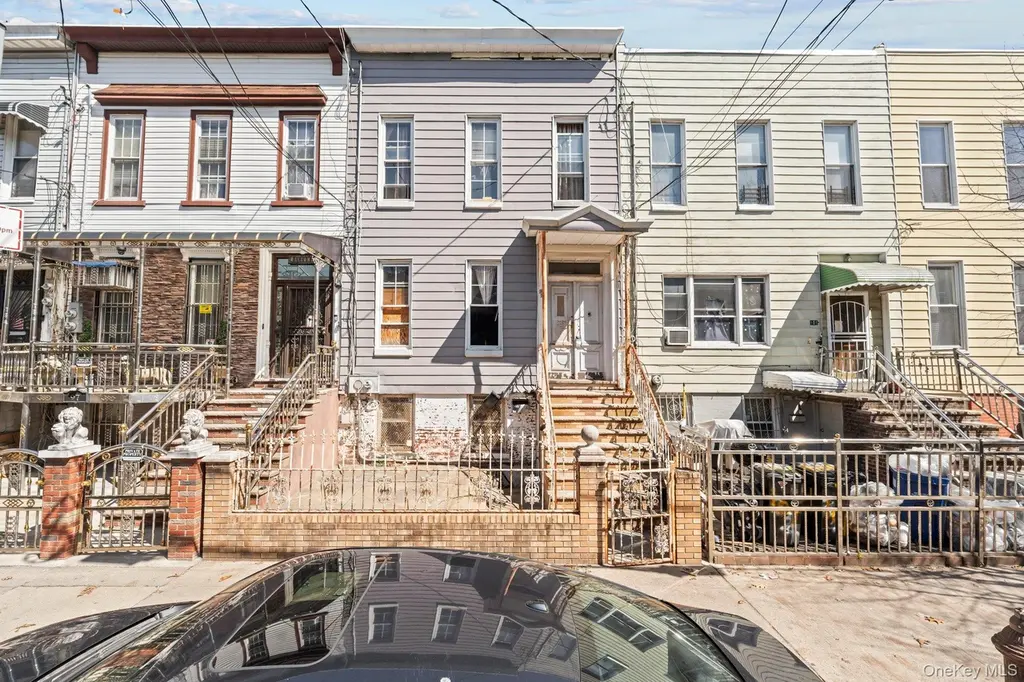
99 Doscher St · New York, NY
Flood risk 1/10 · Minimal
- FEMA flood zone
- X (unshaded)
- Chance of flooding over 30 yrs
- 0.0%
- Est. flood insurance / yr
- $507 – $1,088
Fire risk 1/10 · Minimal
- Est. fire insurance / yr
- $691 – $1,283
Heat risk 7/10 · Major
- Hot days now (above 99°F)
- 7 days/yr
- Hot days in 30 yrs
- 15 days/yr
Wind risk 6/10 · Moderate
- Chance of severe wind over 30 yrs
- 65.0%
Air-quality risk 5/10 · Moderate
- Unhealthy air days now
- 6 days/yr
- Unhealthy air days in 30 yrs
- 8 days/yr
Risk factors via First Street. Map © Google.
Why this score? — see what drove the B- grade
The composite is a weighted blend of 9 inputs, each scored 0–100. Each bar is that input's sub-score; the figure is the points it added to the 100-point composite (weight × sub-score).
- Cash flow +23.4/30.0
- ARV discount +15.0/15.0
- DSCR +7.5/10.0
- 1% rule +5.0/10.0
- Schools +5.0/10.0
- Rent growth +4.0/5.0
- Livability +3.8/5.0
- Condition / age +2.5/5.0
- Appreciation +0.0/10.0
$679,000
🖨 Deal sheet (PDF) 📄 Offer letter ✓ Due diligence
Multi-family units
County records classify this as Multi-Family (2-4 Unit). Listing-text estimate: 2 units. confirmed
Listing remarks MLS
JUST REDUCED FOR QUICK SALE, NEW WINDOWS. 2 SKYLIGHTS, TILED FLOOR AND A BEAUTIFUL FINISHED BASEMENT. LARGE BACKYARD.
Key facts
- Shopping centers
- Tree lined street
- Transportation
Tags
Property features AI
Finance
- Other: No additional financial amenities provided
- Financial info: No investor or income/expense details provided
- HOA & community: No HOA information provided
Exterior
- Parking: On-street parking; No carport
- Security: No security details provided
- Utilities: Public sewer; Natural gas available
- Home design: Duplex; Total building area approximately 2160
- Construction: Frame construction
- Exterior features: Frame construction; Not waterfront
Interior
- Kitchen: No kitchen appliance details provided
- Bedrooms: One 3-bedroom unit
- Flooring: No flooring details provided
- Bathrooms: Two full bathrooms
- Heating & cooling: Baseboard heating; Wall/window air conditioning units
- Interior features: Original details; Full basement
- Laundry & utility: No laundry details provided
Neighborhood map
What this means for you Summary
Snapshot
- This is a 2 × 2-bed/?-bath units multifamily listed at $679k.
Deal economics
- At list price, monthly cash flow is $1k ($15k/yr) — positive. Per door: $626/mo.
- The deal already cash-flows at list — no discount required.
- Meets the 1% rule at list price ($7k rent vs $679k).
- Recommended offer: $638k (6.0% below list) — sets the bar for market timing.
- Cap rate 8.5% vs local median 2.6% in New York — top-decile yield for the area; either an underpriced asset or a hidden risk that comps aren't pricing in. Stress-test before assuming the spread holds.
Location & tenants
- Location reads 75/100 on livability (#268 in NY, #4,188 nationally) — a middle-class / working-renter tenant base. Strengths: amenities A+, commute A+, health & safety A; Watch: crime F, cost of living F.
- Zoned schools: Elm Tree Elementary School (math 27% / reading 52%, grade F, #1,444 of 2,108 statewide, top 71%, 806 students, 94% FRL); Jhs 383 Philippa Schuyler (math 32% / reading 67%, grade C, #280 of 729 statewide, top 40%, 822 students, 85% FRL); Midwood High School (math 94% / reading 96%, grade A+, #83 of 1,100 statewide, top 8%, 4,062 students, 73% FRL).
- Market conditions: Rents rising fast (+6.1%/yr); 193 active listings in the ZIP; 5 comparable units currently listed for rent nearby; rentals at typical pace (median 26d on market — plan ~3-4 weeks tenant-placement turnaround); 10,063 units permitted in Kings County in 2024 (9,789 in 5+ unit buildings).
- At $6,797/mo this rent would consume 131% of the median local household income ($62k/yr) (locally 7574% of renters already pay >50% of income on rent) — very limited rent-growth headroom before tenants either downsize or default.
Forward outlook
- Local home prices are declining (-3.0%/yr); year-one equity from $5k of loan paydown is wiped out by about $20k of value loss. Plan a longer hold.
- Kings County population projected at +13% by 2050 — modest demand growth; plan on rents tracking national, not racing it.
- At projected returns (-3.0% appreciation + 6.1% rent growth), your $190k cash investment doubles in ~10 years — after that, you're playing with house money.
Negotiation context
- It's been on market 67 days — a 6% lower offer ($638k) is reasonable based on typical stale-listing flexibility.
- 2 sale attempts since 30y ago with the ask held roughly flat each time — persistent listings suggest the price (not the market) is what's stuck; bring a comps-based counter.
- Current owner paid $370k; list at $679k implies a 84% gain — meaningful room to come down on a strong offer.
Risks & watch-outs
- Watch-outs: built in 1910 — expect roof / HVAC / electrical / plumbing capex.
- Climate carrying-cost: major wind risk, 65% chance of damaging wind over 30y; extreme-heat days projected 7→15/yr by 2055 (HVAC capex compounding) — expect insurance premiums to compound above CPI over the hold.
Questions for the listing agent
- It's been on market 67 days. Have you received any prior offers? Is the seller open to a 6% concession, seller financing, or rate buy-down credit?
- Can we see the unit-by-unit rent roll, current vacancy, and any below-market leases? What's the average tenancy length?
- What capital expenditures (roof, boiler, parking lot, exteriors) have been made in the last 5 years, and what's planned in the next 2?
- Built in 1910 — when were the roof, HVAC, electrical panel, plumbing, and water heater last replaced?
- Why hasn't it sold? Are there any deal-killer items the seller is aware of (foundation, flood, title, zoning, code violations)?
- Is there a deadline driving the sale (1031 exchange, divorce, estate, relocation)? That informs how much negotiation room exists.
- Schools are B-rated — typically a magnet for longer-tenancy family renters. What's the average tenant stay here, and is there a school-zone premium baked into asking?
- Crime grade is F in this area — have there been break-ins, vandalism, or insurance claims at this property in the last 3 years? What carrier currently insures it and at what premium?
- What's the average days-on-market for RENTAL listings here right now (not sales)? A rising rental-DOM trend means longer vacancies and softer asking-rent achievability than the comps imply.
- What's the recent tenant-quality profile in this submarket — average credit score on applications, eviction rate, late-payment / NSF rate, and stable-employment percentage? A property-management company in the area should have these aggregated.
- How much new apartment / multifamily construction is in the pipeline within 1–3 miles? Heavy new supply (>2% of stock underway) typically softens rents 12–24 months out; light construction supports rent growth.
Investment metrics
- 1% rule
- 1.00% ✓
- Cap rate
- 8.51%
- Cash-on-cash
- 7.90%
- DSCR
- 1.35
- GRM
- 8.3
CMA / ARV
- ARV (on-the-fly)
- $980,640
- Comps found
- 7
Show comp detail 7 sales within ~0.75 mi
| Address | Dist | Beds/Ba | Sqft | Sold | Price | $/sf | Match |
|---|---|---|---|---|---|---|---|
| 502 Chestnut St | 0.06mi | 4/3.0 | 2,119 (-2%) | 5mo | $775,000 | $366 | 86 |
| 404 Logan St | 0.26mi | 4/— | 2,128 (-2%) | 3mo | $1,030,000 | $484 | 83 |
| 495 Milford St | 0.54mi | 4/2.0 | 1,944 (-10%) | 6mo | $800,000 | $412 | 54 |
| 654 Autumn Ave | 0.28mi | 5/4.0 (+1) | 2,340 (+8%) | 10mo | $900,000 | $385 | 52 |
| 549 Ashford St | 0.73mi | 3/2.0 (-1) | 2,018 (-7%) | 6mo | $940,000 | $466 | 45 |
| 333 Milford St | 0.32mi | 5/3.0 (+1) | 1,880 (-13%) | 11mo | $999,999 | $532 | 45 |
| 120 Shepherd Ave | 0.73mi | 5/2.0 (+1) | 2,048 (-5%) | 12mo | $930,000 | $454 | 42 |
Match score weights: distance 35% · size 25% · config 20% · recency 20%. Top-matched comps best support the ARV.
Projected returns pro-forma
-3.0% appreciation · 6.14% rent growth · sell at horizon
- IRR
- -1.1%
- Equity multiple
- 0.96×
- Total profit
- $-8,382
- Equity at exit
- $101,241
- IRR
- 11.4%
- Equity multiple
- 2.01×
- Total profit
- $191,319
- Equity at exit
- $58,708
Cash invested: $190,120 (down + closing). Projections, not guarantees.
Landlord ↔ Tenant lean methodology
- Overall (CITY)
- 0 Strongly Tenant-Friendly
- State New York
- 15 Strongly Tenant-Friendly · D+10
- County
- — inherits STATE
- City New York
- 0 Strongly Tenant-Friendly · D+34
ZIP-level market 11208
- Rents YoY
- 6.1%
- Active inventory
- 193
- Price-to-rent
- 16.6×
Monthly cashflow live
- Estimated rent
- $6,797 high interval (Pro) →
- Mortgage (P&I)
- −$3,561
- Tax from tax record
- −$274 /mo · $3,286/yr
- Insurance
- −$283
- HOA
- −$0
- Vacancy / Maint / Mgmt
- −$1,427
- Net cashflow
- $1,252
Break-even live
Sensitivity live
| Price | -10% $1,636 | -5% $1,444 | +0% $1,252 | +5% $1,060 | +10% $868 |
|---|---|---|---|---|---|
| Rent | -10% $715 | -5% $984 | +0% $1,252 | +5% $1,521 | +10% $1,789 |
| Rate | -1.0pp $1,594 | -0.5pp $1,425 | base $1,252 | +0.5pp $1,076 | +1.0pp $897 |
2-unit breakdown (identical units grouped — click to expand)
| Units | Beds | Baths | Est. rent |
|---|---|---|---|
| 2× units | 2 | — | $6,798 |
| #1 | 2 | — | $3,399 |
| #2 | 2 | — | $3,399 |
| Total (2 units) | $6,797 | ||
UW: 25.0% down · 7.5% · 30yr · 1.5% tax · 5.0% vac · 8.0% maint · 8.0% mgmt
Financing live
Cash to close
- Down payment
- $169,750
- Closing costs
- $20,370
- Reserves months
- —
- Total cash needed
- —
Loan-product check · same deal, 3 products live
Conventional
25% down · 7.5% · 30yr
- Down + closing
- —
- Monthly P&I
- —
- Monthly cashflow
- —
- DSCR
- —
- Eligible?
- —
Personal DTI + credit; lowest rate.
DSCR
20% down · 8.5% · 30yr
- Down + closing
- —
- Monthly P&I
- —
- Monthly cashflow
- —
- DSCR
- —
- Eligible?
- —
No personal income docs; deal must DSCR.
Hard money
10% down · 12.0% · 12mo
- Down + closing
- —
- Monthly P&I
- —
- Monthly cashflow
- —
- DSCR
- —
- Eligible?
- —
Short-term bridge; refi at stabilization.
Rent comps 5 comps
| Address | Beds | Baths | Sqft | Rent | $/sqft | DOM | Units | Dist |
|---|---|---|---|---|---|---|---|---|
| 10124 78th St Ozone Park, NY | 3.0 | 1.0 | 2299 | $3,500 | $1.52 | 25d | 1 | 0.71mi |
| 8836 77th St Woodhaven, NY | 4.0 | 2.0 | 1500 | $4,200 | $2.80 | 26d | 1 | 1.02mi |
| 8812 86th St Woodhaven, NY | 3.0 | 2.0 | 2200 | $3,000 | $1.36 | 16d | 1 | 1.30mi |
| 9309 103rd Ave Ozone Park, NY | 3.0 | 1.5 | 1892 | $3,000 | $1.59 | 26d | 1 | 1.43mi |
| 88-16 Jamaica Ave Unit 2 Jamaica, NY | 4.0 | 1.0 | 2280 | $2,600 | $1.14 | 26d | 1 | 1.48mi |
Listing history 17 events
-
2026-06-21days on market $679,000 Active 67 DOM
-
2026-06-18days on market $679,000 Active 64 DOM
-
2026-06-17days on market $679,000 Active 63 DOM
-
2026-06-15days on market $679,000 Active 61 DOM
-
2026-06-13days on market $679,000 Active 59 DOM
-
2026-06-10days on market $679,000 Active 55 DOM
-
2026-06-08days on market $679,000 Active 54 DOM
-
2026-06-08days on market $679,000 Active 53 DOM
-
2026-06-04days on market $679,000 Active 50 DOM
-
2026-06-03days on market $679,000 Active 49 DOM
-
2026-06-01days on market $679,000 Active 47 DOM
-
2026-05-31pricedays on market $679,000 Active 46 DOM
-
2026-04-15$699,000 Active
-
2018-04-17soldstatus $370,000
-
1997-01-10soldstatus $129,000
-
1996-08-01$130,000 117-char remark
Show marketing remark (117 chars)
JUST REDUCED FOR QUICK SALE, NEW WINDOWS. 2 SKYLIGHTS, TILED FLOOR AND A BEAUTIFUL FINISHED BASEMENT. LARGE BACKYARD.
-
1988-08-02soldstatus $135,000
ⓘ Source: listings_history table (triggers on properties + properties_extension) + one-shot
backfill from property_details.listing_events for pre-trigger history.
Tax reassessment forecast NY · Partial reset (capped growth)
- Current annual tax
- $3,286 · $274/mo
- Projected year-2 tax
- $7,381 · $615/mo
- Expected delta
- +$4,094/yr (+$341/mo · 124.6%)
ⓘ Screening estimate from a state-policy table — verify with the county assessor before closing.
Climate risk First Street
- Flood 1/10 Low FEMA zone X (unshaded) · 0% chance over 30 yrs
- Wildfire 1/10 Low
- Heat 7/10 Severe 7 d/yr ≥99°F today · 15 d/yr by 30 yrs out
- Wind 6/10 Major 65% chance of damaging wind over 30 yrs
- Air quality 5/10 Major 6 unhealthy d/yr today · 8 by 30 yrs out
Nearby sold comps map
Loading sold comps map…
Walkable amenities ~0.75 mi
Loading nearby amenities…
Taxation est. · year 1
- Rental income
- $81,564
- − Mortgage interest
- −$38,035
- − Property taxes
- −$3,286
- − Insurance
- −$3,395
- − Repairs & maintenance
- −$6,525
- − Management
- −$6,525
- − Depreciation
- −$19,753
- Taxable income
- $4,045
- Est. tax owed @ 24.0%
- −$971
- After-tax cash flow
- $14,054/yr
For passive investors: Depreciation is non-cash, so a rental often shows a tax loss while cash-flowing — sheltering income. Rental losses are passive: they offset passive income freely, and up to $25,000/yr can offset ordinary (W-2) income if you actively participate and your MAGI is under $100k (phasing out to $0 by $150k); unused losses carry forward. On sale, claimed depreciation is recaptured at up to 25%, and gains may owe capital-gains tax (a 1031 exchange can defer both). Figures are a year-1 estimate at your 24.0% rate — not tax advice; consult a CPA.
Schools (NCES district)
No district data.
Livability — New York
- Score
- 75/100
- State rank
- #268
- US rank
- #4188
Category grades
Schools grade is shown separately in the Schools card above.
Census & demographics
- Census place
- New York, NY
- County
- Kings County · 2,614,986 people
- City population
- 7,731,280
- Metro
- New York-Newark-Jersey City, NY-NJ-PA
- Population (ZIP)
- 105,428
- Household income
- $62,077
- Rent vs Own
- Severe rent burden
- 7574.0
Population outlook (Kings County) Hauer SSP2
- Today (2025)
- 2,847,441 people
- By 2030
- 2,937,006 · +3.1%
- By 2040
- 3,095,491 · +8.7%
- By 2050
- 3,228,968 · +13.4%
- By 2075
- 3,321,723 · +16.7%
- By 2100
- 3,111,387 · +9.3%
Race, ethnicity, and origin ACS 2023
- Neighborhood character
- Diverse neighborhood (Simpson 0.66)
- Race & ethnicity
- Black 42% Hispanic / Latino 39% Asian 10% Two or more races 8% White 3%
- Hispanic origin (detail)
- Mexican 2% Puerto Rican 9% Dominican 16%
- Common ancestry
- Hispanic 1%
- Foreign-born
- 40% · Canada, China, Mexico
- Languages at home
- 48% English-only · Spanish 36% Other Indo-European 11% French/Haitian/Cajun 1%
Political lean MEDSL · Kings
- 2024 margin
- Solid D (+44.0) · D 72.0% · R 28.0%
- 2008→2024 swing
- -15.5pp toward R · 2008: 59.4pp · 2024: 44.0pp
- All cycles
- 2024: D+44.0 2020: D+54.8 2016: D+61.8 2012: D+63.9 2008: D+59.4
Not yet ingested
- Civics
- —
Market trends
- HPI YoY
- ▼ -546.38%
- Current HPI
- 376.1489
- Rent YoY
- ▲ 6.14%
- Metro
- New York-Newark-Jersey City, NY-NJ-PA
- State GDP YoY
- ▲ 2.60%
- F500 in state
- 92
Industry mix (Fortune 500 HQ in NY)
| Industry | F500 HQs | Revenue |
|---|---|---|
| Financial Services | 10 | $950B |
|
||
| Consumer Goods | 9 | $162B |
|
||
| Insurance | 4 | $225B |
|
||
| Telecommunications | 2 | $144B |
|
||
| Pharmaceuticals | 2 | $112B |
|
||
| Media / Entertainment | 2 | $69B |
|
||
Price history
+417.8% since first listed5 events — show timeline
- 2026-04-15 Listed $699,000 OneKey® MLS as Distributed by MLS Grid
- 2018-04-17 Sold (Public Records) $370,000 Public Records
- 1997-01-10 Sold (Public Records) $129,000 Public Records
- 1996-08-01 Listed $130,000 BNYMLS
- 1988-08-02 Sold (Public Records) $135,000 Public Records
Property tax history
+4.7%/yrLatest (2025): $3,286 · -1.4% YoY. Source: county tax records.
Cash-flow waterfall
monthlySold comps — $/sqft
last 12 mo · ≤1 miLoading sold comps…