1600 NW 18th Ave #104 · Delray Beach, FL
Flood risk 1/10 · Minimal
- FEMA flood zone
- X (unshaded)
- Chance of flooding over 30 yrs
- 0.0%
- Est. flood insurance / yr
- $507 – $1,088
Fire risk 1/10 · Minimal
- Est. fire insurance / yr
- $947 – $1,759
Heat risk 10/10 · Severe
- Hot days now (above 105°F)
- 7 days/yr
- Hot days in 30 yrs
- 26 days/yr
Wind risk 10/10 · Severe
- Chance of severe wind over 30 yrs
- 99.0%
Air-quality risk 2/10 · Minimal
- Unhealthy air days now
- 1 days/yr
- Unhealthy air days in 30 yrs
- 2 days/yr
Risk factors via First Street. Map © Google.
Why this score? — see what drove the D grade
The composite is a weighted blend of 9 inputs, each scored 0–100. Each bar is that input's sub-score; the figure is the points it added to the 100-point composite (weight × sub-score).
- Cash flow +11.3/30.0
- ARV discount +7.5/15.0
- 1% rule +6.3/10.0
- Schools +4.3/10.0
- Livability +3.9/5.0
- DSCR +3.3/10.0
- Rent growth +3.0/5.0
- Condition / age +2.5/5.0
- Appreciation +0.0/10.0
$229,000
🖨 Deal sheet (PDF) 📄 Offer letter ✓ Due diligence
Listing remarks
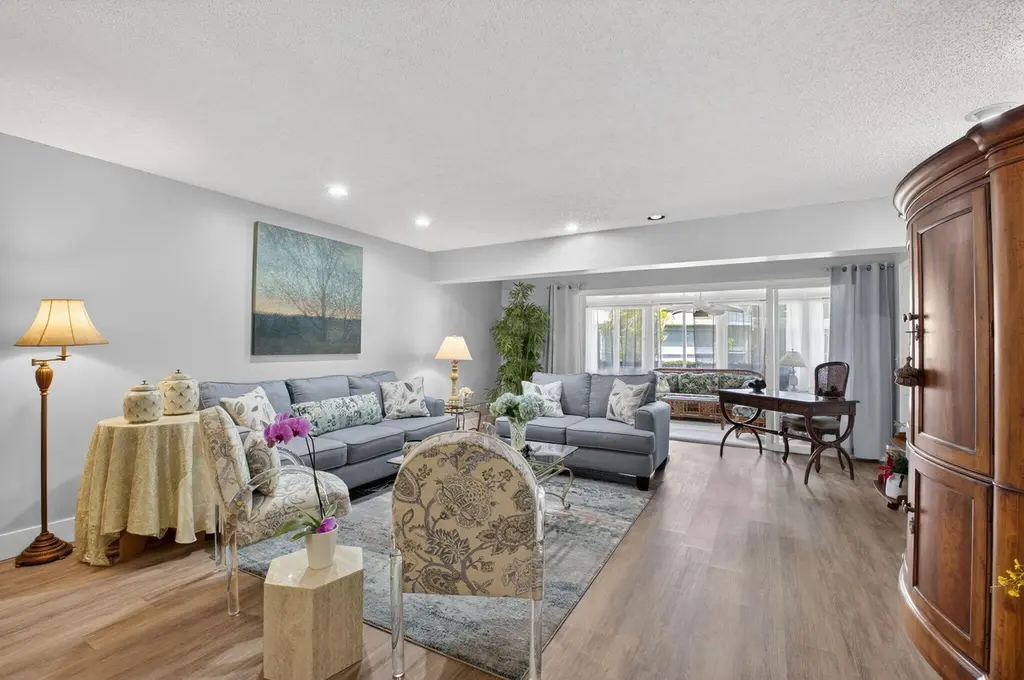
Live an easy lifestyle just minutes from Atlantic Ave in this desirable 55+ community with security guard, clubhouse and pool. This first-floor corner condo feels spacious and bright, featuring an oversized living/dining area, eat-in kitchen with custom cabinetry, in unit washer/dryer, new air conditioner and AC Lanai for added living space. Split-bedroom layout with en-suite guest room and a light-filled primary suite with double walk-in closets. Offered furnished and priced to sell---this one won't last! Walk to Community Pool Nearby.
Key facts
- Custom cabinetry
- Clubhouse
- Security guard
Tags
Property features AI
Finance
- Other: Road frontage: West of US-1; Road surface: Asphalt; Directions available
- Financial info: Property is on a land lease (lease exists, expires 2026-04-13); Quarterly land lease amount listed as 0.0
- HOA & community: HOA (monthly): $570; HOA covers insurance, grounds and structure maintenance, sewer, trash, water, hot water, roof repairs and pool service; Community amenities include fitness center, pool, spa/hot tub, bocce ball, community room, library and pickleball courts; Senior community; Pets allowed (cats OK)
Exterior
- Parking: Assigned parking; Guest parking; Open parking (1 space total)
- Security: Security guard
- Utilities: Public water; Public sewer; Cable available
- Home design: Condominium; One-level living; First-floor entry; Faces east; Resale property; Pines of Delray North Condo
- Construction: Block construction; Built-up roof; Slab foundation; Built in (assessor data for building area provided)
- Exterior features: Wrap-around porch; Porch; Glass-enclosed porch; Waterfront
Interior
- Kitchen: Dishwasher; Electric range; Microwave; Refrigerator; Disposal; Electric water heater
- Bedrooms: 2 bedrooms on the main level
- Flooring: Tile; Wood
- Bathrooms: 2 full bathrooms
- Heating & cooling: Central electric heating; Central individual cooling; Ceiling fan(s)
- Interior features: Walk-in closet(s); Furnished; Blinds, drapes and rods
- Laundry & utility: Laundry in kitchen
Neighborhood map
What this means for you Summary
Snapshot
- This is a 2-bed/2.0-bath condo listed at $229k.
Deal economics
- At list price, monthly cash flow is $-85 ($-1k/yr) — negative.
- To cash-flow at today's rent, offer at most $214k (6.6% below list).
- Meets the 1% rule at list price ($3k rent vs $229k).
- Recommended offer: $214k (6.6% below list) — sets the bar for cash-flow.
- Cap rate 5.8% vs local median 4.3% in Delray Beach — top-decile yield for the area; either an underpriced asset or a hidden risk that comps aren't pricing in. Stress-test before assuming the spread holds.
Location & tenants
- Location reads 77/100 on livability (#202 in FL, #3,160 nationally) — a middle-class / working-renter tenant base. Strengths: housing A+, health & safety A+, commute A-; Watch: cost of living C-, crime D-, amenities F.
- Palm Beach (suburban): math 46% / reading 53% proficiency, ranked #34 of 73 in FL (top 47%) — families likely to look elsewhere, expect single-tenant / working-renter base with shorter leases.
- Zoned schools: Crosspointe Elementary School (math 36% / reading 45%, grade F, #1,471 of 2,144 statewide, top 69%, 652 students, 75% FRL); Carver Middle School (math 22% / reading 34%, grade F, #486 of 571 statewide, top 86%, 732 students, 73% FRL); Atlantic High School (math 28% / reading 52%, grade F, #296 of 667 statewide, top 45%, 1,889 students, 59% FRL) — zoned schools average 69% FRL vs 52% district-wide (17 pts higher); higher-poverty schools than district average — tighter screening recommended.
- Zoned-school proficiency averages 36% at this address vs 50% district-wide (-13 pts) — the specific schools serving this property underperform the Palm Beach average; the district grade overstates school quality for this exact location.
- Market conditions: Rents rising (+1.8%/yr); 359 active listings in the ZIP; 40 comparable units currently listed for rent nearby; rentals at typical pace (median 24d on market — plan ~3-4 weeks tenant-placement turnaround); solid renter incomes; 3,974 units permitted in Palm Beach County in 2024 (1,012 in 5+ unit buildings).
- This rent runs 40% of the median local income ($78k/yr) — at the standard rent-burdened threshold; future hikes will face affordability resistance.
Forward outlook
- Local home prices are declining (-3.0%/yr); year-one equity from $2k of loan paydown is wiped out by about $7k of value loss. Plan a longer hold.
- Palm Beach County population projected at +30% by 2050 — long-run rental-demand tailwind backs the buy-and-hold thesis.
Negotiation context
- It's been on market 69 days — a 6% lower offer ($215k) is reasonable based on typical stale-listing flexibility.
- Current owner paid $65k; list at $229k implies a 252% gain — meaningful room to come down on a strong offer.
Risks & watch-outs
- Watch-outs: HOA is 22% of rent.
- Climate carrying-cost: severe wind risk, 99% chance of damaging wind over 30y; extreme-heat days projected 7→26/yr by 2055 (HVAC capex compounding) — expect insurance premiums to compound above CPI over the hold.
Questions for the listing agent
- What do current leases actually rent for vs. the listed asking? Can we see a recent rent roll and the last 12 months of T-12 income?
- It's been on market 69 days. Have you received any prior offers? Is the seller open to a 7% concession, seller financing, or rate buy-down credit?
- What does the HOA fee cover, when was the last increase, and are there any pending special assessments or reserve-fund shortfalls?
- Any open or pending special assessments — roof, HVAC, plumbing, elevator, façade? What's the per-unit balance and payoff schedule, and is the seller paying it off at close or rolling it to the buyer?
- Why hasn't it sold? Are there any deal-killer items the seller is aware of (foundation, flood, title, zoning, code violations)?
- Is there a deadline driving the sale (1031 exchange, divorce, estate, relocation)? That informs how much negotiation room exists.
- Schools are B-rated — typically a magnet for longer-tenancy family renters. What's the average tenant stay here, and is there a school-zone premium baked into asking?
- Crime grade is D in this area — have there been break-ins, vandalism, or insurance claims at this property in the last 3 years? What carrier currently insures it and at what premium?
- The area grade is low — what's the realistic commute time and amenity access for the typical tenant pool here? Any planned neighborhood developments (good or bad) we should know about?
- What's the average days-on-market for RENTAL listings here right now (not sales)? A rising rental-DOM trend means longer vacancies and softer asking-rent achievability than the comps imply.
- What's the recent tenant-quality profile in this submarket — average credit score on applications, eviction rate, late-payment / NSF rate, and stable-employment percentage? A property-management company in the area should have these aggregated.
- How much new apartment / multifamily construction is in the pipeline within 1–3 miles? Heavy new supply (>2% of stock underway) typically softens rents 12–24 months out; light construction supports rent growth.
Investment metrics
- 1% rule
- 1.13% ✓
- Cap rate
- 5.85%
- Cash-on-cash
- -1.59%
- DSCR
- 0.93
- GRM
- 7.4
CMA / ARV
No comps found within radius.
Projected returns pro-forma
-3.0% appreciation · 1.83% rent growth · sell at horizon
- IRR
- -20.5%
- Equity multiple
- 0.30×
- Total profit
- $-45,163
- Equity at exit
- $34,145
- IRR
- -17.2%
- Equity multiple
- 0.11×
- Total profit
- $-56,841
- Equity at exit
- $19,800
Cash invested: $64,120 (down + closing). Projections, not guarantees.
Landlord ↔ Tenant lean methodology
- Overall (STATE)
- 87 Strongly Landlord-Friendly
- State Florida
- 87 Strongly Landlord-Friendly · R+3
- County
- — inherits STATE
- City
- — inherits STATE
ZIP-level market 33445
- Rents YoY
- 1.8%
- Active inventory
- 359
- Price-to-rent
- 7.4×
Monthly cashflow live
- Estimated rent
- $2,583 high interval (Pro) →
- Mortgage (P&I)
- −$1,201
- Tax from tax record
- −$259 /mo · $3,113/yr
- Insurance
- −$95
- HOA
- −$570
- Vacancy / Maint / Mgmt
- −$542
- Net cashflow
- $-85
Break-even live
Sensitivity live
| Price | -10% $45 | -5% $-20 | +0% $-85 | +5% $-150 | +10% $-215 |
|---|---|---|---|---|---|
| Rent | -10% $-289 | -5% $-187 | +0% $-85 | +5% $17 | +10% $119 |
| Rate | -1.0pp $30 | -0.5pp $-27 | base $-85 | +0.5pp $-144 | +1.0pp $-205 |
UW: 25.0% down · 7.5% · 30yr · 1.5% tax · 5.0% vac · 8.0% maint · 8.0% mgmt
Financing live
Cash to close
- Down payment
- $57,250
- Closing costs
- $6,870
- Reserves months
- —
- Total cash needed
- —
Loan-product check · same deal, 3 products live
Conventional
25% down · 7.5% · 30yr
- Down + closing
- —
- Monthly P&I
- —
- Monthly cashflow
- —
- DSCR
- —
- Eligible?
- —
Personal DTI + credit; lowest rate.
DSCR
20% down · 8.5% · 30yr
- Down + closing
- —
- Monthly P&I
- —
- Monthly cashflow
- —
- DSCR
- —
- Eligible?
- —
No personal income docs; deal must DSCR.
Hard money
10% down · 12.0% · 12mo
- Down + closing
- —
- Monthly P&I
- —
- Monthly cashflow
- —
- DSCR
- —
- Eligible?
- —
Short-term bridge; refi at stabilization.
Rent comps 40 comps
| Address | Beds | Baths | Sqft | Rent | $/sqft | DOM | Units | Dist |
|---|---|---|---|---|---|---|---|---|
| 1560 NW 18th Ave #104 Delray Beach, FL | 2.0 | 2.0 | 1148 | $2,100 | $1.83 | 22d | 1 | 0.01mi |
| 1560 NW 18th Ave #104 Delray Beach, FL | 2.0 | 2.0 | 1148 | $2,100 | $1.83 | 23d | 1 | 0.01mi |
| 1520 NW 19th Ter #203 Delray Beach, FL | 2.0 | 2.0 | 1335 | $2,200 | $1.65 | 26d | 1 | 0.04mi |
| 1860 NW 13th St #201 Delray Beach, FL | 2.0 | 2.0 | 1335 | $2,800 | $2.10 | 26d | 1 | 0.04mi |
| 1441 NW 19th Ter #201 Delray Beach, FL | 2.0 | 2.0 | 1148 | $2,250 | $1.96 | 26d | 1 | 0.07mi |
| 1551 NW 20th Ave #102 Delray Beach, FL | 2.0 | 2.0 | 1148 | $1,995 | $1.74 | 26d | 1 | 0.08mi |
| 1640 NW 19th Ter #103 Delray Beach, FL | 2.0 | 2.0 | 1148 | $1,950 | $1.70 | 9d | 1 | 0.09mi |
| 1640 NW 19th Ter #103 Delray Beach, FL | 2.0 | 2.0 | 1148 | $1,950 | $1.70 | 23d | 1 | 0.09mi |
| 1641 NW 19th Ter Unit 46A Delray Beach, FL | 2.0 | 2.0 | 1104 | $2,000 | $1.81 | 20d | 1 | 0.09mi |
| 1631 NW 18th Ave #201 Delray Beach, FL | 2.0 | 2.0 | 1148 | $3,300 | $2.87 | 26d | 1 | 0.11mi |
| 1440 NW 20th Ave #104 Delray Beach, FL | 2.0 | 2.0 | 1335 | $2,650 | $1.99 | 15d | 1 | 0.15mi |
| 340 Lake Monterey Cir Boynton Beach, FL | 2.0 | 2.5 | 1188 | $2,350 | $1.98 | 26d | 1 | 0.31mi |
| 169 Monterey Bay Dr Boynton Beach, FL | 3.0 | 2.5 | 1389 | $2,800 | $2.02 | 16d | 1 | 0.32mi |
| 169 Monterey Bay Dr Boynton Beach, FL | 3.0 | 2.5 | 1389 | $2,800 | $2.02 | 26d | 1 | 0.32mi |
| 161 Monterey Bay Dr #161 Boynton Beach, FL | 2.0 | 2.5 | 1188 | $2,200 | $1.85 | 4d | 1 | 0.33mi |
| 161 Monterey Bay Dr #161 Boynton Beach, FL | 2.0 | 2.5 | 1188 | $2,250 | $1.89 | 15d | 1 | 0.33mi |
| 161 Monterey Bay Dr #161 Boynton Beach, FL | 2.0 | 2.5 | 1188 | $2,300 | $1.94 | 26d | 1 | 0.33mi |
| 161 Monterey Bay Dr Boynton Beach, FL | 2.0 | 2.5 | 1188 | $2,300 | $1.94 | 5d | 1 | 0.33mi |
| 161 Monterey Bay Dr Boynton Beach, FL | 2.0 | 2.5 | 1188 | $2,300 | $1.94 | 20d | 1 | 0.33mi |
| 138 Monterey Bay Dr Boynton Beach, FL | 3.0 | 2.5 | 1551 | $2,800 | $1.81 | 3d | 1 | 0.35mi |
| 1630 NW 22nd Ave Delray Beach, FL | 3.0 | 2.0 | 1560 | $4,200 | $2.69 | 26d | 1 | 0.35mi |
| 1770 NW 22nd Ave Delray Beach, FL | 3.0 | 2.0 | 1850 | $7,000 | $3.78 | 18d | 1 | 0.39mi |
| 400 Lake Monterey Cir Boynton Beach, FL | 2.0 | 2.5 | 1144 | $2,400 | $2.10 | 12d | 1 | 0.40mi |
| 101 Lake Monterey Cir Boynton Beach, FL | 3.0 | 3.0 | 1584 | $2,999 | $1.89 | 22d | 1 | 0.46mi |
| 182 Lake Monterey Cir Boynton Beach, FL | 2.0 | 2.5 | 1423 | $2,500 | $1.76 | 26d | 1 | 0.46mi |
| 182 Lake Monterey Cir Boynton Beach, FL | 2.0 | 2.5 | 1423 | $2,500 | $1.76 | 23d | 1 | 0.46mi |
| 183 Lake Monterey Cir Boynton Beach, FL | 3.0 | 3.0 | 1584 | $2,800 | $1.77 | 26d | 1 | 0.48mi |
| 2583 NW 13th St Delray Beach, FL | 2.0 | 2.0 | 1466 | $2,600 | $1.77 | 19d | 1 | 0.58mi |
| 61 Eastgate Dr Unit A Boynton Beach, FL | 2.0 | 2.0 | 1572 | $7,000 | $4.45 | 26d | 1 | 0.62mi |
| 500 N Congress Ave Delray Beach, FL | 2.0–3.0 | 1.0–2.0 | 989 | $2,295 | $2.32 | 1d | 6 | 0.70mi |
| 1105 Anchor Pt Delray Beach, FL | 3.0 | 2.0 | 1641 | $5,700 | $3.47 | 20d | 1 | 0.71mi |
| 494 Enfield Ct Unit Na Delray Beach, FL | 3.0 | 2.0 | 1641 | $6,500 | $3.96 | 26d | 1 | 0.73mi |
| 2915 NW 12th St Unit D Delray Beach, FL | 2.0 | 2.0 | 1499 | $3,200 | $2.13 | 9d | 1 | 0.75mi |
| 2622 NW 7th Ct Delray Beach, FL | 2.0 | 2.5 | 1384 | $2,750 | $1.99 | 26d | 1 | 0.78mi |
| 872 NW 29th Ave Unit A Delray Beach, FL | 2.0 | 2.0 | 1188 | $2,700 | $2.27 | 26d | 1 | 0.81mi |
| 2712 Lake Ida Rd Delray Beach, FL | 3.0 | 2.0 | 1604 | $4,000 | $2.49 | 9d | 1 | 0.85mi |
| 1335 Lee St Delray Beach, FL | 3.0 | 2.0 | 1000 | $3,200 | $3.20 | 26d | 1 | 0.88mi |
| 9 Stratford Dr E Unit B Boynton Beach, FL | 3.0 | 2.0 | 1622 | $5,990 | $3.69 | 0d | 1 | 0.88mi |
| 1720 Depot Ave Delray Beach, FL | 2.0 | 2.0 | 1189 | $2,650 | $2.23 | 26d | 1 | 0.89mi |
| 1720 Depot Ave Delray Beach, FL | 2.0 | 2.0 | 1199 | $2,874 | $2.40 | 15d | 1 | 0.89mi |
HOA detail condo
- Monthly dues
- $570 · $6,840/yr
- Likely covers
- poolsecurity
- Assessments
- None detected in remarks — confirm with the listing agent.
Listing history 18 events
-
2026-06-21days on market $229,000 Active 69 DOM
-
2026-06-18days on market $229,000 Active 66 DOM
-
2026-06-17days on market $229,000 Active 65 DOM
-
2026-06-16days on market $229,000 Active 64 DOM
-
2026-06-15days on market $229,000 Active 63 DOM
-
2026-06-13days on market $229,000 Active 61 DOM
-
2026-06-09days on market $229,000 Active 57 DOM
-
2026-06-08days on market $229,000 Active 56 DOM
-
2026-06-07days on market $229,000 Active 55 DOM
-
2026-06-04days on market $229,000 Active 52 DOM
-
2026-06-03days on market $229,000 Active 51 DOM
-
2026-06-02days on market $229,000 Active 50 DOM
-
2026-06-01days on market $229,000 Active 49 DOM
-
2026-05-31days on market $229,000 Active 48 DOM
-
2026-04-12$229,000 Active
-
2002-10-01soldstatus $65,000
-
1989-05-23soldstatus $45,000
-
1987-02-01soldstatus $50,000
ⓘ Source: listings_history table (triggers on properties + properties_extension) + one-shot
backfill from property_details.listing_events for pre-trigger history.
Tax reassessment forecast FL · Resets to sale price
- Current annual tax
- $3,113 · $259/mo
- Projected year-2 tax
- $3,113 · $259/mo
- Expected delta
- $0/yr ($0/mo · 0.0%)
ⓘ Screening estimate from a state-policy table — verify with the county assessor before closing.
Climate risk First Street
- Flood 1/10 Low FEMA zone X (unshaded) · 0% chance over 30 yrs
- Wildfire 1/10 Low
- Heat 10/10 Extreme 7 d/yr ≥105°F today · 26 d/yr by 30 yrs out
- Wind 10/10 Extreme 99% chance of damaging wind over 30 yrs
- Air quality 2/10 Low 1 unhealthy d/yr today · 2 by 30 yrs out
Nearby sold comps map
Loading sold comps map…
Walkable amenities ~0.75 mi
Loading nearby amenities…
Taxation est. · year 1
- Rental income
- $30,997
- − Mortgage interest
- −$12,828
- − Property taxes
- −$3,113
- − Insurance
- −$1,145
- − Repairs & maintenance
- −$2,480
- − Management
- −$2,480
- − HOA
- −$6,840
- − Depreciation
- −$6,662
- Taxable loss
- −$4,550
- Est. tax savings @ 24.0%
- +$1,092
- After-tax cash flow
- $71/yr
For passive investors: Depreciation is non-cash, so a rental often shows a tax loss while cash-flowing — sheltering income. Rental losses are passive: they offset passive income freely, and up to $25,000/yr can offset ordinary (W-2) income if you actively participate and your MAGI is under $100k (phasing out to $0 by $150k); unused losses carry forward. On sale, claimed depreciation is recaptured at up to 25%, and gains may owe capital-gains tax (a 1031 exchange can defer both). Figures are a year-1 estimate at your 24.0% rate — not tax advice; consult a CPA.
Schools (NCES district)
- District
- Palm Beach
- NCES district ID
- 1201500
- Math proficiency
- 46% ▼ -16.00%
- Reading proficiency
- 53% ▼ -4.00%
- Median HH income
- $53,943
- Composite
- 42.72/100
- National rank
- #3160
- State rank
- #34 of 73 in FL
Livability — Delray Beach
- Score
- 77/100
- State rank
- #202
- US rank
- #3160
Category grades
Schools grade is shown separately in the Schools card above.
Census & demographics
- Census place
- Delray Beach, FL
- County
- Palm Beach County · 1,438,312 people
- City population
- 123,167
- Metro
- Miami-Fort Lauderdale-Pompano Beach, FL
- Population (ZIP)
- 33,122
- Household income
- $78,163
- Rent vs Own
- Severe rent burden
- 1649.0
Population outlook (Palm Beach County) Hauer SSP2
- Today (2025)
- 1,637,487 people
- By 2030
- 1,743,255 · +6.5%
- By 2040
- 1,948,712 · +19.0%
- By 2050
- 2,132,979 · +30.3%
- By 2075
- 2,530,027 · +54.5%
- By 2100
- 2,706,979 · +65.3%
Race, ethnicity, and origin ACS 2023
- Neighborhood character
- Diverse neighborhood (Simpson 0.62)
- Race & ethnicity
- White 55% Black 24% Hispanic / Latino 11% Two or more races 11% Asian 4%
- Hispanic origin (detail)
- Puerto Rican 3% Cuban 2%
- Common ancestry
- Hispanic 14% Romanian 3% Scotch-Irish 3%
- Foreign-born
- 27% · Canada, Jamaica, Dominican Republic
- Languages at home
- 66% English-only · French/Haitian/Cajun 18% Spanish 9% Other Indo-European 4%
Political lean MEDSL · Palm Beach
- 2024 margin
- Toss-up / Even · D 50.0% · R 49.2%
- 2008→2024 swing
- -22.1pp toward R · 2008: 22.9pp · 2024: 0.8pp
- All cycles
- 2024: D+0.8 2020: D+12.8 2016: D+15.3 2012: D+17.0 2008: D+22.9
Not yet ingested
- Civics
- —
Market trends
- HPI YoY
- ▼ -258.16%
- Current HPI
- 349.5505
- Rent YoY
- ▲ 1.83%
- Metro
- Miami-Fort Lauderdale-Pompano Beach, FL
- State GDP YoY
- ▲ 3.28%
- F500 in state
- 36
Industry mix (Fortune 500 HQ in FL)
| Industry | F500 HQs | Revenue |
|---|---|---|
| Industrial Technology | 2 | $29B |
|
||
| Insurance | 2 | $17B |
|
||
| Retail | 1 | $60B |
|
||
| Technology Distribution | 1 | $58B |
|
||
| Homebuilding | 1 | $35B |
|
||
| Technology Manufacturing | 1 | $35B |
|
||
Price history
+358.0% since first listed4 events — show timeline
- 2026-04-12 Listed $229,000 Beaches MLS
- 2002-10-01 Sold (Public Records) $65,000 Public Records
- 1989-05-23 Sold (Public Records) $45,000 Public Records
- 1987-02-01 Sold (Public Records) $50,000 Public Records
Property tax history
+11.8%/yrLatest (2025): $3,113 · -11.8% YoY. Source: county tax records.
Cash-flow waterfall
monthlySold comps — $/sqft
last 12 mo · ≤1 miLoading sold comps…