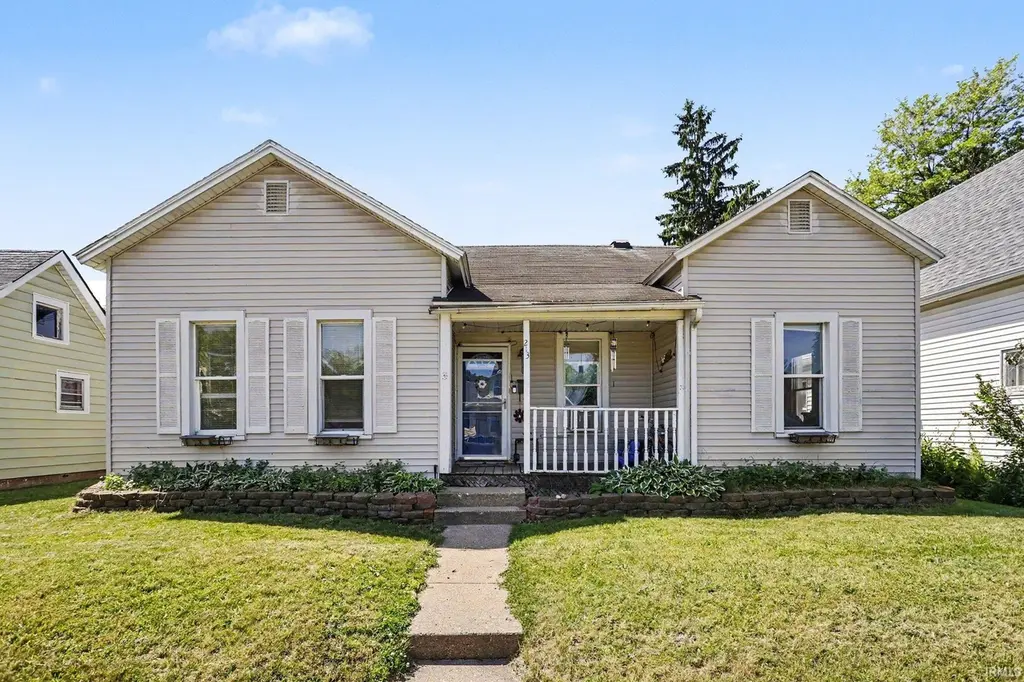
213 E Lawrence St · Mishawaka, IN
Flood risk 1/10 · Minimal
- FEMA flood zone
- X (unshaded)
- Chance of flooding over 30 yrs
- 0.0%
- Est. flood insurance / yr
- $473 – $860
Fire risk 1/10 · Minimal
- Est. fire insurance / yr
- $717 – $1,331
Heat risk 3/10 · Minor
- Hot days now (above 100°F)
- 7 days/yr
- Hot days in 30 yrs
- 16 days/yr
Wind risk 2/10 · Minimal
- Chance of severe wind over 30 yrs
- —
Air-quality risk 3/10 · Minor
- Unhealthy air days now
- 2 days/yr
- Unhealthy air days in 30 yrs
- 3 days/yr
Risk factors via First Street. Map © Google.
Why this score? — see what drove the D+ grade
The composite is a weighted blend of 9 inputs, each scored 0–100. Each bar is that input's sub-score; the figure is the points it added to the 100-point composite (weight × sub-score).
- Cash flow +15.8/30.0
- ARV discount +11.5/15.0
- DSCR +4.9/10.0
- Rent growth +3.8/5.0
- Livability +3.8/5.0
- 1% rule +3.6/10.0
- Condition / age +2.5/5.0
- Schools +2.2/10.0
- Appreciation +0.0/10.0
$165,000
🖨 Deal sheet (PDF) 📄 Offer letter ✓ Due diligence
Listing remarks MLS
Beautifully decorated ready to move in home in a great location. Within walking distance to downtown, river walk, parks and schools. Newer kitchen, bath, paint, and more. The home includes all appliances plus a washer and dryer. WILL CONSIDER VA & FHA
Key facts
- Covered front porch
- Freshened kitchen
- Hardwood floors
Tags
Property features AI
Finance
- Other: Subdivision: Lawrence & Battells; Directions available: Main Street east on Lawrence, past Sarah; home is on the south side of the street
- Financial info: Tax information not included
- HOA & community: No HOA information provided
Exterior
- Parking: Parking details not provided
- Security: No security features listed
- Utilities: Public water; Public sewer
- Home design: Single-family, site-built home; One story
- Construction: Vinyl siding; Block foundation; Shingle roof; Built area above grade: 1,109 (value provided)
- Exterior features: Privacy wood fencing; Level lot; Lot approximately 51' x 114'
Interior
- Kitchen: Microwave; Refrigerator; Electric range
- Bedrooms: Bedrooms not specified
- Flooring: Hardwood; Carpet
- Bathrooms: One full bathroom (main level)
- Heating & cooling: Natural gas forced air heating; Window cooling units
- Interior features: Microwave; Refrigerator; Electric range; Gas water heater; Water heater; One fireplace; Partial unfinished basement; Seven total rooms
- Laundry & utility: Washer; Dryer; Laundry on main level
Neighborhood map
What this means for you Summary
Snapshot
- This is a 2-bed/1.0-bath single-family listed at $165k.
Deal economics
- At list price, monthly cash flow is $75 ($901/yr) — positive.
- The deal already cash-flows at list — no discount required.
- To meet the 1% rule (rent ≥ 1% of price), the offer needs to be $142k (13.9% below list).
- Recommended offer: $142k (13.9% below list) — sets the bar for 1% rule.
- Cap rate 6.8% vs local median 5.3% in Mishawaka — meaningfully above typical; check what's discounted (condition, days-on-market, listing class) to confirm the premium yield is real.
Location & tenants
- Location reads 76/100 on livability (#53 in IN, #3,586 nationally) — a middle-class / working-renter tenant base. Strengths: cost of living A+, housing A+, health & safety B; Watch: amenities F, employment F.
- School City Of Mishawaka (urban): math 23% / reading 30% proficiency, ranked #260 of 301 in IN (top 86%) — low school quality limits family demand, transient renter base, plan for 1-2y turnover.
- Zoned schools: Battell Elementary School (math 27% / reading 22%, grade F, #762 of 994 statewide, top 78%, 290 students, 78% FRL); John J Young Middle School (math 17% / reading 30%, grade F, #257 of 330 statewide, top 79%, 735 students, 74% FRL); Mishawaka High School (math 24% / reading 60%, grade F, #197 of 369 statewide, top 57%, 1,488 students, 65% FRL) — zoned schools average 72% FRL vs 54% district-wide (18 pts higher); higher-poverty schools than district average — tighter screening recommended.
- Market conditions: Rents rising fast (+5.2%/yr); 78 active listings in the ZIP; 20 comparable units currently listed for rent nearby; rentals at typical pace (median 15d on market — plan ~3-4 weeks tenant-placement turnaround); 754 units permitted in St. Joseph County in 2024 (460 in 5+ unit buildings).
Forward outlook
- Local home prices are declining (-3.0%/yr); year-one equity from $1k of loan paydown is wiped out by about $5k of value loss. Plan a longer hold.
Negotiation context
- It's been on market 21 days — a 2% lower offer ($163k) is reasonable based on typical stale-listing flexibility.
- 5 sale attempts since 13y ago with the ask held roughly flat each time — persistent listings suggest the price (not the market) is what's stuck; bring a comps-based counter.
- Current owner paid $125k; 32% above their basis — modest negotiation headroom, anchor on the comps not their cost.
Risks & watch-outs
- Watch-outs: built in 1890 — expect roof / HVAC / electrical / plumbing capex.
Questions for the listing agent
- Built in 1890 — when were the roof, HVAC, electrical panel, plumbing, and water heater last replaced?
- Is there a deadline driving the sale (1031 exchange, divorce, estate, relocation)? That informs how much negotiation room exists.
- The area grade is low — what's the realistic commute time and amenity access for the typical tenant pool here? Any planned neighborhood developments (good or bad) we should know about?
- What's the average days-on-market for RENTAL listings here right now (not sales)? A rising rental-DOM trend means longer vacancies and softer asking-rent achievability than the comps imply.
- What's the recent tenant-quality profile in this submarket — average credit score on applications, eviction rate, late-payment / NSF rate, and stable-employment percentage? A property-management company in the area should have these aggregated.
- How much new for-sale + rental construction is in the pipeline within 1–3 miles? Heavy new supply typically softens prices + rents 12–24 months out; constrained supply supports both.
Investment metrics
- 1% rule
- 0.86% ✗
- Cap rate
- 6.84%
- Cash-on-cash
- 1.95%
- DSCR
- 1.09
- GRM
- 9.7
CMA / ARV
- ARV (on-the-fly)
- $181,120
- Comps found
- 12
Show comp detail 12 sales within ~0.75 mi
| Address | Dist | Beds/Ba | Sqft | Sold | Price | $/sf | Match |
|---|---|---|---|---|---|---|---|
| 131 E Marion St | 0.20mi | 2/1.5 | 1,232 (+9%) | 1mo | $172,000 | $140 | 73 |
| 522 E Battell St | 0.24mi | 3/1.0 (+1) | 1,099 (-3%) | 8mo | $111,250 | $101 | 72 |
| 209 E Borley Ave | 0.41mi | 3/2.0 (+1) | 1,128 (-0%) | 2mo | $215,000 | $191 | 70 |
| 210 E Marion St | 0.21mi | 3/1.0 (+1) | 1,200 (+6%) | 7mo | $170,000 | $142 | 69 |
| 125 E Omer Ave | 0.64mi | 2/1.0 | 1,131 (-0%) | 4mo | $170,600 | $151 | 66 |
| 428 W Jefferson Blvd | 0.61mi | 3/1.0 (+1) | 1,113 (-2%) | 2mo | $232,000 | $208 | 63 |
| 239 E Jefferson Blvd | 0.36mi | 2/1.0 | 1,020 (-10%) | 6mo | $84,000 | $82 | 61 |
| 239 E Edgar Ave | 0.52mi | 2/2.0 | 1,066 (-6%) | 2mo | $185,000 | $174 | 60 |
| 703 Maple St | 0.52mi | 2/1.0 | 1,047 (-8%) | 3mo | $95,000 | $91 | 60 |
| 523 Alice St | 0.32mi | 3/1.5 (+1) | 1,216 (+7%) | 8mo | $195,000 | $160 | 60 |
| 1002 E Broadway St | 0.54mi | 3/2.0 (+1) | 1,172 (+4%) | 2mo | $205,000 | $175 | 58 |
| 717 E Grove St | 0.35mi | 3/2.0 (+1) | 1,204 (+6%) | 8mo | $195,000 | $162 | 58 |
Match score weights: distance 35% · size 25% · config 20% · recency 20%. Top-matched comps best support the ARV.
Projected returns pro-forma
-3.0% appreciation · 5.2% rent growth · sell at horizon
- IRR
- -11.0%
- Equity multiple
- 0.59×
- Total profit
- $-18,777
- Equity at exit
- $24,602
- IRR
- 1.0%
- Equity multiple
- 1.07×
- Total profit
- $3,461
- Equity at exit
- $14,266
Cash invested: $46,200 (down + closing). Projections, not guarantees.
Landlord ↔ Tenant lean methodology
- Overall (STATE)
- 90 Strongly Landlord-Friendly
- State Indiana
- 90 Strongly Landlord-Friendly · R+11
- County
- — inherits STATE
- City
- — inherits STATE
ZIP-level market 46545
- Rents YoY
- 5.2%
- Active inventory
- 78
- Price-to-rent
- 9.7×
Monthly cashflow live
- Estimated rent
- $1,421 high interval (Pro) →
- Mortgage (P&I)
- −$865
- Tax from tax record
- −$114 /mo · $1,365/yr
- Insurance
- −$69
- HOA
- −$0
- Vacancy / Maint / Mgmt
- −$298
- Net cashflow
- $75
Break-even live
Sensitivity live
| Price | -10% $168 | -5% $122 | +0% $75 | +5% $28 | +10% $-18 |
|---|---|---|---|---|---|
| Rent | -10% $-37 | -5% $19 | +0% $75 | +5% $131 | +10% $187 |
| Rate | -1.0pp $158 | -0.5pp $117 | base $75 | +0.5pp $32 | +1.0pp $-11 |
UW: 25.0% down · 7.5% · 30yr · 1.5% tax · 5.0% vac · 8.0% maint · 8.0% mgmt
Financing live
Cash to close
- Down payment
- $41,250
- Closing costs
- $4,950
- Reserves months
- —
- Total cash needed
- —
Loan-product check · same deal, 3 products live
Conventional
25% down · 7.5% · 30yr
- Down + closing
- —
- Monthly P&I
- —
- Monthly cashflow
- —
- DSCR
- —
- Eligible?
- —
Personal DTI + credit; lowest rate.
DSCR
20% down · 8.5% · 30yr
- Down + closing
- —
- Monthly P&I
- —
- Monthly cashflow
- —
- DSCR
- —
- Eligible?
- —
No personal income docs; deal must DSCR.
Hard money
10% down · 12.0% · 12mo
- Down + closing
- —
- Monthly P&I
- —
- Monthly cashflow
- —
- DSCR
- —
- Eligible?
- —
Short-term bridge; refi at stabilization.
Rent comps 20 comps
| Address | Beds | Baths | Sqft | Rent | $/sqft | DOM | Units | Dist |
|---|---|---|---|---|---|---|---|---|
| 232 E Grove St Mishawaka, IN | 3.0 | 1.0 | 1188 | $1,500 | $1.26 | 15d | 1 | 0.06mi |
| 116 W Mishawaka Ave Mishawaka, IN | 3.0 | 1.0–2.0 | 948 | $1,914 | $2.02 | 15d | 31 | 0.20mi |
| 724 Elizabeth St Mishawaka, IN | 1.0 | 1.0 | 850 | $875 | $1.03 | 15d | 1 | 0.20mi |
| 602 E Battell St Mishawaka, IN | 1.0 | 1.0 | 980 | $1,400 | $1.43 | 22d | 1 | 0.26mi |
| 365 W Front St Mishawaka, IN | 2.0 | 1.0–2.0 | 825 | $3,050 | $3.70 | 15d | 1 | 0.44mi |
| 209 E Edgar Ave Mishawaka, IN | 3.0 | 1.0 | 1400 | $1,400 | $1.00 | 15d | 1 | 0.51mi |
| 516 W 3rd St Apt 1 Mishawaka, IN | 1.0 | 1.0 | 750 | $800 | $1.07 | 22d | 1 | 0.66mi |
| 516 W 3rd St #6 Mishawaka, IN | 2.0 | 1.0 | 700 | $800 | $1.14 | 15d | 1 | 0.66mi |
| 722 S Spring St Apt 3 Mishawaka, IN | 2.0 | 1.0 | 800 | $1,200 | $1.50 | 15d | 1 | 0.96mi |
| 1006 S 35th St South Bend, IN | 3.0 | 2.0 | 816 | $1,000 | $1.23 | 15d | 1 | 1.07mi |
| 3530 Northside Blvd South Bend, IN | 1.0–2.0 | 1.0 | 850 | $1,200 | $1.41 | 15d | 1 | 1.09mi |
| 642 E 11th St Mishawaka, IN | 3.0 | 1.0 | 1248 | $1,295 | $1.04 | 22d | 1 | 1.13mi |
| 703 E 12th St Unit A Mishawaka, IN | 2.0 | 1.0 | 900 | $1,295 | $1.44 | 45d | 1 | 1.24mi |
| 703 E 12th St Unit D Mishawaka, IN | 2.0 | 1.0 | 850 | $1,395 | $1.64 | 15d | 1 | 1.24mi |
| 117 Palau Ave Mishawaka, IN | 3.0 | 1.0 | 1100 | $1,650 | $1.50 | 15d | 1 | 1.25mi |
| 1918 N Byrkit St Mishawaka, IN | 2.0 | 1.0 | 770 | $1,250 | $1.62 | 15d | 1 | 1.30mi |
| 300 Pin Oak Cir Mishawaka, IN | 1.0–3.0 | 1.0–1.5 | 835 | $1,052 | $1.26 | 15d | 1 | 1.30mi |
| 3001 E Jefferson Blvd South Bend, IN | 1.0–2.0 | 1.0–2.0 | 848 | $1,329 | $1.57 | 15d | 21 | 1.30mi |
| 737 S 30th St South Bend, IN | 3.0 | 2.0 | 1000 | $1,600 | $1.60 | 45d | 1 | 1.38mi |
| 303 Village Dr Mishawaka, IN | 1.0–3.0 | 1.0–1.5 | 918 | $1,619 | $1.76 | 15d | 25 | 1.48mi |
Listing history 14 events
-
2026-06-22days on market $165,000 Active 21 DOM
-
2026-06-18days on market $165,000 Active 18 DOM
-
2026-06-17days on market $165,000 Active 17 DOM
-
2026-06-16days on market $165,000 Active 16 DOM
-
2026-06-15days on market $165,000 Active 15 DOM
-
2026-06-14pricedays on market $165,000 Active 13 DOM
-
2026-06-13days on market $170,000 Active 12 DOM
-
2026-06-10days on market $170,000 Active 10 DOM
-
2026-06-09days on market $170,000 Active 9 DOM
-
2026-06-08days on market $170,000 Active 8 DOM
-
2026-06-07days on market $170,000 Active 7 DOM
-
2026-06-02days on market $170,000 Active 2 DOM
-
2026-06-01remarks 277-char remark
-
2026-06-01$170,000 Active 1 DOM
ⓘ Source: listings_history table (triggers on properties + properties_extension) + one-shot
backfill from property_details.listing_events for pre-trigger history.
Tax reassessment forecast IN · Partial reset (capped growth)
- Current annual tax
- $1,365 · $114/mo
- Projected year-2 tax
- $1,384 · $115/mo
- Expected delta
- +$19/yr (+$2/mo · 1.4%)
ⓘ Screening estimate from a state-policy table — verify with the county assessor before closing.
Climate risk First Street
- Flood 1/10 Low FEMA zone X (unshaded) · 0% chance over 30 yrs
- Wildfire 1/10 Low
- Heat 3/10 Moderate 7 d/yr ≥100°F today · 16 d/yr by 30 yrs out
- Wind 2/10 Low
- Air quality 3/10 Moderate 2 unhealthy d/yr today · 3 by 30 yrs out
Nearby sold comps map
Loading sold comps map…
Walkable amenities ~0.75 mi
Loading nearby amenities…
Taxation est. · year 1
- Rental income
- $17,056
- − Mortgage interest
- −$9,243
- − Property taxes
- −$1,365
- − Insurance
- −$825
- − Repairs & maintenance
- −$1,364
- − Management
- −$1,364
- − Depreciation
- −$4,800
- Taxable loss
- −$1,906
- Est. tax savings @ 24.0%
- +$457
- After-tax cash flow
- $1,358/yr
For passive investors: Depreciation is non-cash, so a rental often shows a tax loss while cash-flowing — sheltering income. Rental losses are passive: they offset passive income freely, and up to $25,000/yr can offset ordinary (W-2) income if you actively participate and your MAGI is under $100k (phasing out to $0 by $150k); unused losses carry forward. On sale, claimed depreciation is recaptured at up to 25%, and gains may owe capital-gains tax (a 1031 exchange can defer both). Figures are a year-1 estimate at your 24.0% rate — not tax advice; consult a CPA.
Schools (NCES district)
- District
- School City Of Mishawaka
- NCES district ID
- 1806840
- Math proficiency
- 23% ▼ -9.00%
- Reading proficiency
- 30% ▼ -7.00%
- Median HH income
- $39,290
- Composite
- 22.26/100
- National rank
- #8143
- State rank
- #260 of 301 in IN
Livability — Mishawaka
- Score
- 76/100
- State rank
- #53
- US rank
- #3586
Category grades
Schools grade is shown separately in the Schools card above.
Census & demographics
- Census place
- Mishawaka, IN
- County
- Saint Joseph County · 189,048 people
- City population
- 57,683
- Metro
- South Bend-Mishawaka, IN-MI
- Population (ZIP)
- 26,606
- Household income
- $56,865
- Rent vs Own
- Severe rent burden
- 1243.0
Population outlook (St. Joseph County) Hauer SSP2
- Today (2025)
- 273,186 people
- By 2030
- 273,594 · +0.1%
- By 2040
- 271,641 · -0.6%
- By 2050
- 269,187 · -1.5%
- By 2075
- 263,136 · -3.7%
- By 2100
- 245,659 · -10.1%
Race, ethnicity, and origin ACS 2023
- Neighborhood character
- Predominantly White (78%)
- Race & ethnicity
- White 78% Two or more races 8% Black 7% Hispanic / Latino 6% Asian 3%
- Hispanic origin (detail)
- Mexican 2%
- Common ancestry
- Romanian 6% Lithuanian 2% English 2%
- Foreign-born
- 8% · Canada, China, South Korea
- Languages at home
- 90% English-only · Spanish 4% Chinese 1% Other Indo-European 1%
Political lean MEDSL · St. Joseph
- 2024 margin
- Toss-up / Even · D 50.0% · R 48.5% · Other 1.5%
- 2008→2024 swing
- -15.6pp toward R · 2008: 17.1pp · 2024: 1.5pp
- All cycles
- 2024: D+1.5 2020: D+5.8 2016: D+0.2 2012: D+3.5 2008: D+17.1
Not yet ingested
- Civics
- —
Market trends
- HPI YoY
- ▼ -114.83%
- Current HPI
- 188.2811
- Rent YoY
- ▲ 5.20%
- Metro
- South Bend-Mishawaka, IN-MI
- State GDP YoY
- ▲ 2.90%
- F500 in state
- 18
Industry mix (Fortune 500 HQ in IN)
| Industry | F500 HQs | Revenue |
|---|---|---|
| Industrial Machinery | 2 | $37B |
|
||
| Healthcare | 1 | $177B |
|
||
| Pharmaceuticals | 1 | $45B |
|
||
| Metals / Steel | 1 | $18B |
|
||
| Agriculture | 1 | $17B |
|
||
| Packaging | 1 | $12B |
|
||
Price history
+146.4% since first listed9 events — show timeline
- 2026-06-01 Listed $170,000 IRMLS
- 2022-09-30 Sold (MLS) $125,000 IRMLS
- 2022-09-07 Pending — IRMLS
- 2022-07-28 Listed $129,900 IRMLS
- 2017-01-19 Sold (MLS) $63,000 IRMLS
- 2016-09-23 Listed $69,900 IRMLS
- 2015-05-02 Listed $71,000 IRMLS
- 2014-09-08 Sold (MLS) $62,000 IRMLS
- 2013-09-16 Listed $69,000 IRMLS
Property tax history
+1.9%/yrLatest (2024): $1,365 · -3.1% YoY. Source: county tax records.
Cash-flow waterfall
monthlySold comps — $/sqft
last 12 mo · ≤1 miLoading sold comps…