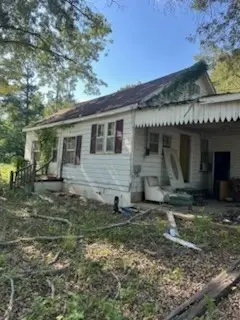
1035 Main St E · Savannah, TN
Flood risk 1/10 · Minimal
- FEMA flood zone
- X (unshaded)
- Chance of flooding over 30 yrs
- 0.0%
- Est. flood insurance / yr
- $507 – $1,088
Fire risk 3/10 · Minor
- Est. fire insurance / yr
- $949 – $1,763
Heat risk 6/10 · Moderate
- Hot days now (above 108°F)
- 7 days/yr
- Hot days in 30 yrs
- 20 days/yr
Wind risk 4/10 · Minor
- Chance of severe wind over 30 yrs
- 17.0%
Air-quality risk 1/10 · Minimal
- Unhealthy air days now
- 0 days/yr
- Unhealthy air days in 30 yrs
- 0 days/yr
Risk factors via First Street. Map © Google.
Why this score? — see what drove the B+ grade
The composite is a weighted blend of 9 inputs, each scored 0–100. Each bar is that input's sub-score; the figure is the points it added to the 100-point composite (weight × sub-score).
- Cash flow +30.0/30.0
- 1% rule +10.0/10.0
- DSCR +10.0/10.0
- Appreciation +10.0/10.0
- ARV discount +7.5/15.0
- Livability +3.6/5.0
- Rent growth +2.5/5.0
- Condition / age +2.5/5.0
- Schools +2.3/10.0
$29,900
🖨 Deal sheet 📄 Offer letter ✓ Due diligence
Listing remarks
Attention investors and DIY enthusiasts! Multiple exit strategies: finish this remodel then either flip, rent or move in! Home being sold as is. Cash preferred but will consider financed all offers. Seller is assisted by an Attorney in Fact. Do not knock on door or approach house without prior communication.
Key facts
- 0.34 acre lot
- Built 1930
- Listed 25 days
Property features AI
Finance
- Financial info: Tax annual amount reported
Exterior
- Parking: No covered spaces; No carport spaces; No parking spaces reported
- Utilities: Public water; Sewer: other; Water available
- Home design: Single-family residence; One story; Living area reported as 744 (assessor)
- Construction: Constructed with other materials; Slab foundation; Existing (year built not specified)
- Exterior features: Lot approximately 0.34 acres; Lot dimensions about 100 x 150; Lot size calculated from plat; Water available
Interior
- Kitchen: No appliances listed
- Bedrooms: 2 bedrooms (both on main level)
- Flooring: Other
- Bathrooms: 1 full bathroom
- Heating & cooling: Heating present (type: other); Cooling present (type: other)
- Interior features: No basement; Other flooring
- Laundry & utility: No laundry appliances listed
Neighborhood map
What this means for you Summary
Snapshot
- This is a 2-bed/1.0-bath single-family listed at $30k.
Deal economics
- At list price, monthly cash flow is $489 ($6k/yr) — positive.
- The deal already cash-flows at list — no discount required.
- Meets the 1% rule at list price ($856 rent vs $30k).
- Recommended offer: $29k (1.5% below list) — sets the bar for market timing.
Location & tenants
- Location reads 71/100 on livability (#47 in TN) — a middle-class / working-renter tenant base. Strengths: cost of living A+, housing A+, health & safety A+; Watch: amenities C-, crime F, commute F.
- Hardin County (rural): math 27% / reading 28% proficiency, ranked #76 of 139 in TN (top 55%) — low school quality limits family demand, transient renter base, plan for 1-2y turnover.
- Zoned schools: Parris South Elementary (math 22% / reading 27%, grade F, #546 of 952 statewide, top 61%, 362 students, 0% FRL); Hardin County High School (math 23% / reading 34%, grade F, #96 of 332 statewide, top 30%, 996 students, 0% FRL) — zoned schools average 0% FRL vs 59% district-wide (59 pts lower); this property's tenant base skews higher-income than the district average.
- Market conditions: 385 active listings in the ZIP; 24 units permitted in Hardin County in 2024 (0 in 5+ unit buildings).
Forward outlook
- In year one you build about $3k of equity ($207 loan paydown + $3k appreciation (10.0% local appreciation)).
- Hardin County population projected at -17% by 2050 — secular population decline; favor cash flow + early exit over multi-decade hold.
- At projected returns (10.0% appreciation + 3.0% rent growth), your $8k cash investment doubles in ~1 year — after that, you're playing with house money.
- By year 9, paydown + projected appreciation supports a ~$33k cash-out refi (75% LTV) — recoverable capital for the next deal without selling this one.
Negotiation context
- It's been on market 25 days — a 2% lower offer ($29k) is reasonable based on typical stale-listing flexibility.
Risks & watch-outs
- Watch-outs: built in 1930 — expect roof / HVAC / electrical / plumbing capex.
- Climate carrying-cost: extreme-heat days projected 7→20/yr by 2055 (HVAC capex compounding) — expect insurance premiums to compound above CPI over the hold.
Questions for the listing agent
- Built in 1930 — when were the roof, HVAC, electrical panel, plumbing, and water heater last replaced?
- Is there a deadline driving the sale (1031 exchange, divorce, estate, relocation)? That informs how much negotiation room exists.
- Schools are F-rated, which usually means shorter tenancies and higher turnover. Who's the typical renter profile here, and what's been the actual vacancy rate?
- Crime grade is F in this area — have there been break-ins, vandalism, or insurance claims at this property in the last 3 years? What carrier currently insures it and at what premium?
- What's the average days-on-market for RENTAL listings here right now (not sales)? A rising rental-DOM trend means longer vacancies and softer asking-rent achievability than the comps imply.
- What's the recent tenant-quality profile in this submarket — average credit score on applications, eviction rate, late-payment / NSF rate, and stable-employment percentage? A property-management company in the area should have these aggregated.
- How much new for-sale + rental construction is in the pipeline within 1–3 miles? Heavy new supply typically softens prices + rents 12–24 months out; constrained supply supports both.
Investment metrics
- 1% rule
- 2.86% ✓
- Cap rate
- 25.93%
- Cash-on-cash
- 70.13%
- DSCR
- 4.12
- GRM
- 2.9
CMA / ARV
No comps found within radius.
Projected returns pro-forma
10.0% appreciation · 3.0% rent growth · sell at horizon
- IRR
- 81.1%
- Equity multiple
- 6.67×
- Total profit
- $47,447
- Equity at exit
- $26,936
- IRR
- 75.4%
- Equity multiple
- 14.76×
- Total profit
- $115,219
- Equity at exit
- $58,089
Cash invested: $8,372 (down + closing). Projections, not guarantees.
Landlord ↔ Tenant lean methodology
- Overall (STATE)
- 87 Strongly Landlord-Friendly
- State Tennessee
- 87 Strongly Landlord-Friendly · R+13
- County
- — inherits STATE
- City
- — inherits STATE
ZIP-level market 38372
- Home prices YoY
- 5.5%
- Active inventory
- 385
- Price-to-rent
- 2.9×
Monthly cashflow live
- Estimated rent
- $856 medium interval (Pro) →
- Mortgage (P&I)
- −$157
- Tax from tax record
- −$18 /mo · $210/yr
- Insurance
- −$12
- HOA
- −$0
- Vacancy / Maint / Mgmt
- −$180
- Net cashflow
- $489
Break-even live
UW: 25.0% down · 7.5% · 30yr · 1.5% tax · 5.0% vac · 8.0% maint · 8.0% mgmt
Financing live
Cash to close
- Down payment
- $7,475
- Closing costs
- $897
- Reserves months
- —
- Total cash needed
- —
Loan-product check · same deal, 3 products live
Conventional
25% down · 7.5% · 30yr
- Down + closing
- —
- Monthly P&I
- —
- Monthly cashflow
- —
- DSCR
- —
- Eligible?
- —
Personal DTI + credit; lowest rate.
DSCR
20% down · 8.5% · 30yr
- Down + closing
- —
- Monthly P&I
- —
- Monthly cashflow
- —
- DSCR
- —
- Eligible?
- —
No personal income docs; deal must DSCR.
Hard money
10% down · 12.0% · 12mo
- Down + closing
- —
- Monthly P&I
- —
- Monthly cashflow
- —
- DSCR
- —
- Eligible?
- —
Short-term bridge; refi at stabilization.
Listing history 16 events
-
2026-06-17status $29,900 Pending 25 DOM
-
2026-06-16days on market $29,900 Active 25 DOM
-
2026-06-15days on market $29,900 Active 24 DOM
-
2026-06-13days on market $29,900 Active 22 DOM
-
2026-06-12days on market $29,900 Active 21 DOM
-
2026-06-09days on market $29,900 Active 18 DOM
-
2026-06-08days on market $29,900 Active 17 DOM
-
2026-06-08days on market $29,900 Active 16 DOM
-
2026-06-07days on market $29,900 Active 15 DOM
-
2026-06-03days on market $29,900 Active 12 DOM
-
2026-06-02days on market $29,900 Active 11 DOM
-
2026-06-01days on market $29,900 Active 10 DOM
-
2026-05-31days on market $29,900 Active 9 DOM
-
2026-05-22$39,900 Active
-
2002-02-08soldstatus $29,500
-
1999-09-30soldstatus $24,000
ⓘ Source: listings_history table (triggers on properties + properties_extension) + one-shot
backfill from property_details.listing_events for pre-trigger history.
Tax reassessment forecast TN · Resets to sale price
- Current annual tax
- $210 · $18/mo
- Projected year-2 tax
- $212 · $18/mo
- Expected delta
- +$2/yr ($0/mo · 1.1%)
ⓘ Screening estimate from a state-policy table — verify with the county assessor before closing.
Climate risk First Street
- Flood 1/10 Low FEMA zone X (unshaded) · 0% chance over 30 yrs
- Wildfire 3/10 Moderate
- Heat 6/10 Major 7 d/yr ≥108°F today · 20 d/yr by 30 yrs out
- Wind 4/10 Moderate 17% chance of damaging wind over 30 yrs
- Air quality 1/10 Low 0 unhealthy d/yr today · 0 by 30 yrs out
Nearby sold comps map
Loading sold comps map…
Walkable amenities ~0.75 mi
Loading nearby amenities…
Taxation est. · year 1
- Rental income
- $10,269
- − Mortgage interest
- −$1,675
- − Property taxes
- −$210
- − Insurance
- −$150
- − Repairs & maintenance
- −$822
- − Management
- −$822
- − Depreciation
- −$870
- Taxable income
- $5,722
- Est. tax owed @ 24.0%
- −$1,373
- After-tax cash flow
- $4,498/yr
For passive investors: Depreciation is non-cash, so a rental often shows a tax loss while cash-flowing — sheltering income. Rental losses are passive: they offset passive income freely, and up to $25,000/yr can offset ordinary (W-2) income if you actively participate and your MAGI is under $100k (phasing out to $0 by $150k); unused losses carry forward. On sale, claimed depreciation is recaptured at up to 25%, and gains may owe capital-gains tax (a 1031 exchange can defer both). Figures are a year-1 estimate at your 24.0% rate — not tax advice; consult a CPA.
Schools (NCES district)
- District
- Hardin County
- NCES district ID
- 4701680
- Math proficiency
- 27% ▼ -1.00%
- Reading proficiency
- 28% ▼ -1.00%
- Median HH income
- $34,404
- Composite
- 22.64/100
- National rank
- #8061
- State rank
- #76 of 139 in TN
Livability — Savannah
- Score
- 71/100
- State rank
- #47
- US rank
- #7090
Category grades
Schools grade is shown separately in the Schools card above.
Census & demographics
- Census place
- Savannah, TN
- Population (ZIP)
- 17,659
Population outlook (Hardin County) Hauer SSP2
- Today (2025)
- 24,740 people
- By 2030
- 23,971 · -3.1%
- By 2040
- 22,284 · -9.9%
- By 2050
- 20,612 · -16.7%
- By 2075
- 17,072 · -31.0%
- By 2100
- 13,723 · -44.5%
Race, ethnicity, and origin ACS 2023
- Neighborhood character
- Predominantly White (89%)
- Race & ethnicity
- White 89% Two or more races 5% Black 3% Hispanic / Latino 3%
- Common ancestry
- Italian 5% Slovak 2% Danish 2%
- Foreign-born
- 1% · Canada
- Languages at home
- 97% English-only · Spanish 2% German/W. Germanic 1%
Political lean MEDSL · Hardin
- 2024 margin
- Solid R (+71.0) · D 14.1% · R 85.1%
- 2008→2024 swing
- -28.3pp toward R · 2008: -42.7pp · 2024: -71.0pp
- All cycles
- 2024: R+71.0 2020: R+67.5 2016: R+64.2 2012: R+51.6 2008: R+42.7
Not yet ingested
- Civics
- —
Market trends
- HPI YoY
- ▲ 15.20%
- Current HPI
- 293.51
- Rent YoY
- —
- Metro
- —
- State GDP YoY
- ▲ 2.78%
- F500 in state
- 22
Industry mix (Fortune 500 HQ in TN)
| Industry | F500 HQs | Revenue |
|---|---|---|
| Healthcare | 3 | $91B |
|
||
| Retail | 3 | $72B |
|
||
| Transportation / Logistics | 1 | $88B |
|
||
| Paper / Packaging | 1 | $19B |
|
||
| Insurance | 1 | $13B |
|
||
| Energy | 1 | $12B |
|
||
Price history
+66.2% since first listed3 events — show timeline
- 2026-05-22 Listed $39,900 REALTRACS as Distributed by MLS Grid
- 2002-02-08 Sold (Public Records) $29,500 Public Records
- 1999-09-30 Sold (Public Records) $24,000 Public Records
Property tax history
+0.8%/yrLatest (2025): $210 · +0.0% YoY. Source: county tax records.
Cash-flow waterfall
monthlySold comps — $/sqft
last 12 mo · ≤1 miLoading sold comps…