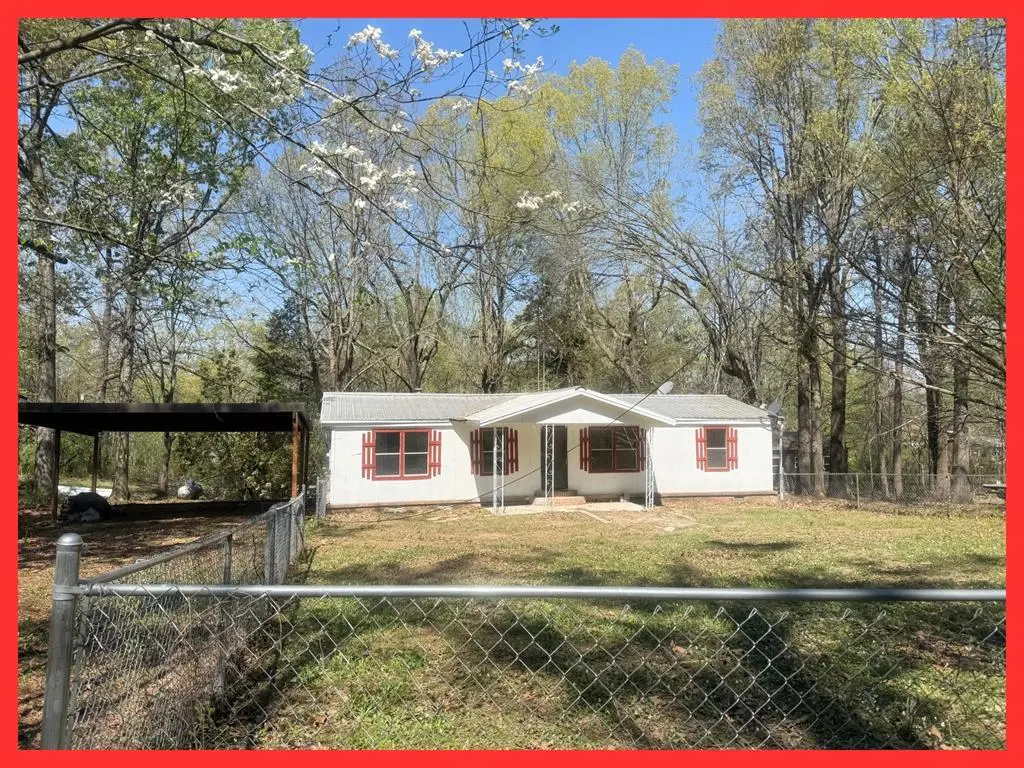
219 Robin Rd · Water Valley, MS
Flood risk 1/10 · Minimal
- FEMA flood zone
- X (unshaded)
- Chance of flooding over 30 yrs
- 0.0%
- Est. flood insurance / yr
- $507 – $1,088
Fire risk 4/10 · Minor
- Est. fire insurance / yr
- $1,241 – $2,305
Heat risk 6/10 · Moderate
- Hot days now (above 109°F)
- 7 days/yr
- Hot days in 30 yrs
- 21 days/yr
Wind risk 6/10 · Moderate
- Chance of severe wind over 30 yrs
- 27.0%
Air-quality risk 1/10 · Minimal
- Unhealthy air days now
- 0 days/yr
- Unhealthy air days in 30 yrs
- 0 days/yr
Risk factors via First Street. Map © Google.
Why this score? — see what drove the B- grade
The composite is a weighted blend of 9 inputs, each scored 0–100. Each bar is that input's sub-score; the figure is the points it added to the 100-point composite (weight × sub-score).
- Cash flow +30.0/30.0
- 1% rule +10.0/10.0
- DSCR +10.0/10.0
- ARV discount +7.5/15.0
- Livability +3.0/5.0
- Schools +2.7/10.0
- Rent growth +2.5/5.0
- Condition / age +2.5/5.0
- Appreciation +0.0/10.0
$79,900
🖨 Deal sheet 📄 Offer letter ✓ Due diligence
Listing remarks MLS
Completely renovated, this 3-bedroom, 2-bathroom home is just 2 miles from Enid Lake. It features a fireplace, a workshop, and a screened-in back porch, along with a fenced yard. Survey on file. Price is firm. Typically, 15% down with good credit. This will not go FHA/USDA
Key facts
- Fenced yard
- Workshop
- Fireplace
Tags
Neighborhood map
What this means for you Summary
Snapshot
- This is a 3-bed/2.0-bath manufactured listed at $80k.
Deal economics
- At list price, monthly cash flow is $824 ($10k/yr) — positive.
- The deal already cash-flows at list — no discount required.
- Meets the 1% rule at list price ($2k rent vs $80k).
- Recommended offer: $70k (12.0% below list) — sets the bar for market timing.
Location & tenants
- Location reads 60/100 on livability (#233 in MS) — a middle-class / working-renter tenant base. Strengths: cost of living A+, housing A+; Watch: health & safety D+, schools F, crime F.
- Water Valley School District (town): math 29% / reading 36% proficiency, ranked #61 of 130 in MS (top 47%) — families likely to look elsewhere, expect single-tenant / working-renter base with shorter leases; 64% free/reduced lunch — lower-income household profile, screen leases tightly.
- Market conditions: 71 active listings in the ZIP; 24 units permitted in Yalobusha County in 2024 (0 in 5+ unit buildings).
- This rent runs 34% of the median local income ($58k/yr) — at the standard rent-burdened threshold; future hikes will face affordability resistance.
Forward outlook
- Local home prices are declining (-3.0%/yr); year-one equity from $552 of loan paydown is wiped out by about $2k of value loss. Plan a longer hold.
- Yalobusha County population projected at -11% by 2050 — secular population decline; favor cash flow + early exit over multi-decade hold.
- At projected returns (-3.0% appreciation + 3.0% rent growth), your $22k cash investment doubles in ~3 years — after that, you're playing with house money.
Negotiation context
- It's been on market 150 days — a 12% lower offer ($70k) is reasonable based on typical stale-listing flexibility.
Risks & watch-outs
- Climate carrying-cost: major wind risk, 27% chance of damaging wind over 30y; extreme-heat days projected 7→21/yr by 2055 (HVAC capex compounding) — expect insurance premiums to compound above CPI over the hold.
Questions for the listing agent
- It's been on market 150 days. Have you received any prior offers? Is the seller open to a 12% concession, seller financing, or rate buy-down credit?
- Why hasn't it sold? Are there any deal-killer items the seller is aware of (foundation, flood, title, zoning, code violations)?
- Is there a deadline driving the sale (1031 exchange, divorce, estate, relocation)? That informs how much negotiation room exists.
- Schools are F-rated, which usually means shorter tenancies and higher turnover. Who's the typical renter profile here, and what's been the actual vacancy rate?
- Crime grade is F in this area — have there been break-ins, vandalism, or insurance claims at this property in the last 3 years? What carrier currently insures it and at what premium?
- What's the average days-on-market for RENTAL listings here right now (not sales)? A rising rental-DOM trend means longer vacancies and softer asking-rent achievability than the comps imply.
- What's the recent tenant-quality profile in this submarket — average credit score on applications, eviction rate, late-payment / NSF rate, and stable-employment percentage? A property-management company in the area should have these aggregated.
- How much new for-sale + rental construction is in the pipeline within 1–3 miles? Heavy new supply typically softens prices + rents 12–24 months out; constrained supply supports both.
Investment metrics
- 1% rule
- 2.06% ✓
- Cap rate
- 18.66%
- Cash-on-cash
- 44.18%
- DSCR
- 2.97
- GRM
- 4.0
CMA / ARV
No comps found within radius.
Projected returns pro-forma
-3.0% appreciation · 3.0% rent growth · sell at horizon
- IRR
- 41.1%
- Equity multiple
- 2.77×
- Total profit
- $39,496
- Equity at exit
- $11,913
- IRR
- 47.4%
- Equity multiple
- 5.55×
- Total profit
- $101,860
- Equity at exit
- $6,908
Cash invested: $22,372 (down + closing). Projections, not guarantees.
Landlord ↔ Tenant lean methodology
- Overall (STATE)
- 90 Strongly Landlord-Friendly
- State Mississippi
- 90 Strongly Landlord-Friendly · R+11
- County
- — inherits STATE
- City
- — inherits STATE
ZIP-level market 38965
- Home prices YoY
- -22.5%
- Active inventory
- 71
- Price-to-rent
- 4.0×
Monthly cashflow live
- Estimated rent
- $1,645 medium interval (Pro) →
- Mortgage (P&I)
- −$419
- Tax from tax record
- −$23 /mo · $282/yr
- Insurance
- −$33
- HOA
- −$0
- Vacancy / Maint / Mgmt
- −$345
- Net cashflow
- $824
Break-even live
UW: 25.0% down · 7.5% · 30yr · 1.5% tax · 5.0% vac · 8.0% maint · 8.0% mgmt
Financing live
Cash to close
- Down payment
- $19,975
- Closing costs
- $2,397
- Reserves months
- —
- Total cash needed
- —
Loan-product check · same deal, 3 products live
Conventional
25% down · 7.5% · 30yr
- Down + closing
- —
- Monthly P&I
- —
- Monthly cashflow
- —
- DSCR
- —
- Eligible?
- —
Personal DTI + credit; lowest rate.
DSCR
20% down · 8.5% · 30yr
- Down + closing
- —
- Monthly P&I
- —
- Monthly cashflow
- —
- DSCR
- —
- Eligible?
- —
No personal income docs; deal must DSCR.
Hard money
10% down · 12.0% · 12mo
- Down + closing
- —
- Monthly P&I
- —
- Monthly cashflow
- —
- DSCR
- —
- Eligible?
- —
Short-term bridge; refi at stabilization.
Listing history 22 events
-
2026-06-19days on market $79,900 Active 150 DOM
-
2026-06-18days on market $79,900 Active 149 DOM
-
2026-06-17days on market $79,900 Active 148 DOM
-
2026-06-16days on market $79,900 Active 147 DOM
-
2026-06-15days on market $79,900 Active 146 DOM
-
2026-06-14days on market $79,900 Active 144 DOM
-
2026-06-12days on market $79,900 Active 143 DOM
-
2026-06-09days on market $79,900 Active 140 DOM
-
2026-06-08days on market $79,900 Active 139 DOM
-
2026-06-07days on market $79,900 Active 138 DOM
-
2026-06-05days on market $79,900 Active 135 DOM
-
2026-06-03days on market $79,900 Active 134 DOM
-
2026-06-02days on market $79,900 Active 133 DOM
-
2026-06-01days on market $79,900 Active 132 DOM
-
2026-05-31days on market $79,900 Active 131 DOM
-
2026-05-30days on market $79,900 Active 130 DOM
-
2026-04-20price $79,900 273-char remark
Show marketing remark (273 chars)
Completely renovated, this 3-bedroom, 2-bathroom home is just 2 miles from Enid Lake. It features a fireplace, a workshop, and a screened-in back porch, along with a fenced yard. Survey on file. Price is firm. Typically, 15% down with good credit. This will not go FHA/USDA
-
2026-04-08price $85,500 273-char remark
Show marketing remark (273 chars)
Completely renovated, this 3-bedroom, 2-bathroom home is just 2 miles from Enid Lake. It features a fireplace, a workshop, and a screened-in back porch, along with a fenced yard. Survey on file. Price is firm. Typically, 15% down with good credit. This will not go FHA/USDA
-
2026-04-08price $85,000 273-char remark
Show marketing remark (273 chars)
Completely renovated, this 3-bedroom, 2-bathroom home is just 2 miles from Enid Lake. It features a fireplace, a workshop, and a screened-in back porch, along with a fenced yard. Survey on file. Price is firm. Typically, 15% down with good credit. This will not go FHA/USDA
-
2026-04-02price $94,500 273-char remark
Show marketing remark (273 chars)
Completely renovated, this 3-bedroom, 2-bathroom home is just 2 miles from Enid Lake. It features a fireplace, a workshop, and a screened-in back porch, along with a fenced yard. Survey on file. Price is firm. Typically, 15% down with good credit. This will not go FHA/USDA
-
2026-01-20$99,000 Active 273-char remark
Show marketing remark (273 chars)
Completely renovated, this 3-bedroom, 2-bathroom home is just 2 miles from Enid Lake. It features a fireplace, a workshop, and a screened-in back porch, along with a fenced yard. Survey on file. Price is firm. Typically, 15% down with good credit. This will not go FHA/USDA
-
1984-03-08soldstatus
ⓘ Source: listings_history table (triggers on properties + properties_extension) + one-shot
backfill from property_details.listing_events for pre-trigger history.
Tax reassessment forecast MS · Resets to sale price
- Current annual tax
- $282 · $23/mo
- Projected year-2 tax
- $631 · $53/mo
- Expected delta
- +$350/yr (+$29/mo · 124.2%)
ⓘ Screening estimate from a state-policy table — verify with the county assessor before closing.
Climate risk First Street
- Flood 1/10 Low FEMA zone X (unshaded) · 0% chance over 30 yrs
- Wildfire 4/10 Moderate
- Heat 6/10 Major 7 d/yr ≥109°F today · 21 d/yr by 30 yrs out
- Wind 6/10 Major 27% chance of damaging wind over 30 yrs
- Air quality 1/10 Low 0 unhealthy d/yr today · 0 by 30 yrs out
Nearby sold comps map
Loading sold comps map…
Walkable amenities ~0.75 mi
Loading nearby amenities…
Taxation est. · year 1
- Rental income
- $19,739
- − Mortgage interest
- −$4,476
- − Property taxes
- −$282
- − Insurance
- −$400
- − Repairs & maintenance
- −$1,579
- − Management
- −$1,579
- − Depreciation
- −$2,324
- Taxable income
- $9,100
- Est. tax owed @ 24.0%
- −$2,184
- After-tax cash flow
- $7,701/yr
For passive investors: Depreciation is non-cash, so a rental often shows a tax loss while cash-flowing — sheltering income. Rental losses are passive: they offset passive income freely, and up to $25,000/yr can offset ordinary (W-2) income if you actively participate and your MAGI is under $100k (phasing out to $0 by $150k); unused losses carry forward. On sale, claimed depreciation is recaptured at up to 25%, and gains may owe capital-gains tax (a 1031 exchange can defer both). Figures are a year-1 estimate at your 24.0% rate — not tax advice; consult a CPA.
Schools (NCES district)
- District
- Water Valley School District
- NCES district ID
- 2804500
- Math proficiency
- 29% ▼ -3.00%
- Reading proficiency
- 36% ▼ -3.00%
- Median HH income
- $36,107
- Composite
- 26.92/100
- National rank
- #7083
- State rank
- #61 of 130 in MS
Livability — Water Valley
- Score
- 60/100
- State rank
- #233
- US rank
- #19538
Category grades
Schools grade is shown separately in the Schools card above.
Census & demographics
- County
- Yalobusha County · 8,963 people
- City population
- 8,963
- Metro
- Oxford, MS
- Population (ZIP)
- 8,963
- Household income
- $58,258
- Rent vs Own
- Severe rent burden
- 113.0
Population outlook (Yalobusha County) Hauer SSP2
- Today (2025)
- 12,062 people
- By 2030
- 11,811 · -2.1%
- By 2040
- 11,297 · -6.3%
- By 2050
- 10,771 · -10.7%
- By 2075
- 9,679 · -19.8%
- By 2100
- 8,400 · -30.4%
Race, ethnicity, and origin ACS 2023
- Neighborhood character
- Majority White (65%)
- Race & ethnicity
- White 65% Black 30% Two or more races 3%
- Common ancestry
- Slovak 1% Serbian 1% Iranian 1%
- Foreign-born
- 0% · Canada
- Languages at home
- 98% English-only · German/W. Germanic 1% Spanish 1%
Political lean MEDSL · Yalobusha
- 2024 margin
- Strong R (+20.9) · D 38.9% · R 59.9% · Other 1.2%
- 2008→2024 swing
- -13.9pp toward R · 2008: -7.0pp · 2024: -20.9pp
- All cycles
- 2024: R+20.9 2020: R+13.6 2016: R+13.1 2012: R+4.4 2008: R+7.0
Not yet ingested
- Civics
- —
Market trends
- HPI YoY
- ▼ -48.65%
- Current HPI
- 167.4446
- Rent YoY
- —
- Metro
- Oxford, MS
- State GDP YoY
- —
- F500 in state
- 0
Price history
-19.3% since first listed6 events — show timeline
- 2026-04-20 Price Changed $79,900 NCMBR
- 2026-04-08 Price Changed $85,500 NCMBR
- 2026-04-08 Price Changed $85,000 NCMBR
- 2026-04-02 Price Changed $94,500 NCMBR
- 2026-01-20 Listed $99,000 NCMBR
- 1984-03-08 Sold (Public Records) — Public Records
Property tax history
+3.7%/yrLatest (2025): $282 · +18.0% YoY. Source: county tax records.
Cash-flow waterfall
monthlySold comps — $/sqft
last 12 mo · ≤1 miLoading sold comps…