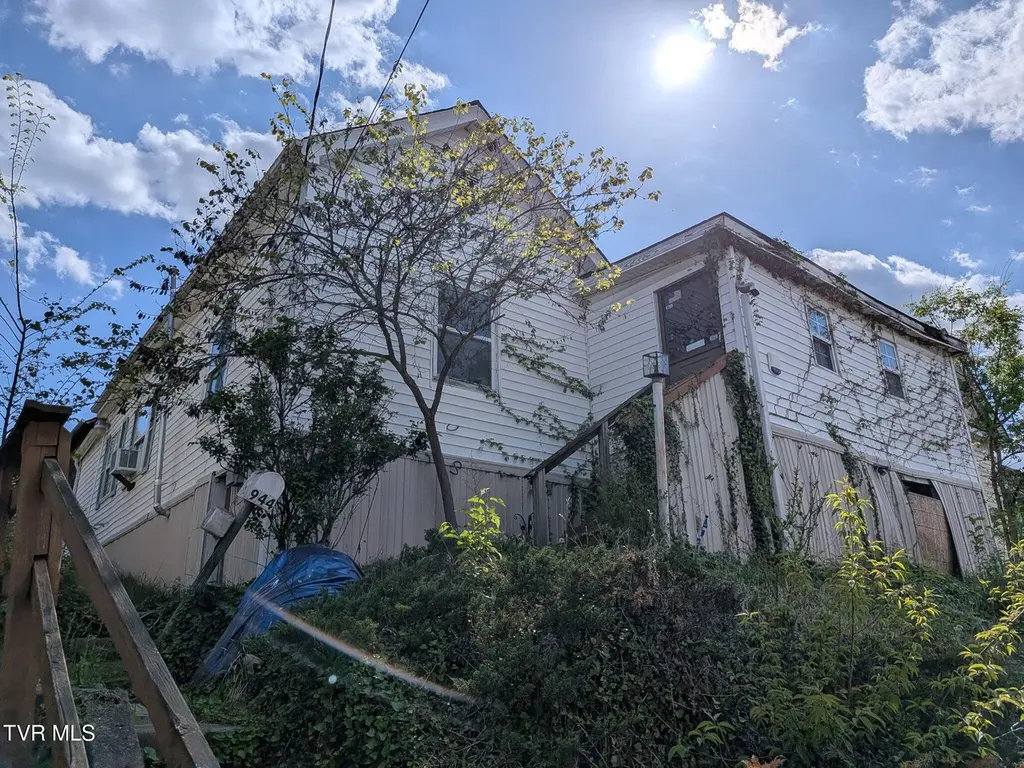
944 Hill St · Bristol, TN
Flood risk 1/10 · Minimal
- FEMA flood zone
- X (unshaded)
- Chance of flooding over 30 yrs
- 0.0%
- Est. flood insurance / yr
- $507 – $1,088
Fire risk 4/10 · Minor
- Est. fire insurance / yr
- $949 – $1,763
Heat risk 4/10 · Minor
- Hot days now (above 98°F)
- 7 days/yr
- Hot days in 30 yrs
- 22 days/yr
Wind risk 2/10 · Minimal
- Chance of severe wind over 30 yrs
- —
Air-quality risk 2/10 · Minimal
- Unhealthy air days now
- 1 days/yr
- Unhealthy air days in 30 yrs
- 2 days/yr
Risk factors via First Street. Map © Google.
Why this score? — see what drove the B- grade
The composite is a weighted blend of 9 inputs, each scored 0–100. Each bar is that input's sub-score; the figure is the points it added to the 100-point composite (weight × sub-score).
- Cash flow +30.0/30.0
- 1% rule +10.0/10.0
- DSCR +10.0/10.0
- ARV discount +7.5/15.0
- Livability +3.7/5.0
- Schools +3.0/10.0
- Rent growth +2.5/5.0
- Condition / age +2.5/5.0
- Appreciation +0.0/10.0
$40,000
🖨 Deal sheet (PDF) 📄 Offer letter ✓ Due diligence
Listing remarks
Great investment opportunity! Can be lived in as is, or be used to customize as you see fit.
Key facts
- 6,534 sq ft lot
- Built 1910
- Listed 9 days
Neighborhood map
What this means for you Summary
Snapshot
- This is a 2-bed/1.0-bath single-family listed at $40k.
Deal economics
- At list price, monthly cash flow is $974 ($12k/yr) — positive.
- The deal already cash-flows at list — no discount required.
- Meets the 1% rule at list price ($2k rent vs $40k).
- Cap rate 35.5% vs local median 3.8% in Bristol — top-decile yield for the area; either an underpriced asset or a hidden risk that comps aren't pricing in. Stress-test before assuming the spread holds.
Location & tenants
- Location reads 73/100 on livability (#24 in TN) — a middle-class / working-renter tenant base. Strengths: cost of living A+, housing A+, health & safety A+; Watch: crime D+, commute F, employment F.
- Bristol (urban): math 37% / reading 35% proficiency, ranked #29 of 139 in TN (top 21%) — families likely to look elsewhere, expect single-tenant / working-renter base with shorter leases.
- Zoned schools: Anderson Elementary (math 22% / reading 27%, grade F, #546 of 952 statewide, top 61%, 308 students, 0% FRL); Bristol Tennessee Middle School (math 37% / reading 29%, grade F, #77 of 333 statewide, top 24%, 883 students, 0% FRL); Tennessee High School (math 20% / reading 41%, grade F, #75 of 332 statewide, top 24%, 1,154 students, 0% FRL) — zoned schools average 0% FRL vs 46% district-wide (46 pts lower); this property's tenant base skews higher-income than the district average.
- Market conditions: 254 active listings in the ZIP; 14 comparable units currently listed for rent nearby; rentals at typical pace (median 22d on market — plan ~3-4 weeks tenant-placement turnaround); 453 units permitted in Sullivan County in 2024 (6 in 5+ unit buildings).
- This rent runs 35% of the median local income ($56k/yr) — at the standard rent-burdened threshold; future hikes will face affordability resistance.
Forward outlook
- Local home prices are declining (-3.0%/yr); year-one equity from $277 of loan paydown is wiped out by about $1k of value loss. Plan a longer hold.
- Sullivan County population projected to shrink 5% by 2050 — rents likely to lag national; underwrite the cash flow, not the appreciation.
- At projected returns (-3.0% appreciation + 3.0% rent growth), your $11k cash investment doubles in ~2 years — after that, you're playing with house money.
Negotiation context
- Only 9 days on market — expect competitive offers; lowballing is unlikely to land.
- Current owner paid $16k; list at $40k implies a 147% gain — meaningful room to come down on a strong offer.
Risks & watch-outs
- Watch-outs: built in 1910 — expect roof / HVAC / electrical / plumbing capex.
Questions for the listing agent
- Built in 1910 — when were the roof, HVAC, electrical panel, plumbing, and water heater last replaced?
- Is there a deadline driving the sale (1031 exchange, divorce, estate, relocation)? That informs how much negotiation room exists.
- Schools are D-rated, which usually means shorter tenancies and higher turnover. Who's the typical renter profile here, and what's been the actual vacancy rate?
- Crime grade is D in this area — have there been break-ins, vandalism, or insurance claims at this property in the last 3 years? What carrier currently insures it and at what premium?
- What's the average days-on-market for RENTAL listings here right now (not sales)? A rising rental-DOM trend means longer vacancies and softer asking-rent achievability than the comps imply.
- What's the recent tenant-quality profile in this submarket — average credit score on applications, eviction rate, late-payment / NSF rate, and stable-employment percentage? A property-management company in the area should have these aggregated.
- How much new for-sale + rental construction is in the pipeline within 1–3 miles? Heavy new supply typically softens prices + rents 12–24 months out; constrained supply supports both.
Investment metrics
- 1% rule
- 4.04% ✓
- Cap rate
- 35.51%
- Cash-on-cash
- 104.36%
- DSCR
- 5.64
- GRM
- 2.1
CMA / ARV
- ARV (on-the-fly)
- $212,058
- Comps found
- 12
Show comp detail 12 sales within ~0.75 mi
| Address | Dist | Beds/Ba | Sqft | Sold | Price | $/sf | Match |
|---|---|---|---|---|---|---|---|
| 909 Wilson Ave | 0.09mi | 2/1.0 | 1,328 (-4%) | 7mo | $90,000 | $68 | 83 |
| 1412 Anderson St | 0.49mi | 2/2.0 | 1,382 (-0%) | 2mo | $235,000 | $170 | 70 |
| 813 Haynes St | 0.25mi | 3/1.0 (+1) | 1,215 (-12%) | 4mo | $151,500 | $125 | 60 |
| 943 Shelby St | 0.30mi | 3/1.0 (+1) | 1,201 (-13%) | 5mo | $115,000 | $96 | 55 |
| 1107 Holston Ave | 0.49mi | 2/2.0 | 1,525 (+10%) | 2mo | $285,000 | $187 | 55 |
| 1112 Cedar St | 0.64mi | 3/1.0 (+1) | 1,440 (+4%) | 9mo | $140,000 | $97 | 52 |
| 1836 Anderson St | 0.69mi | 3/2.0 (+1) | 1,425 (+3%) | 4mo | $235,000 | $165 | 50 |
| 855 Marion Ave | 0.64mi | 3/2.0 (+1) | 1,513 (+9%) | 2mo | $280,000 | $185 | 44 |
| 1324 Holly Ct | 0.74mi | 2/2.0 | 1,472 (+6%) | 9mo | $225,000 | $153 | 44 |
| 1405 Newton St | 0.62mi | 3/1.0 (+1) | 1,200 (-13%) | 4mo | $160,000 | $133 | 41 |
| 1106 Cedar St | 0.64mi | 3/1.0 (+1) | 1,224 (-12%) | 7mo | $199,900 | $163 | 40 |
| 420 Douglas St | 0.72mi | 3/1.0 (+1) | 1,588 (+15%) | 8mo | $227,000 | $143 | 31 |
Match score weights: distance 35% · size 25% · config 20% · recency 20%. Top-matched comps best support the ARV.
Projected returns pro-forma
-3.0% appreciation · 3.0% rent growth · sell at horizon
- IRR
- —
- Equity multiple
- 5.96×
- Total profit
- $55,596
- Equity at exit
- $5,964
- IRR
- —
- Equity multiple
- 12.47×
- Total profit
- $128,460
- Equity at exit
- $3,458
Cash invested: $11,200 (down + closing). Projections, not guarantees.
Landlord ↔ Tenant lean methodology
- Overall (STATE)
- 87 Strongly Landlord-Friendly
- State Tennessee
- 87 Strongly Landlord-Friendly · R+13
- County
- — inherits STATE
- City
- — inherits STATE
ZIP-level market 37620
- Active inventory
- 254
- Price-to-rent
- 2.1×
Monthly cashflow live
- Estimated rent
- $1,617 high interval (Pro) →
- Mortgage (P&I)
- −$210
- Tax from tax record
- −$77 /mo · $925/yr
- Insurance
- −$17
- HOA
- −$0
- Vacancy / Maint / Mgmt
- −$340
- Net cashflow
- $974
Break-even live
Sensitivity live
| Price | -10% $997 | -5% $985 | +0% $974 | +5% $963 | +10% $951 |
|---|---|---|---|---|---|
| Rent | -10% $846 | -5% $910 | +0% $974 | +5% $1,038 | +10% $1,102 |
| Rate | -1.0pp $994 | -0.5pp $984 | base $974 | +0.5pp $964 | +1.0pp $953 |
UW: 25.0% down · 7.5% · 30yr · 1.5% tax · 5.0% vac · 8.0% maint · 8.0% mgmt
Financing live
Cash to close
- Down payment
- $10,000
- Closing costs
- $1,200
- Reserves months
- —
- Total cash needed
- —
Loan-product check · same deal, 3 products live
Conventional
25% down · 7.5% · 30yr
- Down + closing
- —
- Monthly P&I
- —
- Monthly cashflow
- —
- DSCR
- —
- Eligible?
- —
Personal DTI + credit; lowest rate.
DSCR
20% down · 8.5% · 30yr
- Down + closing
- —
- Monthly P&I
- —
- Monthly cashflow
- —
- DSCR
- —
- Eligible?
- —
No personal income docs; deal must DSCR.
Hard money
10% down · 12.0% · 12mo
- Down + closing
- —
- Monthly P&I
- —
- Monthly cashflow
- —
- DSCR
- —
- Eligible?
- —
Short-term bridge; refi at stabilization.
Rent comps 14 comps
| Address | Beds | Baths | Sqft | Rent | $/sqft | DOM | Units | Dist |
|---|---|---|---|---|---|---|---|---|
| 1216 Norway St Unit 102 Bristol, VA | 2.0 | 1.0 | 1215 | $1,600 | $1.32 | 14d | 1 | 0.56mi |
| 1718 Clifton Rd Bristol, TN | 3.0 | 1.5 | 1672 | $1,900 | $1.14 | 45d | 1 | 0.58mi |
| 1405 Newton St Bristol, VA | 3.0 | 1.0 | 1200 | $1,600 | $1.33 | 14d | 1 | 0.61mi |
| 700 W Cedar St Bristol, TN | 2.0 | 1.0 | 921 | $1,600 | $1.74 | 22d | 1 | 0.73mi |
| 2114 Broad St Bristol, TN | 2.0 | 1.0 | 1000 | $1,600 | $1.60 | 14d | 1 | 0.86mi |
| 1136 Moorland Ave Bristol, VA | 2.0 | 1.0 | 936 | $1,250 | $1.34 | 45d | 1 | 0.99mi |
| 924 Maryland Ave Unit F Bristol, TN | 2.0 | 2.0 | 1780 | $2,000 | $1.12 | 14d | 1 | 1.28mi |
| 145 Midway St Unit 1397968P Bristol, VA | 3.0 | 2.0 | 1388 | $5,335 | $3.84 | 22d | 1 | 1.33mi |
| 1308 Columbia Rd Bristol, TN | 3.0 | 1.0 | 1198 | $1,375 | $1.15 | 22d | 1 | 1.35mi |
| 60 Maple Tree Dr Bristol, TN | 2.0 | 1.0 | 944 | $1,350 | $1.43 | 22d | 1 | 1.36mi |
| 2510 Catherine St Bristol, VA | 3.0 | 2.0 | 1418 | $2,500 | $1.76 | 14d | 1 | 1.43mi |
| 279 Reservoir St Bristol, VA | 3.0 | 1.5 | 1300 | $1,600 | $1.23 | 14d | 1 | 1.45mi |
| 203 Opal Ln Unit 4 Bristol, VA | 2.0 | 1.5 | 1200 | $1,500 | $1.25 | 22d | 1 | 1.46mi |
| 308 Emerald Dr Unit 308 Bristol, VA | 2.0 | 1.5 | 970 | $1,200 | $1.24 | 45d | 1 | 1.47mi |
Listing history 3 events
-
2026-04-25status Pending
-
2026-04-14$40,000 Active
-
1988-09-13soldstatus $16,200
ⓘ Source: listings_history table (triggers on properties + properties_extension) + one-shot
backfill from property_details.listing_events for pre-trigger history.
Tax reassessment forecast TN · Resets to sale price
- Current annual tax
- $925 · $77/mo
- Projected year-2 tax
- $925 · $77/mo
- Expected delta
- $0/yr ($0/mo · 0.0%)
ⓘ Screening estimate from a state-policy table — verify with the county assessor before closing.
Climate risk First Street
- Flood 1/10 Low FEMA zone X (unshaded) · 0% chance over 30 yrs
- Wildfire 4/10 Moderate
- Heat 4/10 Moderate 7 d/yr ≥98°F today · 22 d/yr by 30 yrs out
- Wind 2/10 Low
- Air quality 2/10 Low 1 unhealthy d/yr today · 2 by 30 yrs out
Nearby sold comps map
Loading sold comps map…
Walkable amenities ~0.75 mi
Loading nearby amenities…
Taxation est. · year 1
- Rental income
- $19,406
- − Mortgage interest
- −$2,241
- − Property taxes
- −$925
- − Insurance
- −$200
- − Repairs & maintenance
- −$1,552
- − Management
- −$1,552
- − Depreciation
- −$1,164
- Taxable income
- $11,772
- Est. tax owed @ 24.0%
- −$2,825
- After-tax cash flow
- $8,863/yr
For passive investors: Depreciation is non-cash, so a rental often shows a tax loss while cash-flowing — sheltering income. Rental losses are passive: they offset passive income freely, and up to $25,000/yr can offset ordinary (W-2) income if you actively participate and your MAGI is under $100k (phasing out to $0 by $150k); unused losses carry forward. On sale, claimed depreciation is recaptured at up to 25%, and gains may owe capital-gains tax (a 1031 exchange can defer both). Figures are a year-1 estimate at your 24.0% rate — not tax advice; consult a CPA.
Schools (NCES district)
- District
- Bristol
- NCES district ID
- 4700360
- Math proficiency
- 37% ▼ -7.00%
- Reading proficiency
- 35% ▼ -8.00%
- Median HH income
- $37,018
- Composite
- 29.95/100
- National rank
- #6376
- State rank
- #29 of 139 in TN
Livability — Bristol
- Score
- 73/100
- State rank
- #24
- US rank
- #5413
Category grades
Schools grade is shown separately in the Schools card above.
Census & demographics
- Census place
- Bristol, TN
- County
- Sullivan County · 121,987 people
- City population
- 38,494
- Metro
- Kingsport-Bristol, TN-VA
- Population (ZIP)
- 38,494
- Household income
- $56,128
- Rent vs Own
- Severe rent burden
- 724.0
Population outlook (Sullivan County) Hauer SSP2
- Today (2025)
- 157,030 people
- By 2030
- 156,415 · -0.4%
- By 2040
- 153,778 · -2.1%
- By 2050
- 149,018 · -5.1%
- By 2075
- 138,068 · -12.1%
- By 2100
- 119,927 · -23.6%
Race, ethnicity, and origin ACS 2023
- Neighborhood character
- Predominantly White (91%)
- Race & ethnicity
- White 91% Two or more races 5% Hispanic / Latino 3% Black 2%
- Common ancestry
- Serbian 3% Slovak 3% Italian 1%
- Foreign-born
- 2% · Canada
- Languages at home
- 97% English-only · Spanish 2%
Political lean MEDSL · Sullivan
- 2024 margin
- Solid R (+55.0) · D 22.0% · R 77.0% · Other 1.0%
- 2008→2024 swing
- -13.6pp toward R · 2008: -41.3pp · 2024: -55.0pp
- All cycles
- 2024: R+55.0 2020: R+51.9 2016: R+56.2 2012: R+47.2 2008: R+41.3
Not yet ingested
- Civics
- —
Market trends
- HPI YoY
- ▼ -294.12%
- Current HPI
- 263.38
- Rent YoY
- —
- Metro
- Kingsport-Bristol, TN-VA
- State GDP YoY
- ▲ 2.78%
- F500 in state
- 22
Industry mix (Fortune 500 HQ in TN)
| Industry | F500 HQs | Revenue |
|---|---|---|
| Healthcare | 3 | $91B |
|
||
| Retail | 3 | $72B |
|
||
| Transportation / Logistics | 1 | $88B |
|
||
| Paper / Packaging | 1 | $19B |
|
||
| Insurance | 1 | $13B |
|
||
| Energy | 1 | $12B |
|
||
Price history
+146.9% since first listed3 events — show timeline
- 2026-04-25 Pending — TVRMLS
- 2026-04-14 Listed $40,000 TVRMLS
- 1988-09-13 Sold (Public Records) $16,200 Public Records
Property tax history
+4.4%/yrLatest (2025): $925 · +33.3% YoY. Source: county tax records.
Cash-flow waterfall
monthlySold comps — $/sqft
last 12 mo · ≤1 miLoading sold comps…