 Duplex
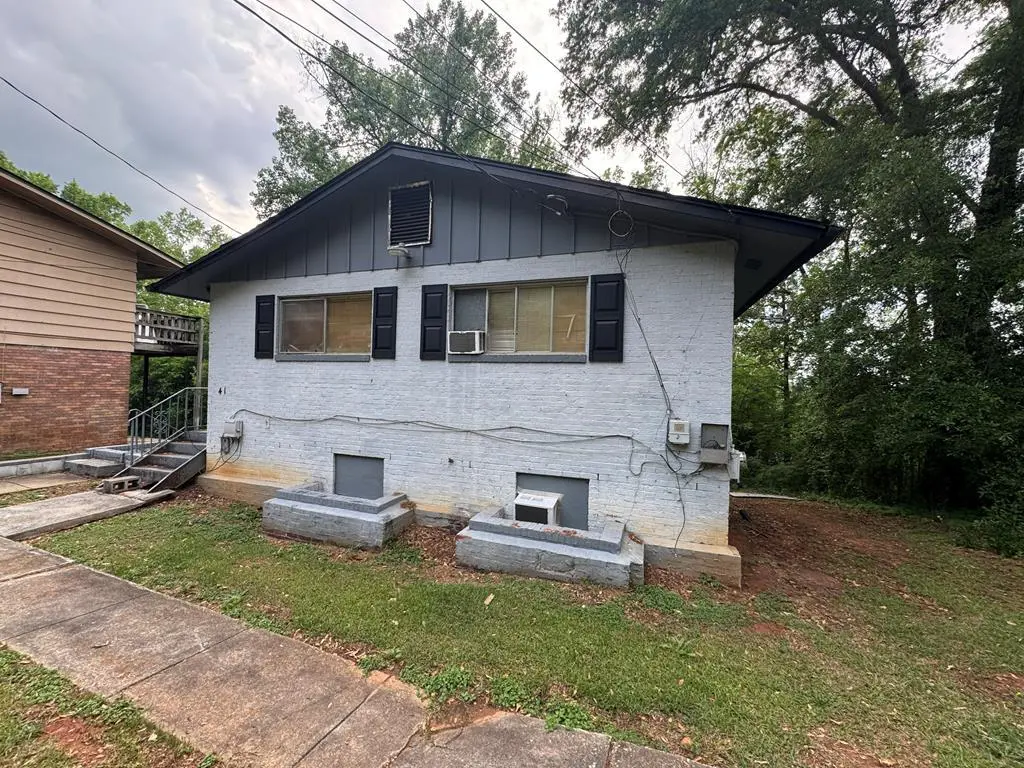
41 Ticknor Dr · Columbus, GA
Flood risk 1/10 · Minimal
- FEMA flood zone
- X (unshaded)
- Chance of flooding over 30 yrs
- 0.0%
- Est. flood insurance / yr
- $507 – $1,088
Fire risk 3/10 · Minor
- Est. fire insurance / yr
- $963 – $1,789
Heat risk 7/10 · Major
- Hot days now (above 107°F)
- 7 days/yr
- Hot days in 30 yrs
- 19 days/yr
Wind risk 6/10 · Moderate
- Chance of severe wind over 30 yrs
- 76.0%
Air-quality risk 4/10 · Minor
- Unhealthy air days now
- 4 days/yr
- Unhealthy air days in 30 yrs
- 5 days/yr
Risk factors via First Street. Map © Google.
Why this score? — see what drove the B- grade
The composite is a weighted blend of 9 inputs, each scored 0–100. Each bar is that input's sub-score; the figure is the points it added to the 100-point composite (weight × sub-score).
- Cash flow +30.0/30.0
- 1% rule +10.0/10.0
- DSCR +10.0/10.0
- ARV discount +7.5/15.0
- Livability +3.2/5.0
- Rent growth +3.0/5.0
- Condition / age +2.5/5.0
- Schools +2.2/10.0
- Appreciation +0.0/10.0
$71,250
🖨 Deal sheet (PDF) 📄 Offer letter ✓ Due diligence
Multi-family units
County records classify this as Multi-Family (2-4 Unit). Listing-text estimate: 2 units. confirmed
Listing remarks
Excellent investment opportunity near Columbus State University and some of the most popular Midtown areas! This duplex features two separate 2 bedroom, 1 bathroom units with a top-floor and bottom-floor layout. One unit is currently tenant occupied, providing immediate rental income, while the other unit is vacant and ready for renovations and updates. Whether you're looking to expand your rental portfolio, house hack, or create additional value through improvements, this property offers strong potential in a highly convenient location near shopping, dining, entertainment, and campus life. Great opportunity to invest in an area with continued demand and growth potential!
Key facts
- 9,148 sq ft lot
- Listed 30 days
Property features AI
Exterior
- Home design: Residential income property; Duplex
- Exterior features: Lot measures approximately 0.21 acres
Interior
- Interior features: Located in the Torch Hill Heights subdivision; Directions: left on Flint then right on Ticknor; duplex on right
Neighborhood map
What this means for you Summary
Snapshot
- This is a 2 × 2-bed/1-bath units multifamily listed at $71k.
Deal economics
- At list price, monthly cash flow is $731 ($9k/yr) — positive. Per door: $365/mo.
- The deal already cash-flows at list — no discount required.
- Meets the 1% rule at list price ($2k rent vs $71k).
- Recommended offer: $70k (1.5% below list) — sets the bar for market timing.
- Cap rate 18.6% vs local median 4.7% in Columbus — top-decile yield for the area; either an underpriced asset or a hidden risk that comps aren't pricing in. Stress-test before assuming the spread holds.
Location & tenants
- Location reads 64/100 on livability (#254 in GA) — a middle-class / working-renter tenant base. Strengths: cost of living A+, housing A+, health & safety B; Watch: amenities D+, crime F, commute F.
- Muscogee County (urban): math 21% / reading 30% proficiency, ranked #120 of 174 in GA (top 69%) — low school quality limits family demand, transient renter base, plan for 1-2y turnover; 61% free/reduced lunch — lower-income household profile, screen leases tightly.
- Zoned schools: South Columbus Elementary School (math 2% / reading 12%, grade F, #1,144 of 1,228 statewide, top 94%, 359 students, 97% FRL); Eddy Middle School (math 4% / reading 11%, grade F, #447 of 470 statewide, top 95%, 413 students, 97% FRL); Spencer High School (math 2% / reading 8%, grade F, #394 of 424 statewide, top 97%, 943 students, 97% FRL) — zoned schools average 97% FRL vs 61% district-wide (36 pts higher); higher-poverty schools than district average — tighter screening recommended.
- Zoned-school proficiency averages 7% at this address vs 26% district-wide (-19 pts) — the specific schools serving this property underperform the Muscogee County average; the district grade overstates school quality for this exact location.
- Market conditions: Rents rising (+1.8%/yr); 105 active listings in the ZIP; 12 comparable units currently listed for rent nearby; rentals at typical pace (median 16d on market — plan ~3-4 weeks tenant-placement turnaround); lower-income renter base — watch delinquency; 291 units permitted in Muscogee County in 2024 (30 in 5+ unit buildings).
Forward outlook
- Local home prices are declining (-3.0%/yr); year-one equity from $492 of loan paydown is wiped out by about $2k of value loss. Plan a longer hold.
- Muscogee County population projected at +15% by 2050 — modest demand growth; plan on rents tracking national, not racing it.
- At projected returns (-3.0% appreciation + 1.8% rent growth), your $20k cash investment doubles in ~3 years — after that, you're playing with house money.
Negotiation context
- It's been on market 30 days — a 2% lower offer ($70k) is reasonable based on typical stale-listing flexibility.
- 6 sale attempts since 5y ago; this cycle's ask has dropped $4k (5%) from the opening price — seller is motivated, your offer sets the floor, not the list.
- Current owner paid $60k; 19% above their basis — modest negotiation headroom, anchor on the comps not their cost.
Risks & watch-outs
- Climate carrying-cost: major wind risk, 76% chance of damaging wind over 30y; extreme-heat days projected 7→19/yr by 2055 (HVAC capex compounding) — expect insurance premiums to compound above CPI over the hold.
Questions for the listing agent
- Can we see the unit-by-unit rent roll, current vacancy, and any below-market leases? What's the average tenancy length?
- What capital expenditures (roof, boiler, parking lot, exteriors) have been made in the last 5 years, and what's planned in the next 2?
- Built in 1961 — when were the roof, HVAC, electrical panel, plumbing, and water heater last replaced?
- Is there a deadline driving the sale (1031 exchange, divorce, estate, relocation)? That informs how much negotiation room exists.
- Schools are F-rated, which usually means shorter tenancies and higher turnover. Who's the typical renter profile here, and what's been the actual vacancy rate?
- Crime grade is F in this area — have there been break-ins, vandalism, or insurance claims at this property in the last 3 years? What carrier currently insures it and at what premium?
- What's the average days-on-market for RENTAL listings here right now (not sales)? A rising rental-DOM trend means longer vacancies and softer asking-rent achievability than the comps imply.
- What's the recent tenant-quality profile in this submarket — average credit score on applications, eviction rate, late-payment / NSF rate, and stable-employment percentage? A property-management company in the area should have these aggregated.
- How much new apartment / multifamily construction is in the pipeline within 1–3 miles? Heavy new supply (>2% of stock underway) typically softens rents 12–24 months out; light construction supports rent growth.
Investment metrics
- 1% rule
- 2.17% ✓
- Cap rate
- 18.60%
- Cash-on-cash
- 43.95%
- DSCR
- 2.96
- GRM
- 3.8
CMA / ARV
No comps found within radius.
Projected returns pro-forma
-3.0% appreciation · 1.82% rent growth · sell at horizon
- IRR
- 39.6%
- Equity multiple
- 2.66×
- Total profit
- $33,203
- Equity at exit
- $10,624
- IRR
- 45.4%
- Equity multiple
- 5.09×
- Total profit
- $81,666
- Equity at exit
- $6,160
Cash invested: $19,950 (down + closing). Projections, not guarantees.
Landlord ↔ Tenant lean methodology
- Overall (STATE)
- 90 Strongly Landlord-Friendly
- State Georgia
- 90 Strongly Landlord-Friendly · R+3
- County
- — inherits STATE
- City
- — inherits STATE
ZIP-level market 31903
- Home prices YoY
- -14.5%
- Rents YoY
- 1.8%
- Active inventory
- 105
- Price-to-rent
- 7.7×
Monthly cashflow live
- Estimated rent
- $1,544 medium interval (Pro) →
- Mortgage (P&I)
- −$374
- Tax from tax record
- −$86 /mo · $1,029/yr
- Insurance
- −$30
- HOA
- −$0
- Vacancy / Maint / Mgmt
- −$324
- Net cashflow
- $731
Break-even live
Sensitivity live
| Price | -10% $771 | -5% $751 | +0% $731 | +5% $711 | +10% $690 |
|---|---|---|---|---|---|
| Rent | -10% $609 | -5% $670 | +0% $731 | +5% $792 | +10% $853 |
| Rate | -1.0pp $767 | -0.5pp $749 | base $731 | +0.5pp $712 | +1.0pp $693 |
2-unit breakdown (identical units grouped — click to expand)
| Units | Beds | Baths | Est. rent |
|---|---|---|---|
| 2× units | 2 | 1 | $1,544 |
| #1 | 2 | 1 | $772 |
| #2 | 2 | 1 | $772 |
| Total (2 units) | $1,544 | ||
UW: 25.0% down · 7.5% · 30yr · 1.5% tax · 5.0% vac · 8.0% maint · 8.0% mgmt
Financing live
Cash to close
- Down payment
- $17,812
- Closing costs
- $2,138
- Reserves months
- —
- Total cash needed
- —
Loan-product check · same deal, 3 products live
Conventional
25% down · 7.5% · 30yr
- Down + closing
- —
- Monthly P&I
- —
- Monthly cashflow
- —
- DSCR
- —
- Eligible?
- —
Personal DTI + credit; lowest rate.
DSCR
20% down · 8.5% · 30yr
- Down + closing
- —
- Monthly P&I
- —
- Monthly cashflow
- —
- DSCR
- —
- Eligible?
- —
No personal income docs; deal must DSCR.
Hard money
10% down · 12.0% · 12mo
- Down + closing
- —
- Monthly P&I
- —
- Monthly cashflow
- —
- DSCR
- —
- Eligible?
- —
Short-term bridge; refi at stabilization.
Rent comps 12 comps
| Address | Beds | Baths | Sqft | Rent | $/sqft | DOM | Units | Dist |
|---|---|---|---|---|---|---|---|---|
| 76 Mathews St Columbus, GA | 3.0 | 2.0 | 1100 | $1,100 | $1.00 | 15d | 1 | 0.17mi |
| 25 Mason Dr Columbus, GA | 3.0 | 1.0 | 1038 | $1,100 | $1.06 | 23d | 1 | 0.20mi |
| 58 Stonewall Dr Columbus, GA | 3.0 | 1.0 | 1002 | $1,000 | $1.00 | 45d | 1 | 0.56mi |
| 48 Douglas St Columbus, GA | 3.0 | 1.0 | 1038 | $980 | $0.94 | 15d | 1 | 0.61mi |
| 50 Eddy Dr Columbus, GA | 3.0 | 1.0 | 1348 | $900 | $0.67 | 45d | 1 | 0.63mi |
| 2051 Somerset Ave Columbus, GA | 3.0 | 1.0 | 1092 | $1,100 | $1.01 | 45d | 1 | 0.66mi |
| 61 Lanier Dr Columbus, GA | 3.0 | 1.0 | 896 | $875 | $0.98 | 15d | 1 | 0.68mi |
| 4 Dean Dr Columbus, GA | 3.0 | 1.5 | 1200 | $1,050 | $0.88 | 15d | 1 | 0.91mi |
| 2840 Walker St Columbus, GA | 3.0 | 1.0 | 1032 | $975 | $0.94 | 45d | 1 | 0.91mi |
| 2885 Ramsey Rd Columbus, GA | 3.0 | 2.0 | 1290 | $1,075 | $0.83 | 15d | 1 | 1.06mi |
| 2829 Ramsey Rd Columbus, GA | 3.0 | 1.0 | 1252 | $1,100 | $0.88 | 15d | 1 | 1.13mi |
| 2558 Rice St Columbus, GA | 3.0 | 2.0 | 1618 | $1,450 | $0.90 | 15d | 1 | 1.29mi |
Listing history 30 events
-
2026-06-22days on market $71,250 Active 30 DOM
-
2026-06-18days on market $71,250 Active 27 DOM
-
2026-06-17days on market $71,250 Active 26 DOM
-
2026-06-16days on market $71,250 Active 25 DOM
-
2026-06-15days on market $71,250 Active 24 DOM
-
2026-06-14days on market $71,250 Active 22 DOM
-
2026-06-13days on market $71,250 Active 21 DOM
-
2026-06-10days on market $71,250 Active 19 DOM
-
2026-06-09days on market $71,250 Active 18 DOM
-
2026-06-08days on market $71,250 Active 17 DOM
-
2026-06-07days on market $71,250 Active 16 DOM
-
2026-06-05days on market $71,250 Active 13 DOM
-
2026-06-03days on market $71,250 Active 12 DOM
-
2026-06-02days on market $71,250 Active 11 DOM
-
2026-06-01pricedays on market $71,250 Active 10 DOM
-
2026-05-31days on market $75,000 Active 9 DOM
-
2026-05-30days on market $75,000 Active 8 DOM
-
2026-05-22$75,000 Active
-
2025-12-31historical
-
2025-11-02status Active
-
2025-10-31historical
-
2025-09-30historical
-
2025-08-07$85,000 Active
-
2025-08-07$85,000 New
-
2022-06-21soldstatus $60,000
-
2022-06-10soldstatus $60,000
-
2022-04-23$60,000
-
2021-09-09soldstatus $50,000
-
2021-09-01soldstatus $50,000
-
2021-08-12$57,900
ⓘ Source: listings_history table (triggers on properties + properties_extension) + one-shot
backfill from property_details.listing_events for pre-trigger history.
Tax reassessment forecast GA · Resets to sale price
- Current annual tax
- $1,029 · $86/mo
- Projected year-2 tax
- $1,029 · $86/mo
- Expected delta
- $0/yr ($0/mo · 0.0%)
ⓘ Screening estimate from a state-policy table — verify with the county assessor before closing.
Climate risk First Street
- Flood 1/10 Low FEMA zone X (unshaded) · 0% chance over 30 yrs
- Wildfire 3/10 Moderate
- Heat 7/10 Severe 7 d/yr ≥107°F today · 19 d/yr by 30 yrs out
- Wind 6/10 Major 76% chance of damaging wind over 30 yrs
- Air quality 4/10 Moderate 4 unhealthy d/yr today · 5 by 30 yrs out
Nearby sold comps map
Loading sold comps map…
Walkable amenities ~0.75 mi
Loading nearby amenities…
Taxation est. · year 1
- Rental income
- $18,528
- − Mortgage interest
- −$3,991
- − Property taxes
- −$1,029
- − Insurance
- −$356
- − Repairs & maintenance
- −$1,482
- − Management
- −$1,482
- − Depreciation
- −$2,073
- Taxable income
- $8,115
- Est. tax owed @ 24.0%
- −$1,948
- After-tax cash flow
- $6,821/yr
For passive investors: Depreciation is non-cash, so a rental often shows a tax loss while cash-flowing — sheltering income. Rental losses are passive: they offset passive income freely, and up to $25,000/yr can offset ordinary (W-2) income if you actively participate and your MAGI is under $100k (phasing out to $0 by $150k); unused losses carry forward. On sale, claimed depreciation is recaptured at up to 25%, and gains may owe capital-gains tax (a 1031 exchange can defer both). Figures are a year-1 estimate at your 24.0% rate — not tax advice; consult a CPA.
Schools (NCES district)
- District
- Muscogee County
- NCES district ID
- 1303870
- Math proficiency
- 21% ▼ -11.00%
- Reading proficiency
- 30% ▼ -7.00%
- Median HH income
- $41,176
- Composite
- 21.6/100
- National rank
- #8297
- State rank
- #120 of 174 in GA
Livability — Columbus
- Score
- 64/100
- State rank
- #254
- US rank
- #14102
Category grades
Schools grade is shown separately in the Schools card above.
Census & demographics
- Census place
- Columbus, GA
- County
- Muscogee County · 180,764 people
- City population
- 180,764
- Metro
- Columbus, GA-AL
- Population (ZIP)
- 20,644
- Household income
- $32,401
- Rent vs Own
- Severe rent burden
- 1878.0
Population outlook (Muscogee County) Hauer SSP2
- Today (2025)
- 216,729 people
- By 2030
- 224,504 · +3.6%
- By 2040
- 238,318 · +10.0%
- By 2050
- 249,027 · +14.9%
- By 2075
- 264,862 · +22.2%
- By 2100
- 254,786 · +17.6%
Race, ethnicity, and origin ACS 2023
- Neighborhood character
- Predominantly Black (77%)
- Race & ethnicity
- Black 77% Hispanic / Latino 11% White 9% Two or more races 3% Asian 1%
- Hispanic origin (detail)
- Mexican 6% Puerto Rican 2%
- Foreign-born
- 6% · Canada
- Languages at home
- 88% English-only · Spanish 10% Other Indo-European 1%
Political lean MEDSL · Muscogee
- 2024 margin
- Strong D (+23.4) · D 61.4% · R 38.0%
- 2008→2024 swing
- +3.7pp toward D · 2008: 19.7pp · 2024: 23.4pp
- All cycles
- 2024: D+23.4 2020: D+24.0 2016: D+18.6 2012: D+21.3 2008: D+19.7
Not yet ingested
- Civics
- —
Market trends
- HPI YoY
- ▼ -22.30%
- Current HPI
- 131.4761
- Rent YoY
- ▲ 1.82%
- Metro
- Columbus, GA-AL
- State GDP YoY
- ▲ 2.66%
- F500 in state
- 28
Industry mix (Fortune 500 HQ in GA)
| Industry | F500 HQs | Revenue |
|---|---|---|
| Paper / Packaging | 2 | $29B |
|
||
| Retail | 1 | $160B |
|
||
| Transportation / Logistics | 1 | $91B |
|
||
| Airlines | 1 | $62B |
|
||
| Consumer Goods | 1 | $47B |
|
||
| Utilities | 1 | $25B |
|
||
Price history
+23.1% since first listed14 events — show timeline
- 2026-06-01 Price Changed $71,250 CBOR
- 2026-05-22 Listed $75,000 CBOR
- 2025-12-31 Listing Removed — FMLS
- 2025-11-02 Relisted — FMLS
- 2025-10-31 Listing Removed — FMLS
- 2025-09-30 Listing Removed — GAMLS
- 2025-08-07 Listed $85,000 GAMLS
- 2025-08-07 Listed $85,000 FMLS
- 2022-06-21 Sold (Public Records) $60,000 Public Records
- 2022-06-10 Sold (MLS) $60,000 CBOR
- 2022-04-23 Listed $60,000 CBOR
- 2021-09-09 Sold (Public Records) $50,000 Public Records
- 2021-09-01 Sold (MLS) $50,000 CBOR
- 2021-08-12 Listed $57,900 CBOR
Property tax history
+4.9%/yrLatest (2025): $1,029 · +10.5% YoY. Source: county tax records.
Cash-flow waterfall
monthlySold comps — $/sqft
last 12 mo · ≤1 miLoading sold comps…