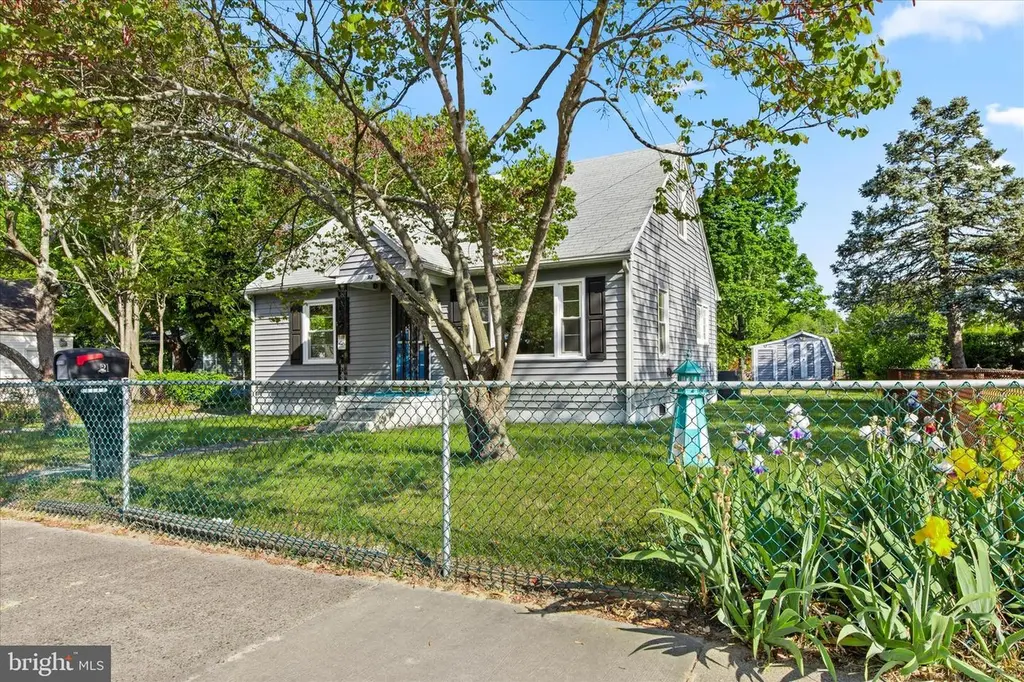
921 Brown St · Salisbury, MD
Flood risk 1/10 · Minimal
- FEMA flood zone
- X (unshaded)
- Chance of flooding over 30 yrs
- 0.0%
- Est. flood insurance / yr
- $507 – $1,088
Fire risk 1/10 · Minimal
- Est. fire insurance / yr
- $755 – $1,403
Heat risk 9/10 · Severe
- Hot days now (above 105°F)
- 7 days/yr
- Hot days in 30 yrs
- 16 days/yr
Wind risk 8/10 · Major
- Chance of severe wind over 30 yrs
- 80.0%
Air-quality risk 2/10 · Minimal
- Unhealthy air days now
- 1 days/yr
- Unhealthy air days in 30 yrs
- 2 days/yr
Risk factors via First Street. Map © Google.
Why this score? — see what drove the C- grade
The composite is a weighted blend of 9 inputs, each scored 0–100. Each bar is that input's sub-score; the figure is the points it added to the 100-point composite (weight × sub-score).
- Cash flow +22.1/30.0
- ARV discount +7.7/15.0
- DSCR +7.1/10.0
- 1% rule +4.7/10.0
- Rent growth +3.4/5.0
- Livability +3.0/5.0
- Condition / age +2.5/5.0
- Schools +1.9/10.0
- Appreciation +0.0/10.0
$165,000
🖨 Deal sheet 📄 Offer letter ✓ Due diligence
Listing remarks
Charming 3-bedroom, 1-bath home located close to shopping, dining, and everyday amenities. This well-maintained property features a functional layout with two bedrooms on the main level and a finished second floor as the 3rd bedroom or just added space for an office, workout room or playroom. Major updates have already been completed, including a roof and HVAC system replaced within the past 10 years, providing added peace of mind for the next owner. Enjoy a spacious yard—perfect for outdoor entertaining, gardening, or simply relaxing. Great opportunity for first-time buyers, downsizers, or investors looking for a solid home in a convenient location.
Key facts
- 7,405 sq ft lot
- Built 1954
- Listed 4 days
Property features AI
Finance
- Financial info: Lease not considered
Exterior
- Parking: Off-street parking
- Utilities: Public water; Public sewer
- Home design: Detached property; Ownership: Fee simple; Year built: estimated
- Construction: Stick-built with vinyl siding; Crawl space foundation; Above- and below-grade structures noted
- Exterior features: Outbuilding(s); Not in a federal flood zone; In city limits
Interior
- Kitchen: Refrigerator; Stove
- Bedrooms: Two bedrooms on the main level; One bedroom on the upper level
- Flooring: Hardwood; Laminate
- Bathrooms: One full bathroom on the main level; One full bathroom total
- Heating & cooling: Heat pump(s) heating; Central air conditioning (electric)
- Interior features: Attic/house fan; Ceiling fan(s); Entry-level bedroom
- Laundry & utility: Washer/dryer stacked; Dryer
Neighborhood map
What this means for you Summary
Snapshot
- This is a 3-bed/1.0-bath single-family listed at $165k.
Deal economics
- At list price, monthly cash flow is $266 ($3k/yr) — positive.
- The deal already cash-flows at list — no discount required.
- To meet the 1% rule (rent ≥ 1% of price), the offer needs to be $160k (3.0% below list).
- Recommended offer: $160k (3.0% below list) — sets the bar for 1% rule.
- Cap rate 8.2% vs local median 4.8% in Salisbury — top-decile yield for the area; either an underpriced asset or a hidden risk that comps aren't pricing in. Stress-test before assuming the spread holds.
Location & tenants
- Location reads 60/100 on livability (#351 in MD) — a middle-class / working-renter tenant base. Strengths: health & safety A+, cost of living A, housing A; Watch: schools D-, crime F, amenities F.
- Wicomico County Public Schools (urban): math 16% / reading 26% proficiency, ranked #19 of 24 in MD (top 79%) — low school quality limits family demand, transient renter base, plan for 1-2y turnover.
- Market conditions: Rents rising (+3.8%/yr); 195 active listings in the ZIP; 13 comparable units currently listed for rent nearby; rentals lingering (median 44d on market — plan ~5-8 weeks vacancy on turnover, expect pricing pressure); 62% of comp listings sitting > 30 days — soft ceiling on asking rent; 278 units permitted in Wicomico County in 2024 (44 in 5+ unit buildings).
Forward outlook
- Local home prices are declining (-3.0%/yr); year-one equity from $1k of loan paydown is wiped out by about $5k of value loss. Plan a longer hold.
- Wicomico County population projected at +14% by 2050 — modest demand growth; plan on rents tracking national, not racing it.
Negotiation context
- Only 4 days on market — expect competitive offers; lowballing is unlikely to land.
Risks & watch-outs
- Watch-outs: built in 1954 — expect roof / HVAC / electrical / plumbing capex.
- Climate carrying-cost: severe wind risk, 80% chance of damaging wind over 30y; extreme-heat days projected 7→16/yr by 2055 (HVAC capex compounding) — expect insurance premiums to compound above CPI over the hold.
Questions for the listing agent
- Built in 1954 — when were the roof, HVAC, electrical panel, plumbing, and water heater last replaced?
- Is there a deadline driving the sale (1031 exchange, divorce, estate, relocation)? That informs how much negotiation room exists.
- Schools are D-rated, which usually means shorter tenancies and higher turnover. Who's the typical renter profile here, and what's been the actual vacancy rate?
- Crime grade is F in this area — have there been break-ins, vandalism, or insurance claims at this property in the last 3 years? What carrier currently insures it and at what premium?
- What's the average days-on-market for RENTAL listings here right now (not sales)? A rising rental-DOM trend means longer vacancies and softer asking-rent achievability than the comps imply.
- What's the recent tenant-quality profile in this submarket — average credit score on applications, eviction rate, late-payment / NSF rate, and stable-employment percentage? A property-management company in the area should have these aggregated.
- How much new for-sale + rental construction is in the pipeline within 1–3 miles? Heavy new supply typically softens prices + rents 12–24 months out; constrained supply supports both.
Investment metrics
- 1% rule
- 0.97% ✗
- Cap rate
- 8.23%
- Cash-on-cash
- 6.91%
- DSCR
- 1.31
- GRM
- 8.6
CMA / ARV
- ARV (median comp)
- $165,736
- List price
- $165,000
- Delta
- -0.44%
- Verdict
- FAIR
- Comps
- 20 within 1.0 mi
Show comp detail 12 sales within ~0.75 mi
| Address | Dist | Beds/Ba | Sqft | Sold | Price | $/sf | Match |
|---|---|---|---|---|---|---|---|
| 921 Brown St | 0.00mi | 3/1.0 | 1,212 (0%) | 1mo | $165,000 | $136 | 99 |
| 627 Liberty St | 0.24mi | 3/2.5 | 1,189 (-2%) | 6mo | $223,000 | $188 | 75 |
| 406 Hammond St | 0.27mi | 3/1.0 | 1,326 (+9%) | 3mo | $196,600 | $148 | 70 |
| 508 Christopher St | 0.25mi | 3/2.0 | 1,120 (-8%) | 3mo | $160,000 | $143 | 69 |
| 1405 Westchester St | 0.37mi | 3/1.5 | 1,300 (+7%) | 0mo | $261,000 | $201 | 68 |
| 113 Priscilla St | 0.51mi | 2/1.0 (-1) | 1,248 (+3%) | 0mo | $180,000 | $144 | 66 |
| 1012 Phillips Ave | 0.48mi | 3/2.0 | 1,244 (+3%) | 4mo | $260,000 | $209 | 66 |
| 1313 Westchester St | 0.37mi | 3/1.0 | 1,050 (-13%) | 5mo | $220,000 | $210 | 57 |
| 109 Priscilla St | 0.53mi | 3/2.0 | 1,359 (+12%) | 1mo | $267,000 | $196 | 50 |
| 124 Priscilla St | 0.44mi | 3/1.5 | 1,392 (+15%) | 3mo | $145,500 | $105 | 50 |
| 208 Union Ave | 0.55mi | 4/2.0 (+1) | 1,336 (+10%) | 3mo | $265,000 | $198 | 46 |
| 102-1 S Saratoga St | 0.57mi | 2/1.0 (-1) | 1,080 (-11%) | 6mo | $209,900 | $194 | 45 |
Match score weights: distance 35% · size 25% · config 20% · recency 20%. Top-matched comps best support the ARV.
Projected returns pro-forma
-3.0% appreciation · 3.78% rent growth · sell at horizon
- IRR
- -4.9%
- Equity multiple
- 0.81×
- Total profit
- $-8,580
- Equity at exit
- $24,602
- IRR
- 5.5%
- Equity multiple
- 1.42×
- Total profit
- $19,379
- Equity at exit
- $14,266
Cash invested: $46,200 (down + closing). Projections, not guarantees.
Landlord ↔ Tenant lean methodology
- Overall (STATE)
- 27 Tenant-Leaning
- State Maryland
- 27 Tenant-Leaning · D+14
- County
- — inherits STATE
- City
- — inherits STATE
ZIP-level market 21804
- Home prices YoY
- -26.7%
- Rents YoY
- 3.8%
- Active inventory
- 195
- Price-to-rent
- 8.6×
Monthly cashflow live
- Estimated rent
- $1,600 high interval (Pro) →
- Mortgage (P&I)
- −$865
- Tax from tax record
- −$64 /mo · $767/yr
- Insurance
- −$69
- HOA
- −$0
- Vacancy / Maint / Mgmt
- −$336
- Net cashflow
- $266
Break-even live
UW: 25.0% down · 7.5% · 30yr · 1.5% tax · 5.0% vac · 8.0% maint · 8.0% mgmt
Financing live
Cash to close
- Down payment
- $41,250
- Closing costs
- $4,950
- Reserves months
- —
- Total cash needed
- —
Loan-product check · same deal, 3 products live
Conventional
25% down · 7.5% · 30yr
- Down + closing
- —
- Monthly P&I
- —
- Monthly cashflow
- —
- DSCR
- —
- Eligible?
- —
Personal DTI + credit; lowest rate.
DSCR
20% down · 8.5% · 30yr
- Down + closing
- —
- Monthly P&I
- —
- Monthly cashflow
- —
- DSCR
- —
- Eligible?
- —
No personal income docs; deal must DSCR.
Hard money
10% down · 12.0% · 12mo
- Down + closing
- —
- Monthly P&I
- —
- Monthly cashflow
- —
- DSCR
- —
- Eligible?
- —
Short-term bridge; refi at stabilization.
Rent comps 13 comps
| Address | Beds | Baths | Sqft | Rent | $/sqft | DOM | Units | Dist |
|---|---|---|---|---|---|---|---|---|
| 906 Johnson St Salisbury, MD | 3.0 | 1.5 | 875 | $1,495 | $1.71 | 44d | 1 | 0.10mi |
| 929 Johnson St Salisbury, MD | 2.0 | 1.0 | 988 | $1,400 | $1.42 | 21d | 1 | 0.10mi |
| 604 Liberty St Salisbury, MD | 3.0 | 1.0 | 1110 | $1,500 | $1.35 | 44d | 1 | 0.13mi |
| 411 Dover St Salisbury, MD | 3.0 | 2.0 | 984 | $1,600 | $1.63 | 44d | 1 | 0.13mi |
| 821 Johnson St Salisbury, MD | 2.0 | 1.0 | 939 | $1,495 | $1.59 | 13d | 1 | 0.15mi |
| 915 N Division St Unit A Salisbury, MD | 3.0 | 1.0 | 900 | $1,395 | $1.55 | 44d | 1 | 0.57mi |
| 205 W London Ave Salisbury, MD | 2.0 | 1.0 | 840 | $1,500 | $1.79 | 21d | 1 | 0.59mi |
| 529 E William St Salisbury, MD | 3.0 | 1.0 | 1057 | $1,495 | $1.41 | 21d | 1 | 0.80mi |
| 504 Plover Rd Salisbury, MD | 3.0 | 1.0 | 768 | $1,295 | $1.69 | 44d | 1 | 1.04mi |
| 304 Glen Ave Salisbury, MD | 1.0–2.0 | 1.0 | 675 | $1,300 | $1.93 | 44d | 4 | 1.07mi |
| 308 N Division St #12 Salisbury, MD | 2.0 | 1.0 | 990 | $1,295 | $1.31 | 44d | 1 | 1.07mi |
| 507 Overbrook Dr Salisbury, MD | 3.0 | 1.0 | 1140 | $1,495 | $1.31 | 13d | 1 | 1.33mi |
| 218 W Main St Unit 401 Salisbury, MD | 2.0 | 1.0 | 1060 | $1,695 | $1.60 | 44d | 1 | 1.34mi |
Listing history 4 events
-
2026-05-09status Pending 664-char remark
-
2026-05-06$165,000 Active 664-char remark
-
2026-04-28historical $165,000 664-char remark
-
1989-09-13soldstatus $44,000
ⓘ Source: listings_history table (triggers on properties + properties_extension) + one-shot
backfill from property_details.listing_events for pre-trigger history.
Tax reassessment forecast MD · Partial reset (capped growth)
- Current annual tax
- $767 · $64/mo
- Projected year-2 tax
- $1,283 · $107/mo
- Expected delta
- +$516/yr (+$43/mo · 67.3%)
ⓘ Screening estimate from a state-policy table — verify with the county assessor before closing.
Climate risk First Street
- Flood 1/10 Low FEMA zone X (unshaded) · 0% chance over 30 yrs
- Wildfire 1/10 Low
- Heat 9/10 Extreme 7 d/yr ≥105°F today · 16 d/yr by 30 yrs out
- Wind 8/10 Severe 80% chance of damaging wind over 30 yrs
- Air quality 2/10 Low 1 unhealthy d/yr today · 2 by 30 yrs out
Nearby sold comps map
Loading sold comps map…
Walkable amenities ~0.75 mi
Loading nearby amenities…
Taxation est. · year 1
- Rental income
- $19,202
- − Mortgage interest
- −$9,243
- − Property taxes
- −$767
- − Insurance
- −$825
- − Repairs & maintenance
- −$1,536
- − Management
- −$1,536
- − Depreciation
- −$4,800
- Taxable income
- $495
- Est. tax owed @ 24.0%
- −$119
- After-tax cash flow
- $3,076/yr
For passive investors: Depreciation is non-cash, so a rental often shows a tax loss while cash-flowing — sheltering income. Rental losses are passive: they offset passive income freely, and up to $25,000/yr can offset ordinary (W-2) income if you actively participate and your MAGI is under $100k (phasing out to $0 by $150k); unused losses carry forward. On sale, claimed depreciation is recaptured at up to 25%, and gains may owe capital-gains tax (a 1031 exchange can defer both). Figures are a year-1 estimate at your 24.0% rate — not tax advice; consult a CPA.
Schools (NCES district)
- District
- Wicomico County Public Schools
- NCES district ID
- 2400690
- Math proficiency
- 16% ▼ -18.00%
- Reading proficiency
- 26% ▼ -13.00%
- Median HH income
- $51,745
- Composite
- 18.87/100
- National rank
- #8860
- State rank
- #19 of 24 in MD
Livability — Salisbury
- Score
- 60/100
- State rank
- #351
- US rank
- #18948
Category grades
Schools grade is shown separately in the Schools card above.
Census & demographics
- Census place
- Salisbury, MD
- County
- Wicomico County · 75,969 people
- City population
- 70,518
- Metro
- Salisbury, MD-DE
- Population (ZIP)
- 40,430
- Household income
- $73,156
- Rent vs Own
- Severe rent burden
- 2096.0
Population outlook (Wicomico County) Hauer SSP2
- Today (2025)
- 108,548 people
- By 2030
- 111,783 · +3.0%
- By 2040
- 118,139 · +8.8%
- By 2050
- 123,641 · +13.9%
- By 2075
- 139,784 · +28.8%
- By 2100
- 145,334 · +33.9%
Race, ethnicity, and origin ACS 2023
- Neighborhood character
- Diverse neighborhood (Simpson 0.61)
- Race & ethnicity
- White 54% Black 30% Two or more races 9% Hispanic / Latino 7% Asian 3%
- Hispanic origin (detail)
- Mexican 4% Dominican 1%
- Common ancestry
- Hispanic 8% Romanian 3% Slovak 1%
- Foreign-born
- 13% · Canada, Vietnam, South Korea
- Languages at home
- 83% English-only · French/Haitian/Cajun 7% Spanish 5% Other Indo-European 2%
Political lean MEDSL · Wicomico
- 2024 margin
- Lean R (+5.5) · D 46.1% · R 51.5% · Other 2.4%
- 2008→2024 swing
- +0.3pp no change · 2008: -5.8pp · 2024: -5.5pp
- All cycles
- 2024: R+5.5 2020: R+1.9 2016: R+11.6 2012: R+6.9 2008: R+5.8
Not yet ingested
- Civics
- —
Market trends
- HPI YoY
- ▼ -84.15%
- Current HPI
- 230.6099
- Rent YoY
- ▲ 3.78%
- Metro
- Salisbury, MD-DE
- State GDP YoY
- ▲ 2.97%
- F500 in state
- 12
Industry mix (Fortune 500 HQ in MD)
| Industry | F500 HQs | Revenue |
|---|---|---|
| Aerospace / Defense | 1 | $71B |
|
||
| Utilities | 1 | $25B |
|
||
| Hotels | 1 | $24B |
|
||
| Consumer Goods | 1 | $7B |
|
||
| Real Estate | 1 | $6B |
|
||
| Chemicals | 1 | $2B |
|
||
Price history
+275.0% since first listed5 events — show timeline
- 2026-05-29 Sold (MLS) $165,000 BRIGHT MLS
- 2026-05-09 Pending — BRIGHT MLS
- 2026-05-06 Listed $165,000 BRIGHT MLS
- 2026-04-28 Coming Soon $165,000 BRIGHT MLS
- 1989-09-13 Sold (Public Records) $44,000 Public Records
Property tax history
-1.5%/yrLatest (2025): $767 · +7.4% YoY. Source: county tax records.
Cash-flow waterfall
monthlySold comps — $/sqft
last 12 mo · ≤1 miLoading sold comps…