 Multi-family
16828 W Lawson · Wichita, KS
Flood risk No data
- FEMA flood zone
- —
- Chance of flooding over 30 yrs
- —
- Est. flood insurance / yr
- —
Fire risk No data
- Est. fire insurance / yr
- —
Heat risk No data
- Hot days now (above threshold)
- —
- Hot days in 30 yrs
- —
Wind risk No data
- Chance of severe wind over 30 yrs
- —
Air-quality risk No data
- Unhealthy air days now
- —
- Unhealthy air days in 30 yrs
- —
Risk factors via First Street. Map © Google.
Why this score? — see what drove the C- grade
The composite is a weighted blend of 9 inputs, each scored 0–100. Each bar is that input's sub-score; the figure is the points it added to the 100-point composite (weight × sub-score).
- Cash flow +18.1/30.0
- ARV discount +7.5/15.0
- DSCR +5.7/10.0
- 1% rule +5.4/10.0
- Condition / age +4.0/5.0
- Schools +3.9/10.0
- Livability +3.6/5.0
- Rent growth +2.5/5.0
- Appreciation +0.0/10.0
$179,900
🖨 Deal sheet 📄 Offer letter ✓ Due diligence
Multi-family units
County records classify this as Multi-Family (2-4 Unit). Listing-text estimate: 1 unit. estimate disagrees with records
Key facts
- Move-in-ready
- Natural light
- Elegant living room
Tags
Property features AI
Finance
- HOA & community: Homeowners association with lawn service included; Association fee $840 (one-time initiation fee $200)
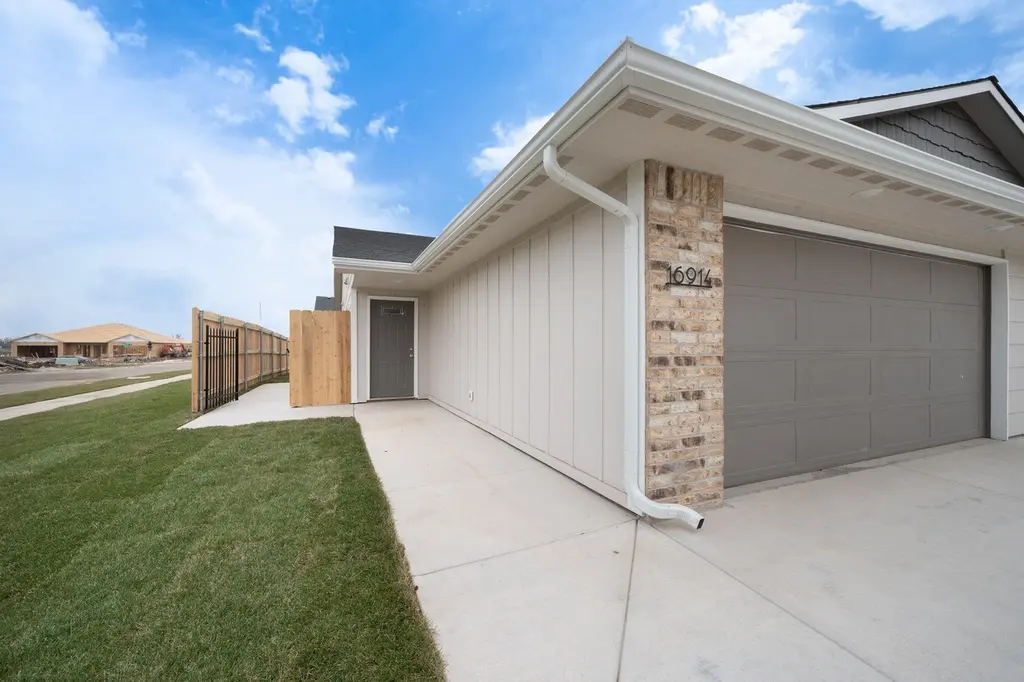
Exterior
- Parking: 2-car garage
- Security: Smoke detector(s)
- Utilities: Natural gas available; Public water; Sewer available
- Home design: Duplex; Corner lot location
- Construction: Composition roof; No basement
- Exterior features: One-level layout; Patio; Wood fencing
Interior
- Kitchen: Dishwasher; Disposal; Microwave; Range; Refrigerator
- Bathrooms: 2 full bathrooms
- Heating & cooling: Central air (electric); Forced air heating (natural gas)
- Interior features: Electric fireplace insert in the living room; Smoke detector(s)
- Laundry & utility: Main-floor laundry with 220V hookup
Neighborhood map
What this means for you Summary
Snapshot
- This is a 3-bed/2.0-bath multifamily listed at $180k. Condition is rated good.
Deal economics
- At list price, monthly cash flow is $159 ($2k/yr) — positive.
- The deal already cash-flows at list — no discount required.
- Meets the 1% rule at list price ($2k rent vs $180k).
- Recommended offer: $175k (3.0% below list) — sets the bar for market timing.
Location & tenants
- Location reads 72/100 on livability (#100 in KS) — a middle-class / working-renter tenant base. Strengths: amenities A+, cost of living A+, housing A+; Watch: employment D+, crime F, commute F.
- Goddard (rural): math 38% / reading 46% proficiency, ranked #18 of 169 in KS (top 11%) — families likely to look elsewhere, expect single-tenant / working-renter base with shorter leases; only 17% free/reduced lunch — higher-income household profile.
- Zoned schools: Explorer Elementary School (math 47% / reading 62%, grade C, #107 of 684 statewide, top 18%, 472 students, 27% FRL); Dwight D. Eisenhower Middle School (math 45% / reading 40%, grade D-, #17 of 219 statewide, top 7%, 614 students, 16% FRL); Eisenhower High School (math 29% / reading 40%, grade F, #32 of 327 statewide, top 13%, 1,002 students, 23% FRL) — zoned schools at 22% FRL track the district average.
- Market conditions: 407 active listings in the ZIP; 2 comparable units currently listed for rent nearby; solid renter incomes; 2,613 units permitted in Sedgwick County in 2024 (258 in 5+ unit buildings).
Forward outlook
- Local home prices are declining (-3.0%/yr); year-one equity from $1k of loan paydown is wiped out by about $5k of value loss. Plan a longer hold.
- Sedgwick County population projected at +5% by 2050 — modest demand growth; plan on rents tracking national, not racing it.
Negotiation context
- It's been on market 43 days — a 3% lower offer ($175k) is reasonable based on typical stale-listing flexibility.
Questions for the listing agent
- It's been on market 43 days. Have you received any prior offers? Is the seller open to a 3% concession, seller financing, or rate buy-down credit?
- What does the HOA fee cover, when was the last increase, and are there any pending special assessments or reserve-fund shortfalls?
- Is there a deadline driving the sale (1031 exchange, divorce, estate, relocation)? That informs how much negotiation room exists.
- Schools are F-rated, which usually means shorter tenancies and higher turnover. Who's the typical renter profile here, and what's been the actual vacancy rate?
- Crime grade is F in this area — have there been break-ins, vandalism, or insurance claims at this property in the last 3 years? What carrier currently insures it and at what premium?
- What's the average days-on-market for RENTAL listings here right now (not sales)? A rising rental-DOM trend means longer vacancies and softer asking-rent achievability than the comps imply.
- What's the recent tenant-quality profile in this submarket — average credit score on applications, eviction rate, late-payment / NSF rate, and stable-employment percentage? A property-management company in the area should have these aggregated.
- How much new apartment / multifamily construction is in the pipeline within 1–3 miles? Heavy new supply (>2% of stock underway) typically softens rents 12–24 months out; light construction supports rent growth.
Investment metrics
- 1% rule
- 1.04% ✓
- Cap rate
- 7.35%
- Cash-on-cash
- 3.78%
- DSCR
- 1.17
- GRM
- 8.0
CMA / ARV
No comps found within radius.
Projected returns pro-forma
-3.0% appreciation · 3.0% rent growth · sell at horizon
- IRR
- -10.3%
- Equity multiple
- 0.62×
- Total profit
- $-18,978
- Equity at exit
- $26,824
- IRR
- -0.9%
- Equity multiple
- 0.94×
- Total profit
- $-3,228
- Equity at exit
- $15,554
Cash invested: $50,372 (down + closing). Projections, not guarantees.
Landlord ↔ Tenant lean methodology
- Overall (STATE)
- 83 Strongly Landlord-Friendly
- State Kansas
- 83 Strongly Landlord-Friendly · R+10
- County
- — inherits STATE
- City
- — inherits STATE
ZIP-level market 67052
- Home prices YoY
- -17.1%
- Active inventory
- 407
- Price-to-rent
- 8.0×
Monthly cashflow live
- Estimated rent
- $1,863 medium interval (Pro) →
- Mortgage (P&I)
- −$943
- Tax est. 1.5%
- −$225 /mo · $2,698/yr
- Insurance
- −$75
- HOA
- −$70
- Vacancy / Maint / Mgmt
- −$391
- Net cashflow
- $159
Break-even live
UW: 25.0% down · 7.5% · 30yr · 1.5% tax · 5.0% vac · 8.0% maint · 8.0% mgmt
Financing live
Cash to close
- Down payment
- $44,975
- Closing costs
- $5,397
- Reserves months
- —
- Total cash needed
- —
Loan-product check · same deal, 3 products live
Conventional
25% down · 7.5% · 30yr
- Down + closing
- —
- Monthly P&I
- —
- Monthly cashflow
- —
- DSCR
- —
- Eligible?
- —
Personal DTI + credit; lowest rate.
DSCR
20% down · 8.5% · 30yr
- Down + closing
- —
- Monthly P&I
- —
- Monthly cashflow
- —
- DSCR
- —
- Eligible?
- —
No personal income docs; deal must DSCR.
Hard money
10% down · 12.0% · 12mo
- Down + closing
- —
- Monthly P&I
- —
- Monthly cashflow
- —
- DSCR
- —
- Eligible?
- —
Short-term bridge; refi at stabilization.
Rent comps 2 comps
| Address | Beds | Baths | Sqft | Rent | $/sqft | DOM | Units | Dist |
|---|---|---|---|---|---|---|---|---|
| 127 S 167th St W Goddard, KS | 3.0–5.0 | 2.0–3.0 | 1543 | $1,595 | $1.03 | 13d | 1 | 0.06mi |
| 16277 W Ike Ct Unit 16277 Goddard, KS | 3.0 | 2.0 | 1180 | $1,475 | $1.25 | 23d | 1 | 1.13mi |
HOA detail
- Monthly dues
- $70 · $840/yr
Listing history 16 events
-
2026-06-18days on market $179,900 Active 43 DOM
-
2026-06-17days on market $179,900 Active 42 DOM
-
2026-06-16days on market $179,900 Active 41 DOM
-
2026-06-15days on market $179,900 Active 40 DOM
-
2026-06-14days on market $179,900 Active 38 DOM
-
2026-06-13days on market $179,900 Active 37 DOM
-
2026-06-10days on market $179,900 Active 35 DOM
-
2026-06-09days on market $179,900 Active 34 DOM
-
2026-06-08days on market $179,900 Active 33 DOM
-
2026-06-07days on market $179,900 Active 32 DOM
-
2026-06-03days on market $179,900 Active 28 DOM
-
2026-06-02days on market $179,900 Active 27 DOM
-
2026-06-01days on market $179,900 Active 26 DOM
-
2026-05-31days on market $179,900 Active 25 DOM
-
2026-05-30days on market $179,900 Active 24 DOM
-
2026-05-06$179,900 Active
ⓘ Source: listings_history table (triggers on properties + properties_extension) + one-shot
backfill from property_details.listing_events for pre-trigger history.
Nearby sold comps map
Loading sold comps map…
Walkable amenities ~0.75 mi
Loading nearby amenities…
Taxation est. · year 1
- Rental income
- $22,357
- − Mortgage interest
- −$10,077
- − Property taxes
- −$2,698
- − Insurance
- −$900
- − Repairs & maintenance
- −$1,789
- − Management
- −$1,789
- − HOA
- −$840
- − Depreciation
- −$5,233
- Taxable loss
- −$968
- Est. tax savings @ 24.0%
- +$232
- After-tax cash flow
- $2,136/yr
For passive investors: Depreciation is non-cash, so a rental often shows a tax loss while cash-flowing — sheltering income. Rental losses are passive: they offset passive income freely, and up to $25,000/yr can offset ordinary (W-2) income if you actively participate and your MAGI is under $100k (phasing out to $0 by $150k); unused losses carry forward. On sale, claimed depreciation is recaptured at up to 25%, and gains may owe capital-gains tax (a 1031 exchange can defer both). Figures are a year-1 estimate at your 24.0% rate — not tax advice; consult a CPA.
Condition & rehab AI · 12 photos
This home is in good condition with a modern kitchen and bathrooms. It has a good curb appeal and is move-in ready. However, there are opportunities to increase its value through minor updates such as painting, flooring, and smart home features.
Value-add opportunities
- Both Painting the interior walls — Fresh paint can enhance the appearance and value of the home.
- Both Updating the flooring — New flooring can improve the overall look and feel of the home.
- Both Upgrading the appliances — Modern appliances can attract more buyers and renters.
- Both Adding smart home features — Smart home features can increase the home's appeal and value.
- Both Landscaping improvements — A well-maintained yard can enhance the curb appeal and attract more buyers and renters.
Renovation cost estimate screening
Value-add ROI direction
- Both Painting the interior walls — Fresh paint can enhance the appearance and value of the home. ↑
- Both Updating the flooring — New flooring can improve the overall look and feel of the home. ↑
- Both Upgrading the appliances — Modern appliances can attract more buyers and renters. ↑
- Both Adding smart home features — Smart home features can increase the home's appeal and value. ↑
- Both Landscaping improvements — A well-maintained yard can enhance the curb appeal and attract more buyers and renters. ↑
ⓘ Cost ranges are severity-bucket heuristics (US national rule-of-thumb). Get contractor quotes + a written scope before underwriting a rehab budget.
Schools (NCES district)
- District
- Goddard
- NCES district ID
- 2006540
- Math proficiency
- 38% ▼ -4.00%
- Reading proficiency
- 46% ▼ -2.00%
- Median HH income
- $80,167
- Composite
- 39.01/100
- National rank
- #4067
- State rank
- #18 of 169 in KS
Livability — Wichita
- Score
- 72/100
- State rank
- #100
- US rank
- #5730
Category grades
Schools grade is shown separately in the Schools card above.
Census & demographics
- County
- Sedgwick County · 432,957 people
- City population
- 365,168
- Metro
- Wichita, KS
- Population (ZIP)
- 9,262
- Household income
- $103,148
- Rent vs Own
- Severe rent burden
- 43.0
Population outlook (Sedgwick County) Hauer SSP2
- Today (2025)
- 537,014 people
- By 2030
- 546,984 · +1.9%
- By 2040
- 559,141 · +4.1%
- By 2050
- 562,027 · +4.7%
- By 2075
- 557,255 · +3.8%
- By 2100
- 513,383 · -4.4%
Race, ethnicity, and origin ACS 2023
- Neighborhood character
- Predominantly White (88%)
- Race & ethnicity
- White 88% Hispanic / Latino 8% Two or more races 6%
- Hispanic origin (detail)
- Mexican 6%
- Common ancestry
- Iranian 2% Romanian 2% Lithuanian 2%
- Foreign-born
- 1% · China, Canada
- Languages at home
- 95% English-only · Spanish 4%
Political lean MEDSL · Sedgwick
- 2024 margin
- R (+13.8) · D 42.3% · R 56.1% · Other 1.6%
- 2008→2024 swing
- -1.1pp toward R · 2008: -12.7pp · 2024: -13.8pp
- All cycles
- 2024: R+13.8 2020: R+12.6 2016: R+19.1 2012: R+19.7 2008: R+12.7
Not yet ingested
- Civics
- —
Market trends
- HPI YoY
- ▼ -54.44%
- Current HPI
- 264.1893
- Rent YoY
- —
- Metro
- Wichita, KS
- State GDP YoY
- —
- F500 in state
- 0
Price history
1 event — show timeline
- 2026-05-06 Listed $179,900 SCKMLS as Distributed by MLS Grid
Cash-flow waterfall
monthlySold comps — $/sqft
last 12 mo · ≤1 miLoading sold comps…