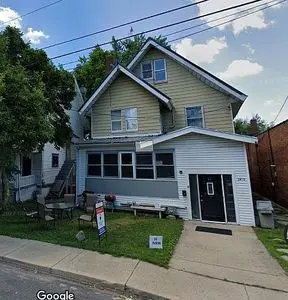
2419 N Prospect Rd · Peoria, IL
Flood risk 1/10 · Minimal
- FEMA flood zone
- X
- Chance of flooding over 30 yrs
- 0.0%
- Est. flood insurance / yr
- $473 – $860
Fire risk 1/10 · Minimal
- Est. fire insurance / yr
- $804 – $1,492
Heat risk 3/10 · Minor
- Hot days now (above 105°F)
- 7 days/yr
- Hot days in 30 yrs
- 18 days/yr
Wind risk 2/10 · Minimal
- Chance of severe wind over 30 yrs
- 1.0%
Air-quality risk 3/10 · Minor
- Unhealthy air days now
- 1 days/yr
- Unhealthy air days in 30 yrs
- 3 days/yr
Risk factors via First Street. Map © Google.
Why this score? — see what drove the B- grade
The composite is a weighted blend of 9 inputs, each scored 0–100. Each bar is that input's sub-score; the figure is the points it added to the 100-point composite (weight × sub-score).
- Cash flow +30.0/30.0
- 1% rule +10.0/10.0
- DSCR +10.0/10.0
- ARV discount +7.5/15.0
- Condition / age +4.0/5.0
- Livability +3.7/5.0
- Rent growth +3.4/5.0
- Schools +1.1/10.0
- Appreciation +0.0/10.0
$80,000
🖨 Deal sheet 📄 Offer letter ✓ Due diligence
Listing remarks
Calling all Investors! This sober living home is a great opportunity to expand your portfolio. The business, the house, and all the contents are included. It can currently house 7 tenants but can easily get approval for 9 from the city. Current tenants pay $500 a month but that just increased to $600. There& apos; s also room to expand into the third floor and increase the occupancy to 14. Updates within the last 2 years include: roof, plumbing, electrical, doors, windows, flooring, water heater, 4 car concrete driveway, and much more.
Key facts
- Plumbing
- Roof
- Doors
Tags
Neighborhood map
What this means for you Summary
Snapshot
- This is a 6-bed/3.0-bath other listed at $80k. Condition is rated good.
Deal economics
- At list price, monthly cash flow is $499 ($6k/yr) — positive.
- The deal already cash-flows at list — no discount required.
- Meets the 1% rule at list price ($2k rent vs $80k).
- Recommended offer: $79k (1.5% below list) — sets the bar for market timing.
- Cap rate 13.8% vs local median 5.6% in Peoria — top-decile yield for the area; either an underpriced asset or a hidden risk that comps aren't pricing in. Stress-test before assuming the spread holds.
Location & tenants
- Location reads 73/100 on livability (#270 in IL) — a middle-class / working-renter tenant base. Strengths: commute A+, cost of living A+, housing A+; Watch: employment D+, schools F, crime F.
- Peoria SD 150 (urban): math 11% / reading 14% proficiency, ranked #554 of 620 in IL (top 89%) — low school quality limits family demand, transient renter base, plan for 1-2y turnover; 70% free/reduced lunch — lower-income household profile, screen leases tightly.
- Market conditions: Rents rising (+3.5%/yr); 104 active listings in the ZIP; lower-income renter base — watch delinquency; 73 units permitted in Peoria County in 2024 (0 in 5+ unit buildings).
- This rent runs 45% of the median local income ($42k/yr) — at the standard rent-burdened threshold; future hikes will face affordability resistance.
Forward outlook
- Local home prices are declining (-3.0%/yr); year-one equity from $553 of loan paydown is wiped out by about $2k of value loss. Plan a longer hold.
- Peoria County population projected at -11% by 2050 — secular population decline; favor cash flow + early exit over multi-decade hold.
- At projected returns (-3.0% appreciation + 3.5% rent growth), your $22k cash investment doubles in ~5 years — after that, you're playing with house money.
Negotiation context
- It's been on market 24 days — a 2% lower offer ($79k) is reasonable based on typical stale-listing flexibility.
- 7 sale attempts since 4y ago with the ask held roughly flat each time — persistent listings suggest the price (not the market) is what's stuck; bring a comps-based counter.
Risks & watch-outs
- Watch-outs: property tax is 4.1% of price; built in 1930 — expect roof / HVAC / electrical / plumbing capex.
Questions for the listing agent
- Built in 1930 — when were the roof, HVAC, electrical panel, plumbing, and water heater last replaced?
- Property tax is high relative to price — has the assessment been appealed recently, and will the sale trigger a re-assessment?
- Is there a deadline driving the sale (1031 exchange, divorce, estate, relocation)? That informs how much negotiation room exists.
- Schools are F-rated, which usually means shorter tenancies and higher turnover. Who's the typical renter profile here, and what's been the actual vacancy rate?
- Crime grade is F in this area — have there been break-ins, vandalism, or insurance claims at this property in the last 3 years? What carrier currently insures it and at what premium?
- What's the average days-on-market for RENTAL listings here right now (not sales)? A rising rental-DOM trend means longer vacancies and softer asking-rent achievability than the comps imply.
- What's the recent tenant-quality profile in this submarket — average credit score on applications, eviction rate, late-payment / NSF rate, and stable-employment percentage? A property-management company in the area should have these aggregated.
- How much new for-sale + rental construction is in the pipeline within 1–3 miles? Heavy new supply typically softens prices + rents 12–24 months out; constrained supply supports both.
Investment metrics
- 1% rule
- 1.94% ✓
- Cap rate
- 13.78%
- Cash-on-cash
- 26.75%
- DSCR
- 2.19
- GRM
- 4.3
CMA / ARV
No comps found within radius.
Projected returns pro-forma
-3.0% appreciation · 3.49% rent growth · sell at horizon
- IRR
- 21.4%
- Equity multiple
- 1.88×
- Total profit
- $19,744
- Equity at exit
- $11,928
- IRR
- 29.9%
- Equity multiple
- 3.76×
- Total profit
- $61,875
- Equity at exit
- $6,917
Cash invested: $22,400 (down + closing). Projections, not guarantees.
Landlord ↔ Tenant lean methodology
- Overall (STATE)
- 43 Moderately Tenant-Leaning
- State Illinois
- 43 Moderately Tenant-Leaning · D+7
- County
- — inherits STATE
- City
- — inherits STATE
ZIP-level market 61603
- Home prices YoY
- -31.8%
- Rents YoY
- 3.5%
- Active inventory
- 104
- Price-to-rent
- 4.3×
Monthly cashflow live
- Estimated rent
- $1,555 medium interval (Pro) →
- Mortgage (P&I)
- −$420
- Tax from tax record
- −$276 /mo · $3,311/yr
- Insurance
- −$33
- HOA
- −$0
- Vacancy / Maint / Mgmt
- −$326
- Net cashflow
- $499
Break-even live
UW: 25.0% down · 7.5% · 30yr · 1.5% tax · 5.0% vac · 8.0% maint · 8.0% mgmt
Financing live
Cash to close
- Down payment
- $20,000
- Closing costs
- $2,400
- Reserves months
- —
- Total cash needed
- —
Loan-product check · same deal, 3 products live
Conventional
25% down · 7.5% · 30yr
- Down + closing
- —
- Monthly P&I
- —
- Monthly cashflow
- —
- DSCR
- —
- Eligible?
- —
Personal DTI + credit; lowest rate.
DSCR
20% down · 8.5% · 30yr
- Down + closing
- —
- Monthly P&I
- —
- Monthly cashflow
- —
- DSCR
- —
- Eligible?
- —
No personal income docs; deal must DSCR.
Hard money
10% down · 12.0% · 12mo
- Down + closing
- —
- Monthly P&I
- —
- Monthly cashflow
- —
- DSCR
- —
- Eligible?
- —
Short-term bridge; refi at stabilization.
Listing history 39 events
-
2026-06-19days on market $80,000 Active 24 DOM
-
2026-06-18days on market $80,000 Active 23 DOM
-
2026-06-17days on market $80,000 Active 22 DOM
-
2026-06-16days on market $80,000 Active 21 DOM
-
2026-06-15days on market $80,000 Active 20 DOM
-
2026-06-14days on market $80,000 Active 18 DOM
-
2026-06-13days on market $80,000 Active 17 DOM
-
2026-06-10days on market $80,000 Active 15 DOM
-
2026-06-09days on market $80,000 Active 14 DOM
-
2026-06-08days on market $80,000 Active 13 DOM
-
2026-06-07days on market $80,000 Active 12 DOM
-
2026-06-03days on market $80,000 Active 8 DOM
-
2026-06-02days on market $80,000 Active 7 DOM
-
2026-06-01days on market $80,000 Active 6 DOM
-
2026-05-31days on market $80,000 Active 5 DOM
-
2026-05-30days on market $80,000 Active 4 DOM
-
2026-05-26$80,000 Active
-
2025-12-17historical
-
2025-09-22historical
-
2025-05-16Active
-
2024-07-31historical
-
2024-07-22price
-
2024-07-10price
-
2024-07-02price
-
2024-06-25Active
-
2024-05-31historical
-
2024-04-30price
-
2024-01-20price
-
2023-12-30price
-
2023-10-31price
-
2023-10-16Active
-
2022-10-31historical
-
2022-10-13soldstatus $130,000
-
2022-10-07soldstatus $130,000 Closed
-
2022-09-01status Pending
-
2022-05-16status Active
-
2022-05-16Active
-
2022-04-14historical
-
2022-04-07$149,900
ⓘ Source: listings_history table (triggers on properties + properties_extension) + one-shot
backfill from property_details.listing_events for pre-trigger history.
Tax reassessment forecast IL · Partial reset (capped growth)
- Current annual tax
- $3,311 · $276/mo
- Projected year-2 tax
- $3,311 · $276/mo
- Expected delta
- $0/yr ($0/mo · 0.0%)
ⓘ Screening estimate from a state-policy table — verify with the county assessor before closing.
Climate risk First Street
- Flood 1/10 Low FEMA zone X · 0% chance over 30 yrs
- Wildfire 1/10 Low
- Heat 3/10 Moderate 7 d/yr ≥105°F today · 18 d/yr by 30 yrs out
- Wind 2/10 Low 100% chance of damaging wind over 30 yrs
- Air quality 3/10 Moderate 1 unhealthy d/yr today · 3 by 30 yrs out
Nearby sold comps map
Loading sold comps map…
Walkable amenities ~0.75 mi
Loading nearby amenities…
Taxation est. · year 1
- Rental income
- $18,655
- − Mortgage interest
- −$4,481
- − Property taxes
- −$3,311
- − Insurance
- −$400
- − Repairs & maintenance
- −$1,492
- − Management
- −$1,492
- − Depreciation
- −$2,327
- Taxable income
- $5,151
- Est. tax owed @ 24.0%
- −$1,236
- After-tax cash flow
- $4,756/yr
For passive investors: Depreciation is non-cash, so a rental often shows a tax loss while cash-flowing — sheltering income. Rental losses are passive: they offset passive income freely, and up to $25,000/yr can offset ordinary (W-2) income if you actively participate and your MAGI is under $100k (phasing out to $0 by $150k); unused losses carry forward. On sale, claimed depreciation is recaptured at up to 25%, and gains may owe capital-gains tax (a 1031 exchange can defer both). Figures are a year-1 estimate at your 24.0% rate — not tax advice; consult a CPA.
Condition & rehab AI · 1 photo
This sober living home is in good condition with recent updates, making it a solid investment opportunity for expansion and rental potential.
Value-add opportunities
- Both Painting exterior and interior walls — Enhances curb appeal and interior aesthetics
- Both Landscaping improvements — Enhances curb appeal and creates a more inviting environment
- Both Upgrading windows to energy-efficient models — Reduces energy costs and enhances home value
- Both Upgrading HVAC system — Improves comfort and energy efficiency
Renovation cost estimate screening
Value-add ROI direction
- Both Painting exterior and interior walls — Enhances curb appeal and interior aesthetics ↑
- Both Landscaping improvements — Enhances curb appeal and creates a more inviting environment ↑
- Both Upgrading windows to energy-efficient models — Reduces energy costs and enhances home value ↑
- Both Upgrading HVAC system — Improves comfort and energy efficiency ↑
ⓘ Cost ranges are severity-bucket heuristics (US national rule-of-thumb). Get contractor quotes + a written scope before underwriting a rehab budget.
Schools (NCES district)
- District
- Peoria SD 150
- NCES district ID
- 1731230
- Math proficiency
- 11% ▼ -5.00%
- Reading proficiency
- 14% ▼ -4.00%
- Median HH income
- $41,951
- Composite
- 10.92/100
- National rank
- #9751
- State rank
- #554 of 620 in IL
Livability — Peoria
- Score
- 73/100
- State rank
- #270
- US rank
- #5096
Category grades
Schools grade is shown separately in the Schools card above.
Census & demographics
- Census place
- Peoria, IL
- County
- Peoria County · 120,495 people
- City population
- 114,670
- Metro
- Peoria, IL
- Population (ZIP)
- 15,356
- Household income
- $41,618
- Rent vs Own
- Severe rent burden
- 849.0
Population outlook (Peoria County) Hauer SSP2
- Today (2025)
- 183,007 people
- By 2030
- 179,643 · -1.8%
- By 2040
- 171,782 · -6.1%
- By 2050
- 163,508 · -10.7%
- By 2075
- 140,178 · -23.4%
- By 2100
- 114,493 · -37.4%
Race, ethnicity, and origin ACS 2023
- Neighborhood character
- Diverse neighborhood (Simpson 0.68)
- Race & ethnicity
- Black 43% White 36% Two or more races 12% Hispanic / Latino 10% Asian 1%
- Hispanic origin (detail)
- Mexican 7%
- Common ancestry
- Italian 2% Slovak 1% Lithuanian 1%
- Foreign-born
- 7% · Canada
- Languages at home
- 91% English-only · Spanish 6% Tagalog/Filipino 1%
Political lean MEDSL · Peoria
- 2024 margin
- Toss-up / Even · D 51.5% · R 46.9% · Other 1.6%
- 2008→2024 swing
- -9.2pp toward R · 2008: 13.9pp · 2024: 4.7pp
- All cycles
- 2024: D+4.7 2020: D+6.3 2016: D+2.8 2012: D+4.4 2008: D+13.9
Not yet ingested
- Civics
- —
Market trends
- HPI YoY
- ▼ -65.98%
- Current HPI
- 141.5343
- Rent YoY
- ▲ 3.49%
- Metro
- Peoria, IL
- State GDP YoY
- ▲ 1.59%
- F500 in state
- 60
Industry mix (Fortune 500 HQ in IL)
| Industry | F500 HQs | Revenue |
|---|---|---|
| Insurance | 4 | $201B |
|
||
| Consumer Goods | 4 | $87B |
|
||
| Industrial Machinery | 3 | $64B |
|
||
| Healthcare | 2 | $55B |
|
||
| Retail / Pharmacy | 1 | $148B |
|
||
| Agriculture / Food | 1 | $86B |
|
||
Price history
-46.6% since first listed23 events — show timeline
- 2026-05-26 Listed $80,000 FSBO.com
- 2025-12-17 Listing Removed — MRED as Distributed by MLS Grid
- 2025-09-22 Listing Removed — RMLSA as Distributed by MLS Grid
- 2025-05-16 Listed — RMLSA as Distributed by MLS Grid
- 2024-07-31 Listing Removed — RMLSA as Distributed by MLS Grid
- 2024-07-22 Price Changed — RMLSA as Distributed by MLS Grid
- 2024-07-10 Price Changed — RMLSA as Distributed by MLS Grid
- 2024-07-02 Price Changed — RMLSA as Distributed by MLS Grid
- 2024-06-25 Listed — RMLSA as Distributed by MLS Grid
- 2024-05-31 Listing Removed — RMLSA as Distributed by MLS Grid
- 2024-04-30 Price Changed — RMLSA as Distributed by MLS Grid
- 2024-01-20 Price Changed — RMLSA as Distributed by MLS Grid
- 2023-12-30 Price Changed — RMLSA as Distributed by MLS Grid
- 2023-10-31 Price Changed — RMLSA as Distributed by MLS Grid
- 2023-10-16 Listed — RMLSA as Distributed by MLS Grid
- 2022-10-31 Listing Removed — MRED as Distributed by MLS Grid
- 2022-10-13 Sold (Public Records) $130,000 Public Records
- 2022-10-07 Sold (MLS) $130,000 RMLSA as Distributed by MLS Grid
- 2022-09-01 Pending — RMLSA as Distributed by MLS Grid
- 2022-05-16 Relisted — RMLSA as Distributed by MLS Grid
- 2022-05-16 Listed — MRED as Distributed by MLS Grid
- 2022-04-14 Listing Removed — RMLSA as Distributed by MLS Grid
- 2022-04-07 Listed $149,900 RMLSA as Distributed by MLS Grid
Property tax history
+15.6%/yrLatest (2024): $3,311 · +6.4% YoY. Source: county tax records.
Cash-flow waterfall
monthlySold comps — $/sqft
last 12 mo · ≤1 miLoading sold comps…