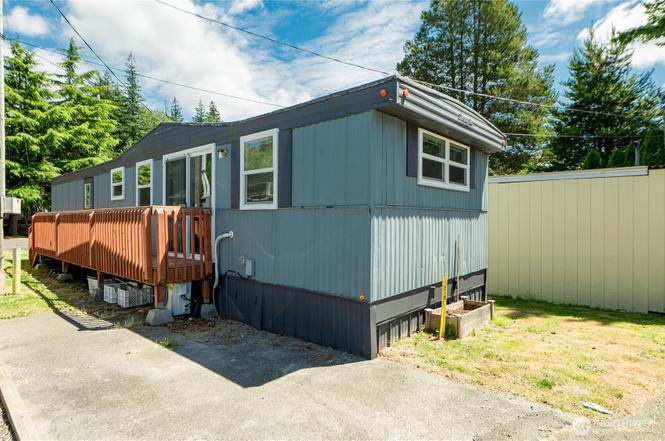
2500 Samish Way #13 · Bellingham, WA
Flood risk 1/10 · Minimal
- FEMA flood zone
- X (unshaded)
- Chance of flooding over 30 yrs
- 0.0%
- Est. flood insurance / yr
- $507 – $1,088
Fire risk 1/10 · Minimal
- Est. fire insurance / yr
- $604 – $1,122
Heat risk 1/10 · Minimal
- Hot days now (above 83°F)
- 7 days/yr
- Hot days in 30 yrs
- 17 days/yr
Wind risk 1/10 · Minimal
- Chance of severe wind over 30 yrs
- —
Air-quality risk 6/10 · Moderate
- Unhealthy air days now
- 9 days/yr
- Unhealthy air days in 30 yrs
- 10 days/yr
Risk factors via First Street. Map © Google.
Why this score? — see what drove the B+ grade
The composite is a weighted blend of 9 inputs, each scored 0–100. Each bar is that input's sub-score; the figure is the points it added to the 100-point composite (weight × sub-score).
- Cash flow +30.0/30.0
- ARV discount +15.0/15.0
- 1% rule +10.0/10.0
- DSCR +10.0/10.0
- Schools +4.8/10.0
- Livability +4.0/5.0
- Rent growth +3.3/5.0
- Condition / age +2.5/5.0
- Appreciation +0.0/10.0
$53,900
🖨 Deal sheet (PDF) 📄 Offer letter ✓ Due diligence
Listing remarks
This thoughtfully updated 2-bedroom, 1-bath home in Crest Haven Park offers a bright and comfortable living space just minutes from Lake Padden. Recent improvements such as fresh paint, updated flooring, and newer windows, create a clean, modern feel while preserving the home’s charm. The kitchen includes stainless steel appliances and opens to a cozy living area. A newer heat pump and in-unit washer and dryer add comfort and convenience. The sturdy porch serves both entrances and extends your living space year-round. Affordable and move-in ready, this home is a great find in a desirable, well-maintained community.
Key facts
- Covered porch
- Updated flooring
- Newer heat pump
Tags
Property features AI
Finance
- Other: MLS status: Active; On market date: January 18, 2026; Cumulative days on market: 285
- Financial info: Listing terms: Cash or Conventional; Land lease: $925/month
- HOA & community: Located in Cres Haven Mobile Court (about 50 homes); Pets allowed: cats and dogs; Common area in the park; Land lease monthly amount
Exterior
- Parking: 1 uncovered open parking space
- Utilities: Electric energy source; Public water (billed through the park); Sewer billed through the park; Power by PSE; Xfinity cable and internet
- Home design: Manufactured single-wide home; One level; Faces north; Good condition; Make: lamplighter; Structure type: manufactured house
- Construction: Metal/Vinyl construction materials; Flat roof; Built on tie down foundation
- Exterior features: Metal/vinyl exterior; Patio/porch/deck; Paved lot
Interior
- Kitchen: Dishwasher; Microwave; Refrigerator; Stove/Range; Kitchen with eating space
- Bedrooms: 2 bedrooms
- Flooring: Vinyl plank; Tie down foundation
- Bathrooms: 1 full bathroom with tub and shower
- Heating & cooling: Forced air heating; Heat pump for heating and cooling
- Interior features: Water heater (exterior access, tank); Double pane windows
- Laundry & utility: Washer; Dryer
Neighborhood map
What this means for you Summary
Snapshot
- This is a 2-bed/1.0-bath manufactured listed at $54k.
Deal economics
- At list price, monthly cash flow is $1k ($16k/yr) — positive.
- The deal already cash-flows at list — no discount required.
- Meets the 1% rule at list price ($2k rent vs $54k).
- Recommended offer: $47k (12.0% below list) — sets the bar for market timing.
- Cap rate 35.8% vs local median 2.0% in Bellingham — top-decile yield for the area; either an underpriced asset or a hidden risk that comps aren't pricing in. Stress-test before assuming the spread holds.
Location & tenants
- Location reads 80/100 on livability (#102 in WA, #1,947 nationally) — a professional / high-income tenant draw. Strengths: amenities A+, commute A+, health & safety A+; Watch: crime F, cost of living F.
- Bellingham School District (urban): math 47% / reading 63% proficiency, ranked #106 of 291 in WA (top 36%) — acceptable for families but not a draw, mixed tenant base, ~2y average lease.
- Market conditions: Rents rising (+3.4%/yr); 275 active listings in the ZIP; 4 comparable units currently listed for rent nearby; rentals at typical pace (median 22d on market — plan ~3-4 weeks tenant-placement turnaround); solid renter incomes; 1,190 units permitted in Whatcom County in 2024 (327 in 5+ unit buildings).
Forward outlook
- Local home prices are declining (-3.0%/yr); year-one equity from $373 of loan paydown is wiped out by about $2k of value loss. Plan a longer hold.
- Whatcom County population projected at +28% by 2050 — long-run rental-demand tailwind backs the buy-and-hold thesis.
- At projected returns (-3.0% appreciation + 3.4% rent growth), your $15k cash investment doubles in ~2 years — after that, you're playing with house money.
Negotiation context
- It's been on market 126 days — a 12% lower offer ($47k) is reasonable based on typical stale-listing flexibility.
Questions for the listing agent
- It's been on market 126 days. Have you received any prior offers? Is the seller open to a 12% concession, seller financing, or rate buy-down credit?
- Built in 1969 — when were the roof, HVAC, electrical panel, plumbing, and water heater last replaced?
- Why hasn't it sold? Are there any deal-killer items the seller is aware of (foundation, flood, title, zoning, code violations)?
- Is there a deadline driving the sale (1031 exchange, divorce, estate, relocation)? That informs how much negotiation room exists.
- Schools are B-rated — typically a magnet for longer-tenancy family renters. What's the average tenant stay here, and is there a school-zone premium baked into asking?
- Crime grade is F in this area — have there been break-ins, vandalism, or insurance claims at this property in the last 3 years? What carrier currently insures it and at what premium?
- What's the average days-on-market for RENTAL listings here right now (not sales)? A rising rental-DOM trend means longer vacancies and softer asking-rent achievability than the comps imply.
- What's the recent tenant-quality profile in this submarket — average credit score on applications, eviction rate, late-payment / NSF rate, and stable-employment percentage? A property-management company in the area should have these aggregated.
- How much new for-sale + rental construction is in the pipeline within 1–3 miles? Heavy new supply typically softens prices + rents 12–24 months out; constrained supply supports both.
Investment metrics
- 1% rule
- 3.92% ✓
- Cap rate
- 35.85%
- Cash-on-cash
- 105.55%
- DSCR
- 5.70
- GRM
- 2.1
CMA / ARV
- ARV (on-the-fly)
- $74,880
- Comps found
- 2
Show comp detail 2 sales within ~0.75 mi
| Address | Dist | Beds/Ba | Sqft | Sold | Price | $/sf | Match |
|---|---|---|---|---|---|---|---|
| 2500 Samish Way #44 | 0.05mi | 2/1.0 | 576 (0%) | 9mo | $75,000 | $130 | 90 |
| 2500 Samish Way #62 | 0.04mi | 2/1.0 | 644 (+12%) | 16mo | $65,000 | $101 | 66 |
Match score weights: distance 35% · size 25% · config 20% · recency 20%. Top-matched comps best support the ARV.
Projected returns pro-forma
-3.0% appreciation · 3.38% rent growth · sell at horizon
- IRR
- —
- Equity multiple
- 6.08×
- Total profit
- $76,637
- Equity at exit
- $8,037
- IRR
- —
- Equity multiple
- 12.86×
- Total profit
- $179,003
- Equity at exit
- $4,660
Cash invested: $15,092 (down + closing). Projections, not guarantees.
Landlord ↔ Tenant lean methodology
- Overall (STATE)
- 28 Tenant-Leaning
- State Washington
- 28 Tenant-Leaning · D+8
- County
- — inherits STATE
- City
- — inherits STATE
ZIP-level market 98229
- Rents YoY
- 3.4%
- Active inventory
- 275
- Price-to-rent
- 2.1×
Monthly cashflow live
- Estimated rent
- $2,111 medium interval (Pro) →
- Mortgage (P&I)
- −$283
- Tax from tax record
- −$35 /mo · $417/yr
- Insurance
- −$22
- HOA
- −$0
- Vacancy / Maint / Mgmt
- −$443
- Net cashflow
- $1,328
Break-even live
Sensitivity live
| Price | -10% $1,358 | -5% $1,343 | +0% $1,328 | +5% $1,312 | +10% $1,297 |
|---|---|---|---|---|---|
| Rent | -10% $1,161 | -5% $1,244 | +0% $1,328 | +5% $1,411 | +10% $1,494 |
| Rate | -1.0pp $1,355 | -0.5pp $1,341 | base $1,328 | +0.5pp $1,314 | +1.0pp $1,299 |
UW: 25.0% down · 7.5% · 30yr · 1.5% tax · 5.0% vac · 8.0% maint · 8.0% mgmt
Financing live
Cash to close
- Down payment
- $13,475
- Closing costs
- $1,617
- Reserves months
- —
- Total cash needed
- —
Loan-product check · same deal, 3 products live
Conventional
25% down · 7.5% · 30yr
- Down + closing
- —
- Monthly P&I
- —
- Monthly cashflow
- —
- DSCR
- —
- Eligible?
- —
Personal DTI + credit; lowest rate.
DSCR
20% down · 8.5% · 30yr
- Down + closing
- —
- Monthly P&I
- —
- Monthly cashflow
- —
- DSCR
- —
- Eligible?
- —
No personal income docs; deal must DSCR.
Hard money
10% down · 12.0% · 12mo
- Down + closing
- —
- Monthly P&I
- —
- Monthly cashflow
- —
- DSCR
- —
- Eligible?
- —
Short-term bridge; refi at stabilization.
Rent comps 4 comps
| Address | Beds | Baths | Sqft | Rent | $/sqft | DOM | Units | Dist |
|---|---|---|---|---|---|---|---|---|
| 3129 Old Fairhaven Pkwy Bellingham, WA | 2.0 | 1.0 | 711 | $2,310 | $3.25 | 14d | 2 | 0.69mi |
| 705 32nd St Bellingham, WA | 3.0 | 1.0–2.0 | 792 | $2,095 | $2.65 | 22d | 23 | 1.33mi |
| 517 32nd St Bellingham, WA | 1.0 | 1.0 | 410 | $1,367 | $3.33 | 22d | 4 | 1.46mi |
| 2305 Douglas Ave Bellingham, WA | 1.0–4.0 | 1.0–4.0 | 1089 | $2,222 | $2.04 | 14d | 16 | 1.50mi |
Listing history 1 events
-
2026-01-18$53,900 Active
ⓘ Source: listings_history table (triggers on properties + properties_extension) + one-shot
backfill from property_details.listing_events for pre-trigger history.
Tax reassessment forecast WA · Resets to sale price
- Current annual tax
- $417 · $35/mo
- Projected year-2 tax
- $528 · $44/mo
- Expected delta
- +$112/yr (+$9/mo · 26.8%)
ⓘ Screening estimate from a state-policy table — verify with the county assessor before closing.
Climate risk First Street
- Flood 1/10 Low FEMA zone X (unshaded) · 0% chance over 30 yrs
- Wildfire 1/10 Low
- Heat 1/10 Low 7 d/yr ≥83°F today · 17 d/yr by 30 yrs out
- Wind 1/10 Low
- Air quality 6/10 Major 9 unhealthy d/yr today · 10 by 30 yrs out
Nearby sold comps map
Loading sold comps map…
Walkable amenities ~0.75 mi
Loading nearby amenities…
Taxation est. · year 1
- Rental income
- $25,327
- − Mortgage interest
- −$3,019
- − Property taxes
- −$417
- − Insurance
- −$270
- − Repairs & maintenance
- −$2,026
- − Management
- −$2,026
- − Depreciation
- −$1,568
- Taxable income
- $16,001
- Est. tax owed @ 24.0%
- −$3,840
- After-tax cash flow
- $12,090/yr
For passive investors: Depreciation is non-cash, so a rental often shows a tax loss while cash-flowing — sheltering income. Rental losses are passive: they offset passive income freely, and up to $25,000/yr can offset ordinary (W-2) income if you actively participate and your MAGI is under $100k (phasing out to $0 by $150k); unused losses carry forward. On sale, claimed depreciation is recaptured at up to 25%, and gains may owe capital-gains tax (a 1031 exchange can defer both). Figures are a year-1 estimate at your 24.0% rate — not tax advice; consult a CPA.
Schools (NCES district)
- District
- Bellingham School District
- NCES district ID
- 5300420
- Math proficiency
- 47% ▼ -6.00%
- Reading proficiency
- 63% ▼ -1.00%
- Median HH income
- $47,678
- Composite
- 48.49/100
- National rank
- #4632
- State rank
- #106 of 291 in WA
Livability — Bellingham
- Score
- 80/100
- State rank
- #102
- US rank
- #1947
Category grades
Schools grade is shown separately in the Schools card above.
Census & demographics
- Census place
- Bellingham, WA
- County
- Whatcom County · 209,776 people
- City population
- 130,296
- Metro
- Bellingham, WA
- Population (ZIP)
- 33,298
- Household income
- $90,945
- Rent vs Own
- Severe rent burden
- 1040.0
Population outlook (Whatcom County) Hauer SSP2
- Today (2025)
- 240,408 people
- By 2030
- 254,667 · +5.9%
- By 2040
- 281,365 · +17.0%
- By 2050
- 307,592 · +27.9%
- By 2075
- 375,576 · +56.2%
- By 2100
- 421,637 · +75.4%
Race, ethnicity, and origin ACS 2023
- Neighborhood character
- Predominantly White (77%)
- Race & ethnicity
- White 77% Two or more races 13% Hispanic / Latino 10% Asian 3%
- Hispanic origin (detail)
- Mexican 8%
- Common ancestry
- Portuguese 6% Italian 4% Slovak 4%
- Foreign-born
- 8% · Canada, China, Vietnam
- Languages at home
- 88% English-only · Spanish 7% Chinese 1% German/W. Germanic 1%
Political lean MEDSL · Whatcom
- 2024 margin
- Strong D (+24.9) · D 60.8% · R 35.9% · Other 3.3%
- 2008→2024 swing
- +6.9pp toward D · 2008: 18.0pp · 2024: 24.9pp
- All cycles
- 2024: D+24.9 2020: D+23.9 2016: D+17.7 2012: D+12.1 2008: D+18.0
Not yet ingested
- Civics
- —
Market trends
- HPI YoY
- ▼ -652.00%
- Current HPI
- 413.1478
- Rent YoY
- ▲ 3.38%
- Metro
- Bellingham, WA
- State GDP YoY
- ▲ 4.65%
- F500 in state
- 22
Industry mix (Fortune 500 HQ in WA)
| Industry | F500 HQs | Revenue |
|---|---|---|
| Retail | 2 | $269B |
|
||
| Technology / Retail | 1 | $638B |
|
||
| Technology | 1 | $245B |
|
||
| Telecommunications | 1 | $38B |
|
||
| Food / Beverage | 1 | $36B |
|
||
| Automotive / Trucks | 1 | $34B |
|
||
Price history
1 event — show timeline
- 2026-01-18 Listed $53,900 NWMLS as Distributed by MLS Grid
Property tax history
+55.2%/yrLatest (2026): $417 · +718.2% YoY. Source: county tax records.
Cash-flow waterfall
monthlySold comps — $/sqft
last 12 mo · ≤1 miLoading sold comps…