4 Victory Ln · Goreville, IL
Flood risk 6/10 · Moderate
- FEMA flood zone
- X (unshaded)
- Chance of flooding over 30 yrs
- 0.7%
- Est. flood insurance / yr
- $473 – $860
Fire risk 3/10 · Minor
- Est. fire insurance / yr
- $804 – $1,492
Heat risk 4/10 · Minor
- Hot days now (above 108°F)
- 7 days/yr
- Hot days in 30 yrs
- 20 days/yr
Wind risk 2/10 · Minimal
- Chance of severe wind over 30 yrs
- 3.0%
Air-quality risk 2/10 · Minimal
- Unhealthy air days now
- 1 days/yr
- Unhealthy air days in 30 yrs
- 2 days/yr
Risk factors via First Street. Map © Google.
Why this score? — see what drove the D grade
The composite is a weighted blend of 9 inputs, each scored 0–100. Each bar is that input's sub-score; the figure is the points it added to the 100-point composite (weight × sub-score).
- Cash flow +14.0/30.0
- ARV discount +7.5/15.0
- Rent growth +4.6/5.0
- DSCR +4.2/10.0
- 1% rule +3.9/10.0
- Livability +3.6/5.0
- Schools +2.2/10.0
- Condition / age +1.0/5.0
- Appreciation +0.0/10.0
$105,000
🖨 Deal sheet 📄 Offer letter ✓ Due diligence
Listing remarks MLS
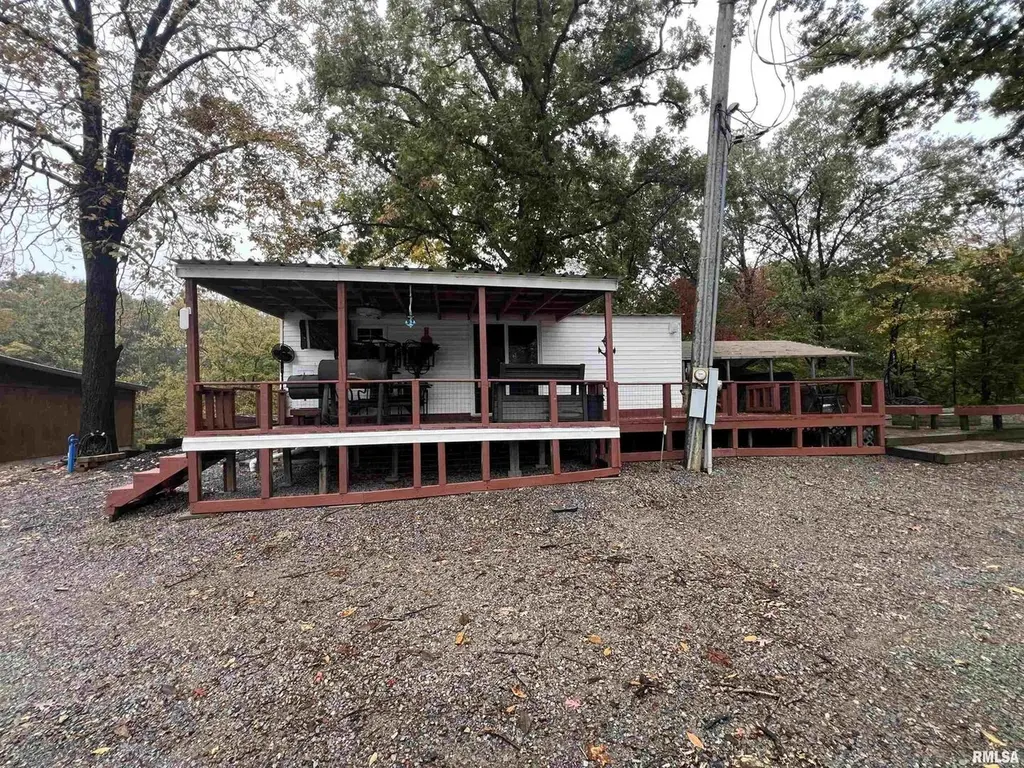
Looking for your weekend spot on the LAKE OF EGYPT? This property is located in Pyramid Acres Campground. It has a 36' Camper with a 12' x 30' addition built on. 2 Bedrooms, 1 Bath with built on deck, a Double Carport as well as a stone patio with a firepit. Also includes a 1 slip covered boat dock with electric at the dock along with a jet ski dock attached. Comes furnished, includes Lawnmower and Golf Cart. Come enjoy Lake Living at this turn key property!!! This is being sold as personal property, the land is leased for $4000 a year that covers real estate taxes, water, sewer and trash.
Key facts
- Firepit
- Double carport
- 36' camper
Tags
Neighborhood map
What this means for you Summary
Snapshot
- This is a 2-bed/1.0-bath single-family listed at $105k. Condition is rated poor.
Deal economics
- At list price, monthly cash flow is $14 ($162/yr) — positive.
- The deal already cash-flows at list — no discount required.
- To meet the 1% rule (rent ≥ 1% of price), the offer needs to be $94k (10.9% below list).
- Recommended offer: $92k (12.0% below list) — sets the bar for market timing.
- Cap rate 6.4% vs local median 1.3% in Goreville — top-decile yield for the area; either an underpriced asset or a hidden risk that comps aren't pricing in. Stress-test before assuming the spread holds.
Location & tenants
- Location reads 72/100 on livability (#298 in IL) — a middle-class / working-renter tenant base. Strengths: crime A+, cost of living A+, housing A+; Watch: schools D+, amenities F, commute F.
- Marion CUSD 2 (urban): math 20% / reading 31% proficiency, ranked #317 of 620 in IL (top 51%) — low school quality limits family demand, transient renter base, plan for 1-2y turnover.
- Market conditions: Rents rising fast (+8.4%/yr); 226 active listings in the ZIP; 130 units permitted in Williamson County in 2024 (5 in 5+ unit buildings).
- This rent is only 16% of the median local income ($71k/yr) — well below the 30% rent-burden line; pricing power to push rent on renewal without tenant pushback.
Forward outlook
- Local home prices are declining (-3.0%/yr); year-one equity from $726 of loan paydown is wiped out by about $3k of value loss. Plan a longer hold.
Negotiation context
- It's been on market 184 days — a 12% lower offer ($92k) is reasonable based on typical stale-listing flexibility.
Risks & watch-outs
- Climate carrying-cost: major flood risk — expect insurance premiums to compound above CPI over the hold.
Questions for the listing agent
- It's been on market 184 days. Have you received any prior offers? Is the seller open to a 12% concession, seller financing, or rate buy-down credit?
- Have any recent inspections been done? Can we get a copy of the seller's disclosures and any deferred-maintenance estimates?
- Why hasn't it sold? Are there any deal-killer items the seller is aware of (foundation, flood, title, zoning, code violations)?
- Is there a deadline driving the sale (1031 exchange, divorce, estate, relocation)? That informs how much negotiation room exists.
- Schools are D-rated, which usually means shorter tenancies and higher turnover. Who's the typical renter profile here, and what's been the actual vacancy rate?
- The area grade is low — what's the realistic commute time and amenity access for the typical tenant pool here? Any planned neighborhood developments (good or bad) we should know about?
- What's the average days-on-market for RENTAL listings here right now (not sales)? A rising rental-DOM trend means longer vacancies and softer asking-rent achievability than the comps imply.
- What's the recent tenant-quality profile in this submarket — average credit score on applications, eviction rate, late-payment / NSF rate, and stable-employment percentage? A property-management company in the area should have these aggregated.
- How much new for-sale + rental construction is in the pipeline within 1–3 miles? Heavy new supply typically softens prices + rents 12–24 months out; constrained supply supports both.
Investment metrics
- 1% rule
- 0.89% ✗
- Cap rate
- 6.45%
- Cash-on-cash
- 0.55%
- DSCR
- 1.02
- GRM
- 9.4
CMA / ARV
- ARV (median comp)
- $336,429
- List price
- $105,000
- Delta
- -68.79%
- Verdict
- UNDERPRICED
- Comps
- 2 within 2.0 mi
Projected returns pro-forma
-3.0% appreciation · 8.0% rent growth · sell at horizon
- IRR
- -9.9%
- Equity multiple
- 0.62×
- Total profit
- $-11,193
- Equity at exit
- $15,656
- IRR
- 5.2%
- Equity multiple
- 1.47×
- Total profit
- $13,926
- Equity at exit
- $9,078
Cash invested: $29,400 (down + closing). Projections, not guarantees.
Landlord ↔ Tenant lean methodology
- Overall (STATE)
- 43 Moderately Tenant-Leaning
- State Illinois
- 43 Moderately Tenant-Leaning · D+7
- County
- — inherits STATE
- City
- — inherits STATE
ZIP-level market 62959
- Rents YoY
- 8.4%
- Active inventory
- 226
- Price-to-rent
- 9.4×
Monthly cashflow live
- Estimated rent
- $936 medium interval (Pro) →
- Mortgage (P&I)
- −$551
- Tax est. 1.5%
- −$131 /mo · $1,575/yr
- Insurance
- −$44
- HOA
- −$0
- Vacancy / Maint / Mgmt
- −$196
- Net cashflow
- $14
Break-even live
UW: 25.0% down · 7.5% · 30yr · 1.5% tax · 5.0% vac · 8.0% maint · 8.0% mgmt
Financing live
Cash to close
- Down payment
- $26,250
- Closing costs
- $3,150
- Reserves months
- —
- Total cash needed
- —
Loan-product check · same deal, 3 products live
Conventional
25% down · 7.5% · 30yr
- Down + closing
- —
- Monthly P&I
- —
- Monthly cashflow
- —
- DSCR
- —
- Eligible?
- —
Personal DTI + credit; lowest rate.
DSCR
20% down · 8.5% · 30yr
- Down + closing
- —
- Monthly P&I
- —
- Monthly cashflow
- —
- DSCR
- —
- Eligible?
- —
No personal income docs; deal must DSCR.
Hard money
10% down · 12.0% · 12mo
- Down + closing
- —
- Monthly P&I
- —
- Monthly cashflow
- —
- DSCR
- —
- Eligible?
- —
Short-term bridge; refi at stabilization.
Listing history 21 events
-
2026-06-19days on market $105,000 Active 184 DOM
-
2026-06-18days on market $105,000 Active 183 DOM
-
2026-06-17days on market $105,000 Active 182 DOM
-
2026-06-16days on market $105,000 Active 181 DOM
-
2026-06-15days on market $105,000 Active 180 DOM
-
2026-06-14days on market $105,000 Active 178 DOM
-
2026-06-13days on market $105,000 Active 177 DOM
-
2026-06-10days on market $105,000 Active 175 DOM
-
2026-06-09days on market $105,000 Active 174 DOM
-
2026-06-09days on market $105,000 Active 173 DOM
-
2026-06-07days on market $105,000 Active 172 DOM
-
2026-06-05days on market $105,000 Active 169 DOM
-
2026-06-03days on market $105,000 Active 168 DOM
-
2026-06-02days on market $105,000 Active 167 DOM
-
2026-06-01days on market $105,000 Active 166 DOM
-
2026-05-31days on market $105,000 Active 165 DOM
-
2026-05-30days on market $105,000 Active 164 DOM
-
2026-01-06historical 596-char remark
Show marketing remark (596 chars)
Looking for your weekend spot on the LAKE OF EGYPT? This property is located in Pyramid Acres Campground. It has a 36' Camper with a 12' x 30' addition built on. 2 Bedrooms, 1 Bath with built on deck, a Double Carport as well as a stone patio with a firepit. Also includes a 1 slip covered boat dock with electric at the dock along with a jet ski dock attached. Comes furnished, includes Lawnmower and Golf Cart. Come enjoy Lake Living at this turn key property!!! This is being sold as personal property, the land is leased for $4000 a year that covers real estate taxes, water, sewer and trash.
-
2025-10-27Active 596-char remark
Show marketing remark (596 chars)
Looking for your weekend spot on the LAKE OF EGYPT? This property is located in Pyramid Acres Campground. It has a 36' Camper with a 12' x 30' addition built on. 2 Bedrooms, 1 Bath with built on deck, a Double Carport as well as a stone patio with a firepit. Also includes a 1 slip covered boat dock with electric at the dock along with a jet ski dock attached. Comes furnished, includes Lawnmower and Golf Cart. Come enjoy Lake Living at this turn key property!!! This is being sold as personal property, the land is leased for $4000 a year that covers real estate taxes, water, sewer and trash.
-
2021-08-06historical
-
2020-01-03historical
ⓘ Source: listings_history table (triggers on properties + properties_extension) + one-shot
backfill from property_details.listing_events for pre-trigger history.
Climate risk First Street
- Flood 6/10 Major FEMA zone X (unshaded) · 70% chance over 30 yrs
- Wildfire 3/10 Moderate
- Heat 4/10 Moderate 7 d/yr ≥108°F today · 20 d/yr by 30 yrs out
- Wind 2/10 Low 3% chance of damaging wind over 30 yrs
- Air quality 2/10 Low 1 unhealthy d/yr today · 2 by 30 yrs out
Nearby sold comps map
Loading sold comps map…
Walkable amenities ~0.75 mi
Loading nearby amenities…
Taxation est. · year 1
- Rental income
- $11,228
- − Mortgage interest
- −$5,882
- − Property taxes
- −$1,575
- − Insurance
- −$525
- − Repairs & maintenance
- −$898
- − Management
- −$898
- − Depreciation
- −$3,055
- Taxable loss
- −$1,605
- Est. tax savings @ 24.0%
- +$385
- After-tax cash flow
- $548/yr
For passive investors: Depreciation is non-cash, so a rental often shows a tax loss while cash-flowing — sheltering income. Rental losses are passive: they offset passive income freely, and up to $25,000/yr can offset ordinary (W-2) income if you actively participate and your MAGI is under $100k (phasing out to $0 by $150k); unused losses carry forward. On sale, claimed depreciation is recaptured at up to 25%, and gains may owe capital-gains tax (a 1031 exchange can defer both). Figures are a year-1 estimate at your 24.0% rate — not tax advice; consult a CPA.
Condition & rehab AI · 1 photo
This property requires extensive repairs and maintenance, including exterior siding and roof repair, interior painting, and landscaping improvements. Significant investment is needed to bring it up to a livable condition.
Repairs flagged
- Major siding — Exposed framing and weathered condition
- Major roof — Missing shingles and visible damage
- Major flooring — Worn and uneven condition
- Major interior walls/paint — Peeling paint and visible damage
Value-add opportunities
- Both exterior siding and roof repair — Improves curb appeal and structural integrity
- Both interior painting and repairs — Enhances interior aesthetics and value
- Both landscaping and curb appeal improvements — Enhances overall property appearance
Renovation cost estimate screening
| Repair item | Severity | Est. cost |
|---|---|---|
| siding · Exposed framing and weathered condition | Major | $15,000–50,000 |
| roof · Missing shingles and visible damage | Major | $15,000–50,000 |
| flooring · Worn and uneven condition | Major | $15,000–50,000 |
| interior walls/paint · Peeling paint and visible damage | Major | $15,000–50,000 |
| Total estimated repair cost · 4 items | $60,000–200,000 |
Value-add ROI direction
- Both exterior siding and roof repair — Improves curb appeal and structural integrity ↑
- Both interior painting and repairs — Enhances interior aesthetics and value ↑
- Both landscaping and curb appeal improvements — Enhances overall property appearance ↑
ⓘ Cost ranges are severity-bucket heuristics (US national rule-of-thumb). Get contractor quotes + a written scope before underwriting a rehab budget.
Schools (NCES district)
- District
- Marion CUSD 2
- NCES district ID
- 1724600
- Math proficiency
- 20% ▼ -11.00%
- Reading proficiency
- 31% ▼ -11.00%
- Median HH income
- $46,221
- Composite
- 22.07/100
- National rank
- #8189
- State rank
- #317 of 620 in IL
Livability — Goreville
- Score
- 72/100
- State rank
- #298
- US rank
- #5712
Category grades
Schools grade is shown separately in the Schools card above.
Census & demographics
- County
- Williamson County · 38,451 people
- City population
- 3,072
- Metro
- Carbondale-Marion, IL
- Population (ZIP)
- 27,793
- Household income
- $71,063
- Rent vs Own
- Severe rent burden
- 763.0
Population outlook (Williamson County) Hauer SSP2
- Today (2025)
- 69,553 people
- By 2030
- 70,090 · +0.8%
- By 2040
- 70,345 · +1.1%
- By 2050
- 69,394 · -0.2%
- By 2075
- 63,590 · -8.6%
- By 2100
- 51,154 · -26.5%
Race, ethnicity, and origin ACS 2023
- Neighborhood character
- Predominantly White (87%)
- Race & ethnicity
- White 87% Black 5% Two or more races 4% Hispanic / Latino 3% Asian 2%
- Common ancestry
- Lithuanian 2% Italian 2% Slovak 1%
- Foreign-born
- 2% · Canada
- Languages at home
- 97% English-only · Spanish 1% Other Asian/Pacific 1% Other Indo-European 1%
Political lean MEDSL · Williamson
- 2024 margin
- Solid R (+38.8) · D 30.0% · R 68.8% · Other 1.3%
- 2008→2024 swing
- -24.0pp toward R · 2008: -14.8pp · 2024: -38.8pp
- All cycles
- 2024: R+38.8 2020: R+37.3 2016: R+41.2 2012: R+25.0 2008: R+14.8
Not yet ingested
- Civics
- —
Market trends
- HPI YoY
- ▼ -76.41%
- Current HPI
- 137.5955
- Rent YoY
- ▲ 8.40%
- Metro
- Carbondale-Marion, IL
- State GDP YoY
- ▲ 1.59%
- F500 in state
- 60
Industry mix (Fortune 500 HQ in IL)
| Industry | F500 HQs | Revenue |
|---|---|---|
| Insurance | 4 | $201B |
|
||
| Consumer Goods | 4 | $87B |
|
||
| Industrial Machinery | 3 | $64B |
|
||
| Healthcare | 2 | $55B |
|
||
| Retail / Pharmacy | 1 | $148B |
|
||
| Agriculture / Food | 1 | $86B |
|
||
Cash-flow waterfall
monthlySold comps — $/sqft
last 12 mo · ≤1 miLoading sold comps…