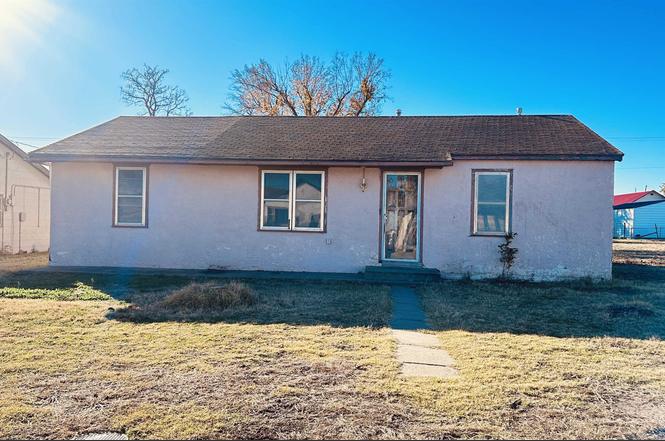
405 NW 2nd · Laverne, OK
Flood risk 1/10 · Minimal
- FEMA flood zone
- —
- Chance of flooding over 30 yrs
- 0.0%
- Est. flood insurance / yr
- —
Fire risk 8/10 · Major
- Est. fire insurance / yr
- $2,463 – $4,575
Heat risk 5/10 · Moderate
- Hot days now (above 105°F)
- 7 days/yr
- Hot days in 30 yrs
- 19 days/yr
Wind risk 2/10 · Minimal
- Chance of severe wind over 30 yrs
- —
Air-quality risk 2/10 · Minimal
- Unhealthy air days now
- 1 days/yr
- Unhealthy air days in 30 yrs
- 1 days/yr
Risk factors via First Street. Map © Google.
Why this score? — see what drove the A- grade
The composite is a weighted blend of 9 inputs, each scored 0–100. Each bar is that input's sub-score; the figure is the points it added to the 100-point composite (weight × sub-score).
- Cash flow +30.0/30.0
- ARV discount +15.0/15.0
- DSCR +10.0/10.0
- 1% rule +9.1/10.0
- Appreciation +8.8/10.0
- Schools +3.6/10.0
- Livability +3.3/5.0
- Rent growth +2.5/5.0
- Condition / age +2.5/5.0
$75,000
🖨 Deal sheet 📄 Offer letter ✓ Due diligence
Key facts
- Built 1960
- Listed 420 days
Property features AI
Exterior
- Utilities: Public water; Public sewer
- Home design: Single-family residence; Single-story home; Facing north
- Construction: Stucco exterior
- Exterior features: Composition roof
Interior
- Flooring: Hardwood
- Bathrooms: 2 full bathrooms
- Heating & cooling: Central heating (Natural Gas); Central air conditioning
- Interior features: Hardwood floors
Neighborhood map
What this means for you Summary
Snapshot
- This is a 2-bed/2.0-bath single-family listed at $75k.
Deal economics
- At list price, monthly cash flow is $316 ($4k/yr) — positive.
- The deal already cash-flows at list — no discount required.
- Meets the 1% rule at list price ($1k rent vs $75k).
- Recommended offer: $66k (12.0% below list) — sets the bar for market timing.
Location & tenants
- Location reads 66/100 on livability (#108 in OK) — a middle-class / working-renter tenant base. Strengths: crime A+, cost of living A+, housing A+; Watch: health & safety C-, employment D, schools D-.
- Laverne (rural): math 45% / reading 39% proficiency, ranked #10 of 270 in OK (top 4%) — families likely to look elsewhere, expect single-tenant / working-renter base with shorter leases.
- Market conditions: 5 active listings in the ZIP.
Forward outlook
- In year one you build about $6k of equity ($519 loan paydown + $6k appreciation (7.6% local appreciation)).
- Harper County population projected at +28% by 2050 — long-run rental-demand tailwind backs the buy-and-hold thesis.
- At projected returns (7.6% appreciation + 3.0% rent growth), your $21k cash investment doubles in ~3 years — after that, you're playing with house money.
- By year 6, paydown + projected appreciation supports a ~$35k cash-out refi (75% LTV) — recoverable capital for the next deal without selling this one.
Negotiation context
- It's been on market 421 days — a 12% lower offer ($66k) is reasonable based on typical stale-listing flexibility.
Risks & watch-outs
- Climate carrying-cost: severe wildfire risk; extreme-heat days projected 7→19/yr by 2055 (HVAC capex compounding) — expect insurance premiums to compound above CPI over the hold.
Questions for the listing agent
- It's been on market 421 days. Have you received any prior offers? Is the seller open to a 12% concession, seller financing, or rate buy-down credit?
- Built in 1960 — when were the roof, HVAC, electrical panel, plumbing, and water heater last replaced?
- Why hasn't it sold? Are there any deal-killer items the seller is aware of (foundation, flood, title, zoning, code violations)?
- Is there a deadline driving the sale (1031 exchange, divorce, estate, relocation)? That informs how much negotiation room exists.
- Schools are D-rated, which usually means shorter tenancies and higher turnover. Who's the typical renter profile here, and what's been the actual vacancy rate?
- What's the average days-on-market for RENTAL listings here right now (not sales)? A rising rental-DOM trend means longer vacancies and softer asking-rent achievability than the comps imply.
- What's the recent tenant-quality profile in this submarket — average credit score on applications, eviction rate, late-payment / NSF rate, and stable-employment percentage? A property-management company in the area should have these aggregated.
- How much new for-sale + rental construction is in the pipeline within 1–3 miles? Heavy new supply typically softens prices + rents 12–24 months out; constrained supply supports both.
Investment metrics
- 1% rule
- 1.41% ✓
- Cap rate
- 11.35%
- Cash-on-cash
- 18.06%
- DSCR
- 1.80
- GRM
- 5.9
CMA / ARV
- ARV (on-the-fly)
- $104,112
- Comps found
- 3
Show comp detail 3 sales within ~0.75 mi
| Address | Dist | Beds/Ba | Sqft | Sold | Price | $/sf | Match |
|---|---|---|---|---|---|---|---|
| 523 NW 2nd | 0.12mi | 3/2.0 (+1) | 1,432 (-1%) | 14mo | $110,000 | $77 | 76 |
| 718 Klinger St | 0.35mi | 3/1.0 (+1) | 1,392 (-4%) | 16mo | $89,500 | $64 | 55 |
| 302 S Broadway | 0.36mi | 3/1.0 (+1) | 1,258 (-13%) | 12mo | $90,000 | $72 | 43 |
Match score weights: distance 35% · size 25% · config 20% · recency 20%. Top-matched comps best support the ARV.
Projected returns pro-forma
7.63% appreciation · 3.0% rent growth · sell at horizon
- IRR
- 33.5%
- Equity multiple
- 3.35×
- Total profit
- $49,269
- Equity at exit
- $55,091
- IRR
- 30.1%
- Equity multiple
- 7.10×
- Total profit
- $128,000
- Equity at exit
- $107,603
Cash invested: $21,000 (down + closing). Projections, not guarantees.
Landlord ↔ Tenant lean methodology
- Overall (STATE)
- 83 Strongly Landlord-Friendly
- State Oklahoma
- 83 Strongly Landlord-Friendly · R+20
- County
- — inherits STATE
- City
- — inherits STATE
ZIP-level market 73848
- Home prices YoY
- 4.7%
- Active inventory
- 5
- Price-to-rent
- 5.9×
Monthly cashflow live
- Estimated rent
- $1,056 medium interval (Pro) →
- Mortgage (P&I)
- −$393
- Tax est. 1.5%
- −$94 /mo · $1,125/yr
- Insurance
- −$31
- HOA
- −$0
- Vacancy / Maint / Mgmt
- −$222
- Net cashflow
- $316
Break-even live
UW: 25.0% down · 7.5% · 30yr · 1.5% tax · 5.0% vac · 8.0% maint · 8.0% mgmt
Financing live
Cash to close
- Down payment
- $18,750
- Closing costs
- $2,250
- Reserves months
- —
- Total cash needed
- —
Loan-product check · same deal, 3 products live
Conventional
25% down · 7.5% · 30yr
- Down + closing
- —
- Monthly P&I
- —
- Monthly cashflow
- —
- DSCR
- —
- Eligible?
- —
Personal DTI + credit; lowest rate.
DSCR
20% down · 8.5% · 30yr
- Down + closing
- —
- Monthly P&I
- —
- Monthly cashflow
- —
- DSCR
- —
- Eligible?
- —
No personal income docs; deal must DSCR.
Hard money
10% down · 12.0% · 12mo
- Down + closing
- —
- Monthly P&I
- —
- Monthly cashflow
- —
- DSCR
- —
- Eligible?
- —
Short-term bridge; refi at stabilization.
Listing history 19 events
-
2026-06-18days on market $75,000 Active 421 DOM
-
2026-06-17days on market $75,000 Active 420 DOM
-
2026-06-16days on market $75,000 Active 419 DOM
-
2026-06-15days on market $75,000 Active 418 DOM
-
2026-06-13days on market $75,000 Active 416 DOM
-
2026-06-12days on market $75,000 Active 415 DOM
-
2026-06-09days on market $75,000 Active 412 DOM
-
2026-06-08days on market $75,000 Active 411 DOM
-
2026-06-08days on market $75,000 Active 410 DOM
-
2026-06-05days on market $75,000 Active 408 DOM
-
2026-06-04days on market $75,000 Active 406 DOM
-
2026-06-02days on market $75,000 Active 405 DOM
-
2026-06-01days on market $75,000 Active 404 DOM
-
2026-05-31days on market $75,000 Active 403 DOM
-
2026-04-17price $75,000
-
2026-01-12price $85,000
-
2025-04-24price $95,000
-
2025-04-23$90,000 Active
-
2025-02-20price $95,000
ⓘ Source: listings_history table (triggers on properties + properties_extension) + one-shot
backfill from property_details.listing_events for pre-trigger history.
Climate risk First Street
- Flood 1/10 Low 0% chance over 30 yrs
- Wildfire 8/10 Severe
- Heat 5/10 Major 7 d/yr ≥105°F today · 19 d/yr by 30 yrs out
- Wind 2/10 Low
- Air quality 2/10 Low 1 unhealthy d/yr today · 1 by 30 yrs out
Nearby sold comps map
Loading sold comps map…
Walkable amenities ~0.75 mi
Loading nearby amenities…
Taxation est. · year 1
- Rental income
- $12,674
- − Mortgage interest
- −$4,201
- − Property taxes
- −$1,125
- − Insurance
- −$375
- − Repairs & maintenance
- −$1,014
- − Management
- −$1,014
- − Depreciation
- −$2,182
- Taxable income
- $2,764
- Est. tax owed @ 24.0%
- −$663
- After-tax cash flow
- $3,130/yr
For passive investors: Depreciation is non-cash, so a rental often shows a tax loss while cash-flowing — sheltering income. Rental losses are passive: they offset passive income freely, and up to $25,000/yr can offset ordinary (W-2) income if you actively participate and your MAGI is under $100k (phasing out to $0 by $150k); unused losses carry forward. On sale, claimed depreciation is recaptured at up to 25%, and gains may owe capital-gains tax (a 1031 exchange can defer both). Figures are a year-1 estimate at your 24.0% rate — not tax advice; consult a CPA.
Schools (NCES district)
- District
- Laverne
- NCES district ID
- 4017220
- Math proficiency
- 45% ▼ -11.00%
- Reading proficiency
- 39% ▼ -3.00%
- Median HH income
- $47,426
- Composite
- 35.94/100
- National rank
- #4801
- State rank
- #10 of 270 in OK
Livability — Laverne
- Score
- 66/100
- State rank
- #108
- US rank
- #11536
Category grades
Schools grade is shown separately in the Schools card above.
Census & demographics
- Census place
- Laverne, OK
- Population (ZIP)
- 1,609
Population outlook (Harper County) Hauer SSP2
- Today (2025)
- 4,023 people
- By 2030
- 4,159 · +3.4%
- By 2040
- 4,566 · +13.5%
- By 2050
- 5,146 · +27.9%
- By 2075
- 7,497 · +86.4%
- By 2100
- 10,727 · +166.6%
Race, ethnicity, and origin ACS 2023
- Neighborhood character
- Predominantly White (67%)
- Race & ethnicity
- White 67% Hispanic / Latino 30% Two or more races 5%
- Hispanic origin (detail)
- Mexican 25%
- Common ancestry
- Slovak 4% Lithuanian 2% Subsaharan African 1%
- Foreign-born
- 23% · Canada
- Languages at home
- 68% English-only · Spanish 29% German/W. Germanic 2%
Political lean MEDSL · Harper
- 2024 margin
- Solid R (+78.4) · D 10.1% · R 88.5% · Other 1.4%
- 2008→2024 swing
- -6.6pp toward R · 2008: -71.7pp · 2024: -78.4pp
- All cycles
- 2024: R+78.4 2020: R+80.1 2016: R+79.2 2012: R+75.9 2008: R+71.7
Not yet ingested
- Civics
- —
Market trends
- HPI YoY
- ▲ 7.63%
- Current HPI
- 170.0605
- Rent YoY
- —
- Metro
- —
- State GDP YoY
- ▲ 1.55%
- F500 in state
- 6
Industry mix (Fortune 500 HQ in OK)
| Industry | F500 HQs | Revenue |
|---|---|---|
| Energy | 3 | $48B |
|
||
Price history
-21.1% since first listed5 events — show timeline
- 2026-04-17 Price Changed $75,000 NWOAR
- 2026-01-12 Price Changed $85,000 NWOAR
- 2025-04-24 Price Changed $95,000 NWOAR
- 2025-04-23 Listed $90,000 NWOAR
- 2025-02-20 Price Changed $95,000 NWOAR
Cash-flow waterfall
monthlySold comps — $/sqft
last 12 mo · ≤1 miLoading sold comps…