 🏢 Co-op
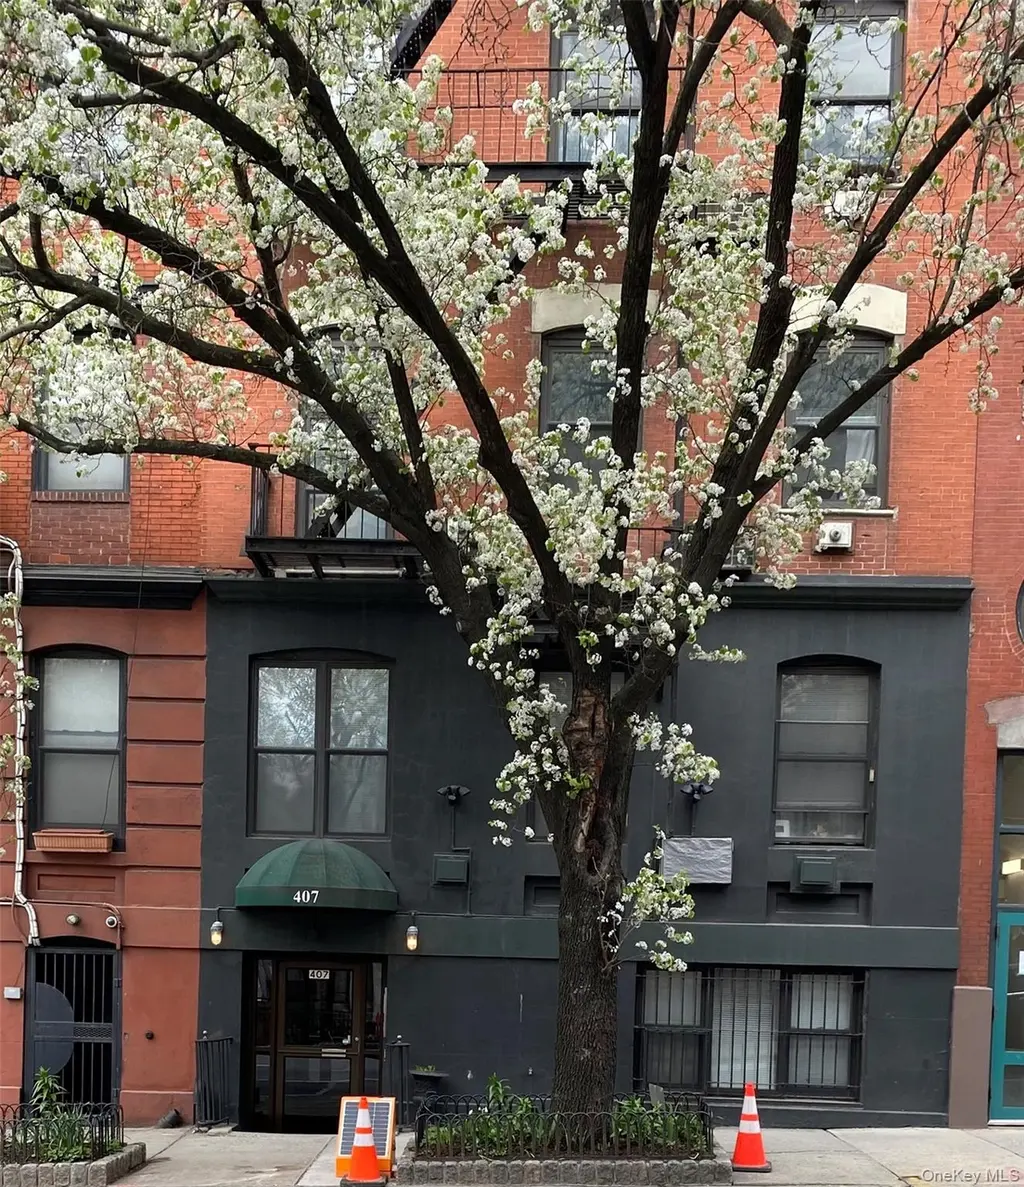
407 W 40th St Unit 4B · New York, NY
Flood risk 4/10 · Minor
- FEMA flood zone
- X (unshaded)
- Chance of flooding over 30 yrs
- 0.22%
- Est. flood insurance / yr
- $507 – $1,088
Fire risk 1/10 · Minimal
- Est. fire insurance / yr
- $691 – $1,283
Heat risk 7/10 · Major
- Hot days now (above 99°F)
- 7 days/yr
- Hot days in 30 yrs
- 15 days/yr
Wind risk 6/10 · Moderate
- Chance of severe wind over 30 yrs
- 27.0%
Air-quality risk 4/10 · Minor
- Unhealthy air days now
- 5 days/yr
- Unhealthy air days in 30 yrs
- 6 days/yr
Risk factors via First Street. Map © Google.
Why this score? — see what drove the C+ grade
The composite is a weighted blend of 9 inputs, each scored 0–100. Each bar is that input's sub-score; the figure is the points it added to the 100-point composite (weight × sub-score).
- Cash flow +19.3/30.0
- ARV discount +7.5/15.0
- Appreciation +6.4/10.0
- DSCR +6.1/10.0
- 1% rule +5.1/10.0
- Schools +5.0/10.0
- Livability +3.8/5.0
- Condition / age +3.8/5.0
- Rent growth +3.3/5.0
$665,000
🖨 Deal sheet (PDF) 📄 Offer letter ✓ Due diligence
Listing remarks
This charming one-bedroom walk-up co-op apartment is ideally situated in the highly sought-after Hudson Yards neighborhood. Enjoy living just moments from world-class dining, shopping, and entertainment, as well as nearby green spaces and waterfront attractions, including the green space at Bryant Park, waterfront views along the Hudson River and the uniquely designed park space built over the old railroad tracks. The High Line Walkway is a true testament to urban transformation and creativity. The walkway is only a few blocks from the apartment and intentionally changes seasonally as temperatures shift. Also within a few feet, the Times Square 42nd Street subway Station provides easy acces
Key facts
- High line walkway
- Updated kitchen
- Updated bathroom
Tags
Property features AI
Exterior
- Parking: On-street parking
- Security: Building security
- Utilities: Public sewer; Cable available; Electricity connected; Natural gas connected; Sewer connected; Water connected
- Home design: Stock cooperative; Entry level: 1
- Construction: Brick construction
- Exterior features: Brick construction; Not waterfront
Interior
- Kitchen: Gas range; Microwave; Refrigerator; Stainless steel appliances
- Bedrooms: 4 rooms total (see floor plan for bedroom distribution)
- Flooring: Hardwood floors
- Bathrooms: 1 full bathroom
- Heating & cooling: Natural gas heating; Other heating; Wall/window air conditioning units
- Interior features: Other interior features; Cats and dogs allowed
- Laundry & utility: No specific washer/dryer listed
Neighborhood map
What this means for you Summary
Snapshot
- This is a 1-bed/1.0-bath condo listed at $665k. Condition is rated good.
Deal economics
- At list price, monthly cash flow is $734 ($9k/yr) — positive.
- The deal already cash-flows at list — no discount required.
- Meets the 1% rule at list price ($7k rent vs $665k).
- Recommended offer: $625k (6.0% below list) — sets the bar for market timing.
- Cap rate 7.6% vs local median 2.6% in New York — top-decile yield for the area; either an underpriced asset or a hidden risk that comps aren't pricing in. Stress-test before assuming the spread holds.
Location & tenants
- Location reads 75/100 on livability (#268 in NY, #4,188 nationally) — a middle-class / working-renter tenant base. Strengths: amenities A+, commute A+, health & safety A; Watch: crime F, cost of living F.
- Market conditions: Rents rising (+3.1%/yr); 66 active listings in the ZIP; 40 comparable units currently listed for rent nearby; rentals leasing fast (median 9d on market — plan ~1-2 weeks tenant-placement turnaround); high-income renter base; 4,467 units permitted in New York County in 2024 (4,463 in 5+ unit buildings).
- At $6,747/mo this rent would consume 55% of the median local household income ($146k/yr) (locally 1020% of renters already pay >50% of income on rent) — very limited rent-growth headroom before tenants either downsize or default.
Forward outlook
- In year one you build about $23k of equity ($5k loan paydown + $19k appreciation (2.8% local appreciation)).
- New York County population projected at +21% by 2050 — long-run rental-demand tailwind backs the buy-and-hold thesis.
- At projected returns (2.8% appreciation + 3.1% rent growth), your $186k cash investment doubles in ~6 years — after that, you're playing with house money.
- By year 2, paydown + projected appreciation supports a ~$38k cash-out refi (75% LTV) — recoverable capital for the next deal without selling this one.
Negotiation context
- It's been on market 68 days — a 6% lower offer ($625k) is reasonable based on typical stale-listing flexibility.
Risks & watch-outs
- Watch-outs: built in 1910 — expect roof / HVAC / electrical / plumbing capex.
- Climate carrying-cost: major wind risk, 27% chance of damaging wind over 30y; extreme-heat days projected 7→15/yr by 2055 (HVAC capex compounding) — expect insurance premiums to compound above CPI over the hold.
Questions for the listing agent
- It's been on market 68 days. Have you received any prior offers? Is the seller open to a 6% concession, seller financing, or rate buy-down credit?
- Built in 1910 — when were the roof, HVAC, electrical panel, plumbing, and water heater last replaced?
- Any open or pending special assessments — roof, HVAC, plumbing, elevator, façade? What's the per-unit balance and payoff schedule, and is the seller paying it off at close or rolling it to the buyer?
- Why hasn't it sold? Are there any deal-killer items the seller is aware of (foundation, flood, title, zoning, code violations)?
- Is there a deadline driving the sale (1031 exchange, divorce, estate, relocation)? That informs how much negotiation room exists.
- Schools are B-rated — typically a magnet for longer-tenancy family renters. What's the average tenant stay here, and is there a school-zone premium baked into asking?
- Crime grade is F in this area — have there been break-ins, vandalism, or insurance claims at this property in the last 3 years? What carrier currently insures it and at what premium?
- What's the average days-on-market for RENTAL listings here right now (not sales)? A rising rental-DOM trend means longer vacancies and softer asking-rent achievability than the comps imply.
- What's the recent tenant-quality profile in this submarket — average credit score on applications, eviction rate, late-payment / NSF rate, and stable-employment percentage? A property-management company in the area should have these aggregated.
- How much new apartment / multifamily construction is in the pipeline within 1–3 miles? Heavy new supply (>2% of stock underway) typically softens rents 12–24 months out; light construction supports rent growth.
Investment metrics
- 1% rule
- 1.01% ✓
- Cap rate
- 7.62%
- Cash-on-cash
- 4.73%
- DSCR
- 1.21
- GRM
- 8.2
CMA / ARV
No comps found within radius.
Projected returns pro-forma
2.8% appreciation · 3.07% rent growth · sell at horizon
- IRR
- 11.4%
- Equity multiple
- 1.65×
- Total profit
- $120,406
- Equity at exit
- $291,505
- IRR
- 13.8%
- Equity multiple
- 3.00×
- Total profit
- $372,837
- Equity at exit
- $443,492
Cash invested: $186,200 (down + closing). Projections, not guarantees.
Landlord ↔ Tenant lean methodology
- Overall (CITY)
- 0 Strongly Tenant-Friendly
- State New York
- 15 Strongly Tenant-Friendly · D+10
- County
- — inherits STATE
- City New York
- 0 Strongly Tenant-Friendly · D+34
ZIP-level market 10018
- Home prices YoY
- 1.6%
- Rents YoY
- 3.1%
- Active inventory
- 66
- Price-to-rent
- 8.2×
Monthly cashflow live
- Estimated rent
- $6,747 high interval (Pro) →
- Mortgage (P&I)
- −$3,487
- Tax est. 1.5%
- −$831 /mo · $9,975/yr
- Insurance
- −$277
- HOA
- −$0
- Vacancy / Maint / Mgmt
- −$1,417
- Net cashflow
- $734
Break-even live
Sensitivity live
| Price | -10% $1,194 | -5% $964 | +0% $734 | +5% $505 | +10% $275 |
|---|---|---|---|---|---|
| Rent | -10% $201 | -5% $468 | +0% $734 | +5% $1,001 | +10% $1,267 |
| Rate | -1.0pp $1,069 | -0.5pp $904 | base $734 | +0.5pp $562 | +1.0pp $387 |
UW: 25.0% down · 7.5% · 30yr · 1.5% tax · 5.0% vac · 8.0% maint · 8.0% mgmt
Financing live
Cash to close
- Down payment
- $166,250
- Closing costs
- $19,950
- Reserves months
- —
- Total cash needed
- —
Loan-product check · same deal, 3 products live
Conventional
25% down · 7.5% · 30yr
- Down + closing
- —
- Monthly P&I
- —
- Monthly cashflow
- —
- DSCR
- —
- Eligible?
- —
Personal DTI + credit; lowest rate.
DSCR
20% down · 8.5% · 30yr
- Down + closing
- —
- Monthly P&I
- —
- Monthly cashflow
- —
- DSCR
- —
- Eligible?
- —
No personal income docs; deal must DSCR.
Hard money
10% down · 12.0% · 12mo
- Down + closing
- —
- Monthly P&I
- —
- Monthly cashflow
- —
- DSCR
- —
- Eligible?
- —
Short-term bridge; refi at stabilization.
Rent comps 40 comps
| Address | Beds | Baths | Sqft | Rent | $/sqft | DOM | Units | Dist |
|---|---|---|---|---|---|---|---|---|
| 450 W 42nd St #1693 New York, NY | 2.0 | 1.0–2.0 | 690 | $9,040 | $13.10 | 0d | 3 | 0.08mi |
| 555 10th Ave Unit 1018807P New York, NY | 1.0 | 1.0 | 688 | $9,726 | $14.14 | 23d | 1 | 0.14mi |
| 561 10th Ave #2085 New York, NY | 2.0 | 1.0–2.0 | 795 | $6,345 | $7.98 | 9d | 2 | 0.14mi |
| 520 W 43rd St #742 New York, NY | 1.0–2.0 | 1.0–2.0 | 769 | $5,860 | $7.62 | 9d | 2 | 0.22mi |
| 560 W 43rd St New York, NY | 3.0 | 1.0–2.0 | 769 | $5,265 | $6.84 | 9d | 5 | 0.29mi |
| 605 W 42nd St Unit 1016142P New York, NY | 2.0 | 1.0–2.0 | 720 | $14,542 | $20.18 | 11d | 2 | 0.35mi |
| 360 W 34th St New York, NY | 2.0 | 1.0–1.5 | 632 | $6,100 | $9.65 | 9d | 3 | 0.36mi |
| 622 11th Ave Unit 1402 New York, NY | 2.0 | 1.0 | 715 | $7,600 | $10.63 | 9d | 1 | 0.38mi |
| 635 W 42nd St #1990 New York, NY | 1.0–2.0 | 1.0–2.0 | 750 | $5,680 | $7.57 | 9d | 2 | 0.39mi |
| 235 W 48th St #1400 New York, NY | 2.0 | 1.0–2.0 | 687 | $6,270 | $9.12 | 9d | 3 | 0.46mi |
| 435 W 31st St New York, NY | 2.0 | 1.0–2.0 | 747 | $7,018 | $9.39 | 0d | 34 | 0.48mi |
| 754 9th Ave Unit 1017471P New York, NY | 1.0 | 1.0 | 538 | $7,284 | $13.54 | 9d | 1 | 0.50mi |
| 311 W 50th St #228 New York, NY | 2.0 | 1.0–2.0 | 669 | $6,470 | $9.67 | 9d | 3 | 0.50mi |
| 250 W 50th St New York, NY | 2.0 | 1.0–2.0 | 784 | $5,866 | $7.48 | 9d | 1 | 0.51mi |
| 70 W 45th St #1131 New York, NY | 1.0–2.0 | 1.0–2.0 | 902 | $5,990 | $6.64 | 9d | 2 | 0.63mi |
| 525 W 28th St New York, NY | 2.0 | 1.0–2.0 | 1116 | $6,612 | $5.92 | 9d | 1 | 0.66mi |
| 243 W 28th St #2143 New York, NY | 1.0 | 1.0 | 580 | $8,960 | $15.45 | 20d | 1 | 0.66mi |
| 244 W 29th St Unit 2149 New York, NY | 1.0 | 1.0 | 490 | $9,720 | $19.84 | 7d | 2 | 0.68mi |
| 550 W 54th St Unit 1243 New York, NY | 1.0–3.0 | 1.0–2.0 | 913 | $6,270 | $6.86 | 9d | 3 | 0.69mi |
| 254 W 54th St Unit 1026635P New York, NY | 1.0–2.0 | 1.0–2.0 | 860 | $8,040 | $9.34 | 9d | 2 | 0.69mi |
| 500 W 56th St #116 New York, NY | 2.0 | 1.0–2.0 | 680 | $6,190 | $9.10 | 9d | 3 | 0.75mi |
| 18 W 48th St Unit 670 New York, NY | 1.0 | 1.0 | 631 | $7,730 | $12.25 | 9d | 1 | 0.77mi |
| 535 W 23rd St #1584 New York, NY | 2.0 | 1.0–2.0 | 600 | $8,030 | $13.38 | 0d | 3 | 0.89mi |
| 309 5th Ave New York, NY | 1.0 | 1.0 | 597 | $7,596 | $12.72 | 9d | 13 | 0.90mi |
| 43 W 27th St #1055 New York, NY | 2.0 | 1.0 | 740 | $9,940 | $13.43 | 25d | 1 | 0.91mi |
| 77 W 55th St Unit 15H New York, NY | 1.0 | 1.0 | 750 | $4,900 | $6.53 | 23d | 1 | 0.92mi |
| 160 W 24th St New York, NY | 2.0 | 1.0–2.0 | 731 | $7,896 | $10.79 | 0d | 13 | 0.93mi |
| 776 6th Ave New York, NY | 2.0 | 1.0–2.0 | 742 | $7,700 | $10.37 | 0d | 19 | 0.94mi |
| 30 Park Ave #1347 New York, NY | 2.0 | 1.0 | 950 | $7,890 | $8.31 | 3d | 3 | 0.96mi |
| 41 Park Ave New York, NY | 2.0 | 1.0–2.0 | 815 | $6,555 | $8.04 | 9d | 3 | 0.99mi |
| 160 Central Park S New York, NY | 1.0–3.0 | 1.0–3.5 | 1550 | $9,250 | $5.97 | 8d | 9 | 1.00mi |
| 160 Central Park S New York, NY | 1.0–3.0 | 1.0–3.5 | 1550 | $7,500 | $4.84 | 9d | 10 | 1.00mi |
| 15 W 55th St #736 New York, NY | 2.0–3.0 | 1.0–2.0 | 1250 | $8,210 | $6.57 | 0d | 2 | 1.00mi |
| 21 W End Ave New York, NY | 2.0–3.0 | 2.0 | 750 | $8,995 | $11.99 | 25d | 2 | 1.04mi |
| 138 E 38th St New York, NY | 3.0 | 1.0–2.0 | 750 | $4,510 | $6.01 | 25d | 4 | 1.07mi |
| 400 W 61st St New York, NY | 4.0 | 1.0–4.0 | 1567 | $14,758 | $9.42 | 0d | 51 | 1.08mi |
| 120 W 21st St New York, NY | 2.0 | 1.0–2.0 | 676 | $7,070 | $10.46 | 5d | 14 | 1.11mi |
| 135 E 47th St New York, NY | 1.0 | 1.0 | 580 | $6,350 | $10.94 | 0d | 1 | 1.12mi |
| 180 W 20th St #1202 New York, NY | 2.0 | 1.0–2.0 | 791 | $9,465 | $11.96 | 0d | 3 | 1.12mi |
| 141 E 33rd St #1278 New York, NY | 2.0 | 1.0–1.5 | 683 | $6,230 | $9.12 | 9d | 3 | 1.13mi |
HOA detail condo
- Monthly dues
- $0 · $0/yr
- Likely covers
- water
- Assessments
- None detected in remarks — confirm with the listing agent.
Listing history 14 events
-
2026-06-21days on market $665,000 Active 68 DOM
-
2026-06-18days on market $665,000 Active 65 DOM
-
2026-06-17days on market $665,000 Active 64 DOM
-
2026-06-15days on market $665,000 Active 62 DOM
-
2026-06-13days on market $665,000 Active 60 DOM
-
2026-06-10days on market $665,000 Active 56 DOM
-
2026-06-08days on market $665,000 Active 55 DOM
-
2026-06-08days on market $665,000 Active 54 DOM
-
2026-06-04days on market $665,000 Active 51 DOM
-
2026-06-03days on market $665,000 Active 50 DOM
-
2026-06-01days on market $665,000 Active 48 DOM
-
2026-05-31days on market $665,000 Active 47 DOM
-
2026-05-06price $665,000
-
2026-04-14$675,000 Active
ⓘ Source: listings_history table (triggers on properties + properties_extension) + one-shot
backfill from property_details.listing_events for pre-trigger history.
Climate risk First Street
- Flood 4/10 Moderate FEMA zone X (unshaded) · 22% chance over 30 yrs
- Wildfire 1/10 Low
- Heat 7/10 Severe 7 d/yr ≥99°F today · 15 d/yr by 30 yrs out
- Wind 6/10 Major 27% chance of damaging wind over 30 yrs
- Air quality 4/10 Moderate 5 unhealthy d/yr today · 6 by 30 yrs out
Nearby sold comps map
Loading sold comps map…
Walkable amenities ~0.75 mi
Loading nearby amenities…
Taxation est. · year 1
- Rental income
- $80,964
- − Mortgage interest
- −$37,250
- − Property taxes
- −$9,975
- − Insurance
- −$3,325
- − Repairs & maintenance
- −$6,477
- − Management
- −$6,477
- − Depreciation
- −$19,345
- Taxable loss
- −$1,886
- Est. tax savings @ 24.0%
- +$453
- After-tax cash flow
- $9,266/yr
For passive investors: Depreciation is non-cash, so a rental often shows a tax loss while cash-flowing — sheltering income. Rental losses are passive: they offset passive income freely, and up to $25,000/yr can offset ordinary (W-2) income if you actively participate and your MAGI is under $100k (phasing out to $0 by $150k); unused losses carry forward. On sale, claimed depreciation is recaptured at up to 25%, and gains may owe capital-gains tax (a 1031 exchange can defer both). Figures are a year-1 estimate at your 24.0% rate — not tax advice; consult a CPA.
Condition & rehab AI · 10 photos
This charming one-bedroom walk-up co-op apartment in the Hudson Yards neighborhood is in good condition with minimal repairs needed. It offers a great location and potential for value-adding improvements to increase its appeal and marketability.
Value-add opportunities
- Both Paint the exterior of the building — Enhances curb appeal and can increase both resale and rental value.
- Both Replace the window screens — Improves energy efficiency and enhances the home's appearance.
- Both Upgrade the kitchen appliances — Modernizes the kitchen and can increase both resale and rental value.
- Both Install smart home devices — Enhances convenience and can increase both resale and rental value.
- Both Landscaping improvements — Enhances curb appeal and can increase both resale and rental value.
Renovation cost estimate screening
Value-add ROI direction
- Both Paint the exterior of the building — Enhances curb appeal and can increase both resale and rental value. ↑
- Both Replace the window screens — Improves energy efficiency and enhances the home's appearance. ↑
- Both Upgrade the kitchen appliances — Modernizes the kitchen and can increase both resale and rental value. ↑
- Both Install smart home devices — Enhances convenience and can increase both resale and rental value. ↑
- Both Landscaping improvements — Enhances curb appeal and can increase both resale and rental value. ↑
ⓘ Cost ranges are severity-bucket heuristics (US national rule-of-thumb). Get contractor quotes + a written scope before underwriting a rehab budget.
Schools (NCES district)
No district data.
Livability — New York
- Score
- 75/100
- State rank
- #268
- US rank
- #4188
Category grades
Schools grade is shown separately in the Schools card above.
Census & demographics
- Census place
- New York, NY
- County
- New York County · 1,599,927 people
- City population
- 7,731,280
- Metro
- New York-Newark-Jersey City, NY-NJ-PA
- Population (ZIP)
- 8,559
- Household income
- $145,958
- Rent vs Own
- Severe rent burden
- 1020.0
Population outlook (New York County) Hauer SSP2
- Today (2025)
- 1,825,725 people
- By 2030
- 1,904,611 · +4.3%
- By 2040
- 2,052,719 · +12.4%
- By 2050
- 2,206,601 · +20.9%
- By 2075
- 2,509,427 · +37.4%
- By 2100
- 2,702,933 · +48.0%
Race, ethnicity, and origin ACS 2023
- Neighborhood character
- Highly diverse neighborhood (Simpson 0.72)
- Race & ethnicity
- White 42% Asian 26% Hispanic / Latino 15% Black 10% Two or more races 10% Native American 2%
- Hispanic origin (detail)
- Mexican 3% Puerto Rican 1% Dominican 2%
- Common ancestry
- Romanian 2% Italian 2% English 1%
- Foreign-born
- 43% · Canada, China, South Korea
- Languages at home
- 61% English-only · Spanish 10% Chinese 9% Other Indo-European 8%
Political lean MEDSL · New York
- 2024 margin
- Solid D (+64.8) · D 82.4% · R 17.6%
- 2008→2024 swing
- -7.4pp toward R · 2008: 72.2pp · 2024: 64.8pp
- All cycles
- 2024: D+64.8 2020: D+74.5 2016: D+77.2 2012: D+69.6 2008: D+72.2
Not yet ingested
- Civics
- —
Market trends
- HPI YoY
- ▲ 2.80%
- Current HPI
- 179.8231
- Rent YoY
- ▲ 3.07%
- Metro
- New York-Newark-Jersey City, NY-NJ-PA
- State GDP YoY
- ▲ 2.60%
- F500 in state
- 92
Industry mix (Fortune 500 HQ in NY)
| Industry | F500 HQs | Revenue |
|---|---|---|
| Financial Services | 10 | $950B |
|
||
| Consumer Goods | 9 | $162B |
|
||
| Insurance | 4 | $225B |
|
||
| Telecommunications | 2 | $144B |
|
||
| Pharmaceuticals | 2 | $112B |
|
||
| Media / Entertainment | 2 | $69B |
|
||
Price history
-1.5% since first listed2 events — show timeline
- 2026-05-06 Price Changed $665,000 OneKey® MLS as Distributed by MLS Grid
- 2026-04-14 Listed $675,000 OneKey® MLS as Distributed by MLS Grid
Cash-flow waterfall
monthlySold comps — $/sqft
last 12 mo · ≤1 miLoading sold comps…