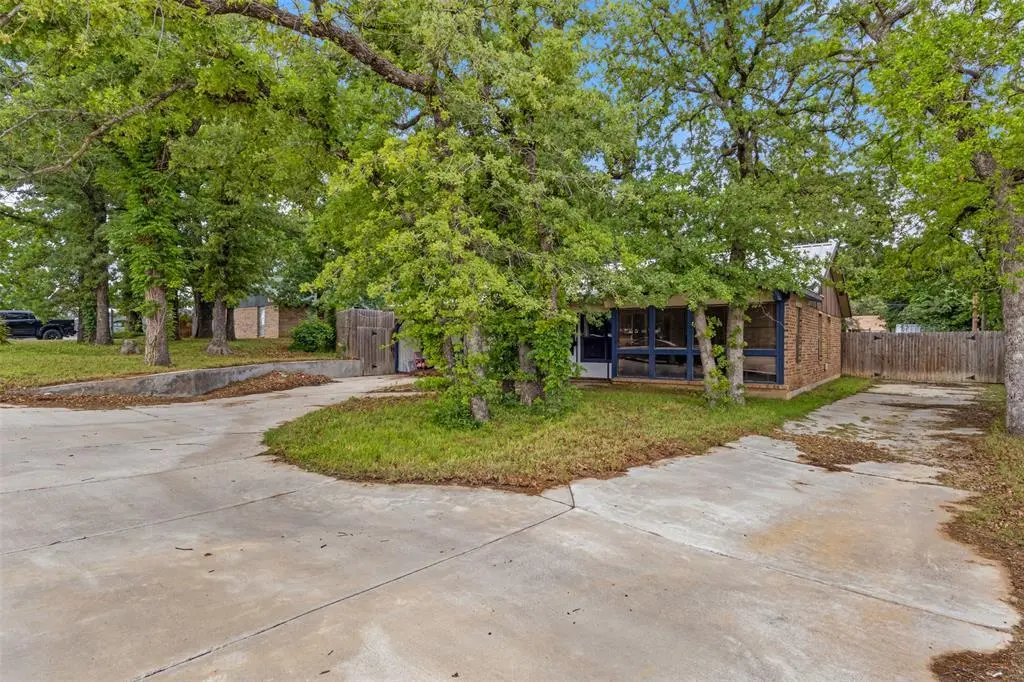
316 Hickorywood St · Azle, TX
Flood risk 1/10 · Minimal
- FEMA flood zone
- X (unshaded)
- Chance of flooding over 30 yrs
- 0.0%
- Est. flood insurance / yr
- $507 – $1,088
Fire risk 6/10 · Moderate
- Est. fire insurance / yr
- $1,222 – $2,270
Heat risk 7/10 · Major
- Hot days now (above 109°F)
- 7 days/yr
- Hot days in 30 yrs
- 21 days/yr
Wind risk 4/10 · Minor
- Chance of severe wind over 30 yrs
- 21.0%
Air-quality risk 2/10 · Minimal
- Unhealthy air days now
- 1 days/yr
- Unhealthy air days in 30 yrs
- 1 days/yr
Risk factors via First Street. Map © Google.
Why this score? — see what drove the D+ grade
The composite is a weighted blend of 9 inputs, each scored 0–100. Each bar is that input's sub-score; the figure is the points it added to the 100-point composite (weight × sub-score).
- ARV discount +15.0/15.0
- Cash flow +13.7/30.0
- 1% rule +4.1/10.0
- DSCR +4.1/10.0
- Schools +3.6/10.0
- Livability +3.6/5.0
- Rent growth +3.1/5.0
- Condition / age +2.5/5.0
- Appreciation +0.0/10.0
$200,000
🖨 Deal sheet (PDF) 📄 Offer letter ✓ Due diligence
Listing remarks MLS
*Back on the market, buyer financing fell through* Nestled on almost a third of a acre this home doesn’t disappoint. This fully updated home features an open floorplan with tall windows and tons of light, New cabinets, countertops and backsplash, stainless steel appliances and much more. Outside you will find a workshop with electric, fully fenced backyard and a large circle drive. Come check out this home before it’s gone!!!
Key facts
- Screened-in porch
- Storage shed
- Roll-up door
Tags
Property features AI
Finance
- Other: Possession in 30-60 days; Standard listing conditions
- Financial info: No second mortgage; Loan type treated as clear
- HOA & community: No homeowners association
Exterior
- Parking: Driveway (no garage or carport)
- Security: No specific security features provided
- Utilities: City water; No municipal utility district
- Home design: Single-family residence; One story; Residential property
- Construction: Built in 1985
- Exterior features: Above-ground pool; Lot less than 0.5 acre (approx. 0.292 acre); Subdivision: Tangelwood Estates
Interior
- Kitchen: Dishwasher; Electric cooktop; Electric oven
- Bedrooms: Primary bedroom (Level 1) — approx. 10 x 15
- Flooring: No flooring details provided
- Bathrooms: 1 full bathroom
- Heating & cooling: Central heating; Central air; Ceiling fan(s)
- Interior features: Open floorplan; Double vanity
- Laundry & utility: No specific laundry details provided
Neighborhood map
What this means for you Summary
Snapshot
- This is a 2-bed/1.0-bath single-family listed at $200k.
Deal economics
- At list price, monthly cash flow is $14 ($170/yr) — positive.
- The deal already cash-flows at list — no discount required.
- To meet the 1% rule (rent ≥ 1% of price), the offer needs to be $182k (8.9% below list).
- Recommended offer: $182k (8.9% below list) — sets the bar for 1% rule.
- Cap rate 6.4% vs local median 3.1% in Azle — top-decile yield for the area; either an underpriced asset or a hidden risk that comps aren't pricing in. Stress-test before assuming the spread holds.
Location & tenants
- Location reads 72/100 on livability (#267 in TX) — a middle-class / working-renter tenant base. Strengths: cost of living A+, housing A+, employment A; Watch: health & safety D+, amenities F, commute F.
- Azle ISD (suburban): math 37% / reading 43% proficiency, ranked #351 of 826 in TX (top 42%) — families likely to look elsewhere, expect single-tenant / working-renter base with shorter leases.
- Zoned schools: Cross Timbers El (math 42% / reading 47%, grade F, #1,155 of 4,322 statewide, top 29%, 543 students, 59% FRL); Santo Forte J H (math 28% / reading 41%, grade F, #858 of 1,662 statewide, top 54%, 514 students, 55% FRL); Azle H S (math 41% / reading 50%, grade D-, #634 of 1,632 statewide, top 39%, 2,054 students, 44% FRL).
- Market conditions: Rents rising (+2.3%/yr); 594 active listings in the ZIP; 7 comparable units currently listed for rent nearby; rentals at typical pace (median 21d on market — plan ~3-4 weeks tenant-placement turnaround); solid renter incomes; 437 units permitted in Parker County in 2024 (0 in 5+ unit buildings).
Forward outlook
- Local home prices are declining (-3.0%/yr); year-one equity from $1k of loan paydown is wiped out by about $6k of value loss. Plan a longer hold.
- Parker County population projected at +32% by 2050 — long-run rental-demand tailwind backs the buy-and-hold thesis.
Negotiation context
- It's been on market 22 days — a 2% lower offer ($197k) is reasonable based on typical stale-listing flexibility.
- 4 sale attempts since 13y ago with the ask held roughly flat each time — persistent listings suggest the price (not the market) is what's stuck; bring a comps-based counter.
Risks & watch-outs
- Climate carrying-cost: major wildfire risk; extreme-heat days projected 7→21/yr by 2055 (HVAC capex compounding) — expect insurance premiums to compound above CPI over the hold.
Questions for the listing agent
- Is there a deadline driving the sale (1031 exchange, divorce, estate, relocation)? That informs how much negotiation room exists.
- The area grade is low — what's the realistic commute time and amenity access for the typical tenant pool here? Any planned neighborhood developments (good or bad) we should know about?
- What's the average days-on-market for RENTAL listings here right now (not sales)? A rising rental-DOM trend means longer vacancies and softer asking-rent achievability than the comps imply.
- What's the recent tenant-quality profile in this submarket — average credit score on applications, eviction rate, late-payment / NSF rate, and stable-employment percentage? A property-management company in the area should have these aggregated.
- How much new for-sale + rental construction is in the pipeline within 1–3 miles? Heavy new supply typically softens prices + rents 12–24 months out; constrained supply supports both.
Investment metrics
- 1% rule
- 0.91% ✗
- Cap rate
- 6.38%
- Cash-on-cash
- 0.30%
- DSCR
- 1.01
- GRM
- 9.2
CMA / ARV
- ARV (median comp)
- $243,568
- List price
- $200,000
- Delta
- -17.89%
- Verdict
- UNDERPRICED
- Comps
- 20 within 1.0 mi
Show comp detail 9 sales within ~0.75 mi
| Address | Dist | Beds/Ba | Sqft | Sold | Price | $/sf | Match |
|---|---|---|---|---|---|---|---|
| 1517 Willow Wood Dr | 0.12mi | 3/2.0 (+1) | 1,234 (+7%) | 5mo | $225,000 | $182 | 70 |
| 417 Hickorywood St | 0.11mi | 3/2.0 (+1) | 1,232 (+7%) | 18mo | $250,000 | $203 | 60 |
| 424 Cedarwood St | 0.15mi | 3/2.0 (+1) | 1,230 (+6%) | 23mo | $249,000 | $202 | 54 |
| 405 Hickorywood St | 0.07mi | 3/1.0 (+1) | 1,300 (+13%) | 22mo | $220,000 | $169 | 53 |
| 304 Pearson Ln | 0.39mi | 2/2.0 | 1,246 (+8%) | 15mo | $259,000 | $208 | 52 |
| 308 Ashwood St | 0.27mi | 3/2.0 (+1) | 1,316 (+14%) | 6mo | $260,000 | $198 | 50 |
| 112 Live Oak St | 0.71mi | 2/2.0 | 1,188 (+3%) | 23mo | $200,000 | $168 | 39 |
| 104 Live Oak St | 0.69mi | 3/2.0 (+1) | 1,287 (+11%) | 2mo | $224,900 | $175 | 38 |
| 120 Live Oak Dr | 0.74mi | 3/2.0 (+1) | 1,325 (+15%) | 3mo | $240,000 | $181 | 30 |
Match score weights: distance 35% · size 25% · config 20% · recency 20%. Top-matched comps best support the ARV.
Projected returns pro-forma
-3.0% appreciation · 2.31% rent growth · sell at horizon
- IRR
- -16.6%
- Equity multiple
- 0.42×
- Total profit
- $-32,706
- Equity at exit
- $29,821
- IRR
- -9.6%
- Equity multiple
- 0.43×
- Total profit
- $-32,180
- Equity at exit
- $17,292
Cash invested: $56,000 (down + closing). Projections, not guarantees.
Landlord ↔ Tenant lean methodology
- Overall (STATE)
- 87 Strongly Landlord-Friendly
- State Texas
- 87 Strongly Landlord-Friendly · R+5
- County
- — inherits STATE
- City
- — inherits STATE
ZIP-level market 76020
- Home prices YoY
- -20.6%
- Rents YoY
- 2.3%
- Active inventory
- 594
- Price-to-rent
- 9.2×
Monthly cashflow live
- Estimated rent
- $1,821 high interval (Pro) →
- Mortgage (P&I)
- −$1,049
- Tax from tax record
- −$293 /mo · $3,511/yr
- Insurance
- −$83
- HOA
- −$0
- Vacancy / Maint / Mgmt
- −$382
- Net cashflow
- $14
Break-even live
Sensitivity live
| Price | -10% $127 | -5% $71 | +0% $14 | +5% $-42 | +10% $-99 |
|---|---|---|---|---|---|
| Rent | -10% $-130 | -5% $-58 | +0% $14 | +5% $86 | +10% $158 |
| Rate | -1.0pp $115 | -0.5pp $65 | base $14 | +0.5pp $-38 | +1.0pp $-90 |
UW: 25.0% down · 7.5% · 30yr · 1.5% tax · 5.0% vac · 8.0% maint · 8.0% mgmt
Financing live
Cash to close
- Down payment
- $50,000
- Closing costs
- $6,000
- Reserves months
- —
- Total cash needed
- —
Loan-product check · same deal, 3 products live
Conventional
25% down · 7.5% · 30yr
- Down + closing
- —
- Monthly P&I
- —
- Monthly cashflow
- —
- DSCR
- —
- Eligible?
- —
Personal DTI + credit; lowest rate.
DSCR
20% down · 8.5% · 30yr
- Down + closing
- —
- Monthly P&I
- —
- Monthly cashflow
- —
- DSCR
- —
- Eligible?
- —
No personal income docs; deal must DSCR.
Hard money
10% down · 12.0% · 12mo
- Down + closing
- —
- Monthly P&I
- —
- Monthly cashflow
- —
- DSCR
- —
- Eligible?
- —
Short-term bridge; refi at stabilization.
Rent comps 7 comps
| Address | Beds | Baths | Sqft | Rent | $/sqft | DOM | Units | Dist |
|---|---|---|---|---|---|---|---|---|
| 405 Oakwood St Azle, TX | 3.0 | 2.0 | 1456 | $1,935 | $1.33 | 22d | 1 | 0.13mi |
| 405 Oakwood St Azle, TX | 3.0 | 2.0 | 1456 | $1,935 | $1.33 | 19d | 1 | 0.13mi |
| 912 Red Bud Dr Azle, TX | 3.0 | 1.0 | 1378 | $1,750 | $1.27 | 0d | 1 | 1.18mi |
| 1032 Greg St Azle, TX | 2.0 | 2.0 | 1200 | $1,695 | $1.41 | 20d | 1 | 1.40mi |
| 244 Marina Dr Azle, TX | 1.0 | 1.0 | 725 | $1,215 | $1.68 | 45d | 1 | 1.42mi |
| 1408 Arvel Cir Apt B Azle, TX | 3.0 | 1.5 | 1200 | $1,410 | $1.18 | 0d | 1 | 1.46mi |
| 1401 Arvel Cir Azle, TX | 3.0 | 1.0 | 1140 | $1,550 | $1.36 | 45d | 1 | 1.48mi |
Listing history 17 events
-
2026-06-02statusdays on market $200,000 Pending 22 DOM
-
2026-06-01days on market $200,000 Active Option Contract 21 DOM
-
2026-05-31days on market $200,000 Active Option Contract 20 DOM
-
2026-05-11$200,000 Active 649-char remark
-
2020-12-28soldstatus
-
2020-10-16$165,000 Active 441-char remark
Show marketing remark (441 chars)
*Back on the market, buyer financing fell through* Nestled on almost a third of a acre this home doesn’t disappoint. This fully updated home features an open floorplan with tall windows and tons of light, New cabinets, countertops and backsplash, stainless steel appliances and much more. Outside you will find a workshop with electric, fully fenced backyard and a large circle drive. Come check out this home before it’s gone!!!
-
2017-03-27soldstatus
-
2017-03-24soldstatus Sold
Show marketing remark (63 chars)
Two bedroom one and a half bath brick home with large backyard.
-
2017-03-21status Pending
Show marketing remark (63 chars)
Two bedroom one and a half bath brick home with large backyard.
-
2017-03-14historical Active Option Contract
Show marketing remark (63 chars)
Two bedroom one and a half bath brick home with large backyard.
-
2017-02-28$95,000 Active
Show marketing remark (63 chars)
Two bedroom one and a half bath brick home with large backyard.
-
2014-06-16soldstatus Closed
-
2014-03-26status Pending
-
2014-03-19price $49,500
-
2014-02-15price $58,100
-
2013-12-31$66,000 Active
-
1998-03-25soldstatus
ⓘ Source: listings_history table (triggers on properties + properties_extension) + one-shot
backfill from property_details.listing_events for pre-trigger history.
Tax reassessment forecast TX · Resets to sale price
- Current annual tax
- $3,511 · $293/mo
- Projected year-2 tax
- $3,660 · $305/mo
- Expected delta
- +$149/yr (+$12/mo · 4.3%)
ⓘ Screening estimate from a state-policy table — verify with the county assessor before closing.
Climate risk First Street
- Flood 1/10 Low FEMA zone X (unshaded) · 0% chance over 30 yrs
- Wildfire 6/10 Major
- Heat 7/10 Severe 7 d/yr ≥109°F today · 21 d/yr by 30 yrs out
- Wind 4/10 Moderate 21% chance of damaging wind over 30 yrs
- Air quality 2/10 Low 1 unhealthy d/yr today · 1 by 30 yrs out
Nearby sold comps map
Loading sold comps map…
Walkable amenities ~0.75 mi
Loading nearby amenities…
Taxation est. · year 1
- Rental income
- $21,857
- − Mortgage interest
- −$11,203
- − Property taxes
- −$3,511
- − Insurance
- −$1,000
- − Repairs & maintenance
- −$1,749
- − Management
- −$1,749
- − Depreciation
- −$5,818
- Taxable loss
- −$3,172
- Est. tax savings @ 24.0%
- +$761
- After-tax cash flow
- $932/yr
For passive investors: Depreciation is non-cash, so a rental often shows a tax loss while cash-flowing — sheltering income. Rental losses are passive: they offset passive income freely, and up to $25,000/yr can offset ordinary (W-2) income if you actively participate and your MAGI is under $100k (phasing out to $0 by $150k); unused losses carry forward. On sale, claimed depreciation is recaptured at up to 25%, and gains may owe capital-gains tax (a 1031 exchange can defer both). Figures are a year-1 estimate at your 24.0% rate — not tax advice; consult a CPA.
Schools (NCES district)
- District
- Azle ISD
- NCES district ID
- 4809200
- Math proficiency
- 37% ▼ -11.00%
- Reading proficiency
- 43% ▼ -5.00%
- Median HH income
- $61,473
- Composite
- 35.57/100
- National rank
- #4900
- State rank
- #351 of 826 in TX
Livability — Azle
- Score
- 72/100
- State rank
- #267
- US rank
- #6239
Category grades
Schools grade is shown separately in the Schools card above.
Census & demographics
- County
- Parker County · 144,797 people
- City population
- 34,602
- Metro
- Dallas-Fort Worth-Arlington, TX
- Population (ZIP)
- 34,602
- Household income
- $87,298
- Rent vs Own
- Severe rent burden
- 433.0
Population outlook (Parker County) Hauer SSP2
- Today (2025)
- 147,426 people
- By 2030
- 157,863 · +7.1%
- By 2040
- 177,519 · +20.4%
- By 2050
- 194,786 · +32.1%
- By 2075
- 238,799 · +62.0%
- By 2100
- 264,126 · +79.2%
Race, ethnicity, and origin ACS 2023
- Neighborhood character
- Predominantly White (78%)
- Race & ethnicity
- White 78% Hispanic / Latino 18% Two or more races 9% Black 1%
- Hispanic origin (detail)
- Mexican 15%
- Common ancestry
- Slovak 2% Italian 1% Portuguese 1%
- Foreign-born
- 5% · Canada
- Languages at home
- 89% English-only · Spanish 11%
Political lean MEDSL · Parker
- 2024 margin
- Solid R (+66.4) · D 16.4% · R 82.8%
- 2008→2024 swing
- -11.2pp toward R · 2008: -55.2pp · 2024: -66.4pp
- All cycles
- 2024: R+66.4 2020: R+64.4 2016: R+67.5 2012: R+65.8 2008: R+55.2
Not yet ingested
- Civics
- —
Market trends
- HPI YoY
- ▼ -74.72%
- Current HPI
- 287.155
- Rent YoY
- ▲ 2.31%
- Metro
- Dallas-Fort Worth-Arlington, TX
- State GDP YoY
- ▲ 3.95%
- F500 in state
- 110
Industry mix (Fortune 500 HQ in TX)
| Industry | F500 HQs | Revenue |
|---|---|---|
| Energy | 16 | $1,198B |
|
||
| Technology | 5 | $198B |
|
||
| Engineering / Construction | 4 | $72B |
|
||
| Energy Services | 3 | $60B |
|
||
| Utilities | 3 | $41B |
|
||
| Healthcare | 2 | $330B |
|
||
Price history
+203.0% since first listed16 events — show timeline
- 2026-06-02 Pending — NTREIS
- 2026-05-20 Contingent — NTREIS
- 2026-05-11 Listed $200,000 NTREIS
- 2020-12-28 Sold (Public Records) — Public Records
- 2020-10-16 Listed $165,000 NTREIS
- 2017-03-27 Sold (Public Records) — Public Records
- 2017-03-24 Sold (MLS) — NTREIS
- 2017-03-21 Pending — NTREIS
- 2017-03-14 Contingent — NTREIS
- 2017-02-28 Listed $95,000 NTREIS
- 2014-06-16 Sold (MLS) — NTREIS
- 2014-03-26 Pending — NTREIS
- 2014-03-19 Price Changed $49,500 NTREIS
- 2014-02-15 Price Changed $58,100 NTREIS
- 2013-12-31 Listed $66,000 NTREIS
- 1998-03-25 Sold (Public Records) — Public Records
Property tax history
+6.1%/yrLatest (2025): $3,511 · -5.2% YoY. Source: county tax records.
Cash-flow waterfall
monthlySold comps — $/sqft
last 12 mo · ≤1 miLoading sold comps…