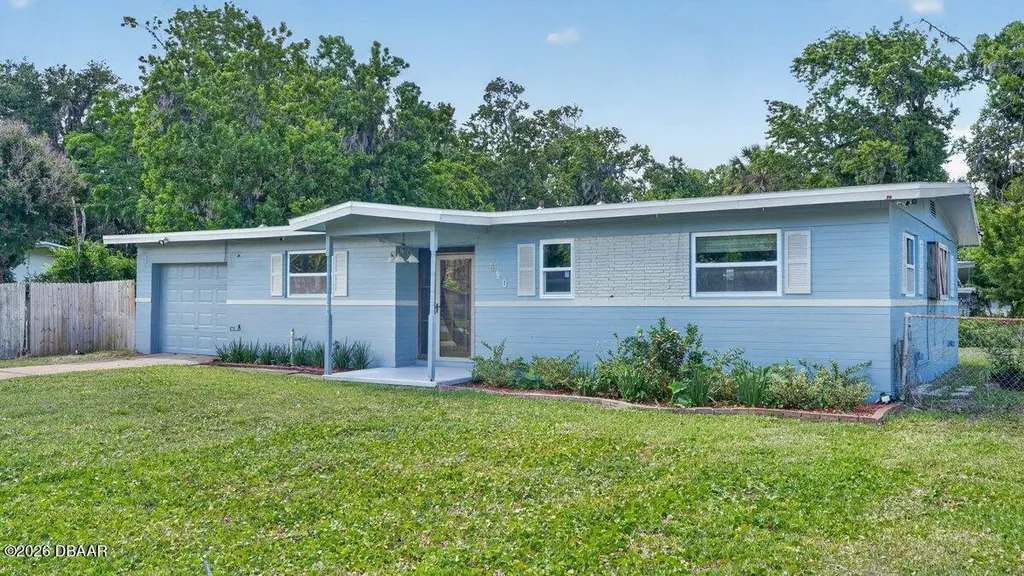
690 Westward Cir · Holly Hill, FL
Flood risk 6/10 · Moderate
- FEMA flood zone
- X (shaded)
- Chance of flooding over 30 yrs
- 0.55%
- Est. flood insurance / yr
- $507 – $1,088
Fire risk 1/10 · Minimal
- Est. fire insurance / yr
- $947 – $1,759
Heat risk 10/10 · Severe
- Hot days now (above 104°F)
- 7 days/yr
- Hot days in 30 yrs
- 20 days/yr
Wind risk 10/10 · Severe
- Chance of severe wind over 30 yrs
- 99.0%
Air-quality risk 2/10 · Minimal
- Unhealthy air days now
- 2 days/yr
- Unhealthy air days in 30 yrs
- 2 days/yr
Risk factors via First Street. Map © Google.
Why this score? — see what drove the D grade
The composite is a weighted blend of 9 inputs, each scored 0–100. Each bar is that input's sub-score; the figure is the points it added to the 100-point composite (weight × sub-score).
- Cash flow +13.8/30.0
- ARV discount +7.5/15.0
- DSCR +4.2/10.0
- Schools +3.9/10.0
- Livability +3.6/5.0
- Rent growth +2.8/5.0
- 1% rule +2.6/10.0
- Condition / age +2.5/5.0
- Appreciation +0.0/10.0
$235,000
🖨 Deal sheet (PDF) 📄 Offer letter ✓ Due diligence
Listing remarks MLS
This concrete block home sits a large 110x100 ft corner lot and has a fenced in rear yard. Check out the room sizes and living area for the price. This is a great and easy home to show and is ready for a new family. Square footage received from tax rolls. All information recorded in the MLS intended to be accurate but cannot be guaranteed.
Key facts
- Real wood cabinets
- Spacious corner lot
- Separate family room
Tags
Property features AI
Exterior
- Parking: 1-car garage
- Utilities: Public water; Electricity connected; Water connected
- Home design: Single family residence; One story
- Construction: Block and concrete construction; Shingle roof
- Exterior features: Patio; Chain link and privacy fencing; Corner lot; Paved road access; Workshop
Interior
- Kitchen: Refrigerator; Microwave; Electric range; Electric oven
- Flooring: Tile
- Bathrooms: 2 full bathrooms
- Heating & cooling: Central heating; Central air; Ceiling fans
- Interior features: Ceiling fans; Eat-in kitchen; Kitchen island; Unfurnished
- Laundry & utility: Laundry located in garage
Neighborhood map
What this means for you Summary
Snapshot
- This is a 3-bed/1.0-bath single-family listed at $235k.
Deal economics
- At list price, monthly cash flow is $21 ($255/yr) — positive.
- The deal already cash-flows at list — no discount required.
- To meet the 1% rule (rent ≥ 1% of price), the offer needs to be $178k (24.3% below list).
- Recommended offer: $178k (24.3% below list) — sets the bar for 1% rule.
Location & tenants
- Location reads 72/100 on livability (#325 in FL) — a middle-class / working-renter tenant base. Strengths: cost of living A+, housing A+, health & safety A+; Watch: schools F, amenities F, commute F.
- Volusia (suburban): math 44% / reading 49% proficiency, ranked #47 of 73 in FL (top 64%) — families likely to look elsewhere, expect single-tenant / working-renter base with shorter leases.
- Market conditions: Rents rising (+1.0%/yr); 332 active listings in the ZIP; 40 comparable units currently listed for rent nearby; rentals at typical pace (median 25d on market — plan ~3-4 weeks tenant-placement turnaround); 3,402 units permitted in Volusia County in 2024 (681 in 5+ unit buildings).
- This rent runs 38% of the median local income ($56k/yr) — at the standard rent-burdened threshold; future hikes will face affordability resistance.
Forward outlook
- Local home prices are declining (-3.0%/yr); year-one equity from $2k of loan paydown is wiped out by about $7k of value loss. Plan a longer hold.
- Volusia County population projected at +19% by 2050 — long-run rental-demand tailwind backs the buy-and-hold thesis.
Negotiation context
- Only 11 days on market — expect competitive offers; lowballing is unlikely to land.
- 4 sale attempts since 18y ago with the ask held roughly flat each time — persistent listings suggest the price (not the market) is what's stuck; bring a comps-based counter.
- Current owner paid $150k; list at $235k implies a 57% gain — meaningful room to come down on a strong offer.
Risks & watch-outs
- Climate carrying-cost: major flood risk; severe wind risk, 99% chance of damaging wind over 30y; extreme-heat days projected 7→20/yr by 2055 (HVAC capex compounding) — expect insurance premiums to compound above CPI over the hold.
Questions for the listing agent
- Built in 1960 — when were the roof, HVAC, electrical panel, plumbing, and water heater last replaced?
- Is there a deadline driving the sale (1031 exchange, divorce, estate, relocation)? That informs how much negotiation room exists.
- Schools are F-rated, which usually means shorter tenancies and higher turnover. Who's the typical renter profile here, and what's been the actual vacancy rate?
- The area grade is low — what's the realistic commute time and amenity access for the typical tenant pool here? Any planned neighborhood developments (good or bad) we should know about?
- What's the average days-on-market for RENTAL listings here right now (not sales)? A rising rental-DOM trend means longer vacancies and softer asking-rent achievability than the comps imply.
- What's the recent tenant-quality profile in this submarket — average credit score on applications, eviction rate, late-payment / NSF rate, and stable-employment percentage? A property-management company in the area should have these aggregated.
- How much new for-sale + rental construction is in the pipeline within 1–3 miles? Heavy new supply typically softens prices + rents 12–24 months out; constrained supply supports both.
Investment metrics
- 1% rule
- 0.76% ✗
- Cap rate
- 6.40%
- Cash-on-cash
- 0.39%
- DSCR
- 1.02
- GRM
- 11.0
CMA / ARV
No comps found within radius.
Projected returns pro-forma
-3.0% appreciation · 1.01% rent growth · sell at horizon
- IRR
- -17.7%
- Equity multiple
- 0.39×
- Total profit
- $-40,343
- Equity at exit
- $35,039
- IRR
- -13.5%
- Equity multiple
- 0.28×
- Total profit
- $-47,652
- Equity at exit
- $20,319
Cash invested: $65,800 (down + closing). Projections, not guarantees.
Landlord ↔ Tenant lean methodology
- Overall (STATE)
- 87 Strongly Landlord-Friendly
- State Florida
- 87 Strongly Landlord-Friendly · R+3
- County
- — inherits STATE
- City
- — inherits STATE
ZIP-level market 32117
- Home prices YoY
- -8.2%
- Rents YoY
- 1.0%
- Active inventory
- 332
- Price-to-rent
- 11.0×
Monthly cashflow live
- Estimated rent
- $1,779 high interval (Pro) →
- Mortgage (P&I)
- −$1,232
- Tax from tax record
- −$54 /mo · $648/yr
- Insurance
- −$98
- HOA
- −$0
- Vacancy / Maint / Mgmt
- −$374
- Net cashflow
- $21
Break-even live
Sensitivity live
| Price | -10% $154 | -5% $88 | +0% $21 | +5% $-45 | +10% $-112 |
|---|---|---|---|---|---|
| Rent | -10% $-119 | -5% $-49 | +0% $21 | +5% $91 | +10% $162 |
| Rate | -1.0pp $140 | -0.5pp $81 | base $21 | +0.5pp $-40 | +1.0pp $-102 |
UW: 25.0% down · 7.5% · 30yr · 1.5% tax · 5.0% vac · 8.0% maint · 8.0% mgmt
Financing live
Cash to close
- Down payment
- $58,750
- Closing costs
- $7,050
- Reserves months
- —
- Total cash needed
- —
Loan-product check · same deal, 3 products live
Conventional
25% down · 7.5% · 30yr
- Down + closing
- —
- Monthly P&I
- —
- Monthly cashflow
- —
- DSCR
- —
- Eligible?
- —
Personal DTI + credit; lowest rate.
DSCR
20% down · 8.5% · 30yr
- Down + closing
- —
- Monthly P&I
- —
- Monthly cashflow
- —
- DSCR
- —
- Eligible?
- —
No personal income docs; deal must DSCR.
Hard money
10% down · 12.0% · 12mo
- Down + closing
- —
- Monthly P&I
- —
- Monthly cashflow
- —
- DSCR
- —
- Eligible?
- —
Short-term bridge; refi at stabilization.
Rent comps 40 comps
| Address | Beds | Baths | Sqft | Rent | $/sqft | DOM | Units | Dist |
|---|---|---|---|---|---|---|---|---|
| 430 Dorothy Ave Daytona Beach, FL | 3.0 | 1.0 | 1103 | $1,700 | $1.54 | 15d | 1 | 0.23mi |
| 820 State Ave Unit 3 Daytona Beach, FL | 2.0 | 1.0 | 841 | $1,370 | $1.63 | 24d | 1 | 0.31mi |
| 820 State Ave Apt 1 Daytona Beach, FL | 2.0 | 2.0 | 841 | $1,470 | $1.75 | 24d | 1 | 0.31mi |
| 331 Clifton Ave Daytona Beach, FL | 3.0 | 2.0 | 1355 | $2,050 | $1.51 | 24d | 1 | 0.37mi |
| 100 Navigator DR Daytona Beach, FL | 1.0–3.0 | 1.0–2.0 | 1029 | $1,808 | $1.76 | 12d | 25 | 0.39mi |
| 840 Center Ave Apt 75 Holly Hill, FL | 2.0 | 1.0 | 900 | $1,250 | $1.39 | 24d | 1 | 0.39mi |
| 660 8th St Daytona Beach, FL | 2.0 | 1.0 | 900 | $1,375 | $1.53 | 24d | 1 | 0.41mi |
| 520 Zinfandel Dr Unit 1 Daytona Beach, FL | 3.0 | 2.5 | 1463 | $2,500 | $1.71 | 24d | 1 | 0.43mi |
| 464 Brentwood Dr Daytona Beach, FL | 1.0–2.0 | 1.0 | 850 | $1,365 | $1.61 | 12d | 8 | 0.58mi |
| 921 Daytona Ave Unit A Daytona Beach, FL | 2.0 | 1.0 | 1100 | $1,775 | $1.61 | 24d | 1 | 0.60mi |
| 218 Center St Daytona Beach, FL | 3.0 | 2.0 | 1234 | $2,190 | $1.77 | 22d | 1 | 0.62mi |
| 1014 Indian Oaks E Daytona Beach, FL | 3.0 | 2.0 | 1500 | $2,650 | $1.77 | 24d | 1 | 0.63mi |
| 119 Thomasson Ave Daytona Beach, FL | 2.0 | 1.0 | 851 | $1,199 | $1.41 | 12d | 2 | 0.74mi |
| 638 LPGA Blvd Unit B Daytona Beach, FL | 3.0 | 2.0 | 1111 | $2,490 | $2.24 | 24d | 1 | 0.75mi |
| 171 Daytona Ave Daytona Beach, FL | 2.0 | 2.0 | 835 | $1,650 | $1.98 | 24d | 1 | 0.80mi |
| 1229 Kennedy Rd Daytona Beach, FL | 2.0 | 1.0 | 800 | $950 | $1.19 | 15d | 1 | 0.87mi |
| 1225 Kennedy Rd Daytona Beach, FL | 2.0 | 1.0 | 800 | $825 | $1.03 | 12d | 1 | 0.87mi |
| 1217 Kennedy Rd Unit 56 Daytona Beach, FL | 2.0 | 1.0 | 800 | $1,000 | $1.25 | 24d | 1 | 0.87mi |
| 1216 Kennedy Rd Unit 4 Daytona Beach, FL | 2.0 | 1.0 | 900 | $975 | $1.08 | 15d | 1 | 0.91mi |
| 1216 Kennedy Rd Unit 10 Daytona Beach, FL | 2.0 | 1.0 | 900 | $975 | $1.08 | 24d | 1 | 0.91mi |
| 900 LPGA Blvd Daytona Beach, FL | 1.0–2.0 | 1.0–2.0 | 885 | $1,495 | $1.69 | 15d | 14 | 1.02mi |
| 138 Kingston Ave Daytona Beach, FL | 3.0 | 2.0 | 996 | $1,900 | $1.91 | 24d | 1 | 1.06mi |
| 1355 Hiawatha Ave Daytona Beach, FL | 2.0 | 1.0 | 780 | $1,675 | $2.15 | 15d | 1 | 1.16mi |
| 601 Vera St Unit 601 Daytona Beach, FL | 2.0 | 1.0 | 1113 | $1,700 | $1.53 | 24d | 1 | 1.20mi |
| 935 N Halifax Ave Daytona Beach, FL | 2.0 | 2.0 | 1210 | $1,700 | $1.40 | 24d | 1 | 1.21mi |
| 875 Derbyshire Rd Daytona Beach, FL | 3.0 | 1.0–2.0 | 835 | $1,299 | $1.56 | 12d | 11 | 1.23mi |
| 625 Holmes Ave Daytona Beach, FL | 2.0 | 1.0 | 768 | $995 | $1.30 | 22d | 1 | 1.27mi |
| 925 N Halifax Ave Daytona Beach, FL | 2.0 | 2.0 | 1210 | $2,000 | $1.65 | 24d | 1 | 1.28mi |
| 550 Ruth St Daytona Beach, FL | 3.0 | 2.0 | 1114 | $1,995 | $1.79 | 12d | 1 | 1.28mi |
| 209 Taylor Ave Unit 2 Daytona Beach, FL | 3.0 | 1.0 | 970 | $2,490 | $2.57 | 24d | 1 | 1.29mi |
| 1224 10th St Daytona Beach, FL | 3.0 | 1.0 | 1284 | $1,550 | $1.21 | 15d | 1 | 1.29mi |
| 512 Fulton St Daytona Beach, FL | 2.0 | 1.0 | 963 | $1,600 | $1.66 | 24d | 1 | 1.35mi |
| 946 15th St Daytona Beach, FL | 2.0 | 2.0 | 1010 | $1,500 | $1.49 | 24d | 1 | 1.36mi |
| 1521 Moravia Ave Daytona Beach, FL | 2.0 | 2.0 | 700 | $2,000 | $2.86 | 20d | 1 | 1.36mi |
| 1262 Essex Rd Daytona Beach, FL | 3.0 | 2.0 | 1500 | $1,900 | $1.27 | 24d | 1 | 1.37mi |
| 244 Lexington Dr Daytona Beach, FL | 3.0 | 1.0 | 1099 | $2,550 | $2.32 | 15d | 1 | 1.38mi |
| 732 N Halifax Ave Daytona Beach, FL | 1.0–2.0 | 1.0–2.0 | 862 | $1,200 | $1.39 | 24d | 2 | 1.38mi |
| 422 N Lincoln St Daytona Beach, FL | 3.0 | 2.0 | 1354 | $2,150 | $1.59 | 24d | 1 | 1.40mi |
| 625 N Halifax Ave Daytona Beach, FL | 2.0 | 1.5–2.0 | 1153 | $1,488 | $1.29 | 20d | 2 | 1.40mi |
| 417 Jefferson St #1 Daytona Beach, FL | 2.0 | 1.0 | 700 | $1,890 | $2.70 | 24d | 1 | 1.42mi |
Listing history 13 events
-
2026-06-03statusdays on market $235,000 Pending 11 DOM
-
2026-06-01days on market $235,000 Active 10 DOM
-
2026-05-31days on market $235,000 Active 9 DOM
-
2026-05-31days on market $235,000 Active 8 DOM
-
2026-05-22$235,000 Active
-
2026-01-21soldstatus $150,000
-
2022-06-15historical
-
2022-05-04$275,000 Active
-
2013-02-07soldstatus $46,000
-
2013-01-18soldstatus $37,500 341-char remark
Show marketing remark (341 chars)
This concrete block home sits a large 110x100 ft corner lot and has a fenced in rear yard. Check out the room sizes and living area for the price. This is a great and easy home to show and is ready for a new family. Square footage received from tax rolls. All information recorded in the MLS intended to be accurate but cannot be guaranteed.
-
2012-06-12$46,900 341-char remark
Show marketing remark (341 chars)
This concrete block home sits a large 110x100 ft corner lot and has a fenced in rear yard. Check out the room sizes and living area for the price. This is a great and easy home to show and is ready for a new family. Square footage received from tax rolls. All information recorded in the MLS intended to be accurate but cannot be guaranteed.
-
2008-10-16$90,000
-
2004-09-16soldstatus $50,000
ⓘ Source: listings_history table (triggers on properties + properties_extension) + one-shot
backfill from property_details.listing_events for pre-trigger history.
Tax reassessment forecast FL · Resets to sale price
- Current annual tax
- $648 · $54/mo
- Projected year-2 tax
- $1,950 · $163/mo
- Expected delta
- +$1,302/yr (+$109/mo · 200.8%)
ⓘ Screening estimate from a state-policy table — verify with the county assessor before closing.
Climate risk First Street
- Flood 6/10 Major FEMA zone X (shaded) · 55% chance over 30 yrs
- Wildfire 1/10 Low
- Heat 10/10 Extreme 7 d/yr ≥104°F today · 20 d/yr by 30 yrs out
- Wind 10/10 Extreme 99% chance of damaging wind over 30 yrs
- Air quality 2/10 Low 2 unhealthy d/yr today · 2 by 30 yrs out
Nearby sold comps map
Loading sold comps map…
Walkable amenities ~0.75 mi
Loading nearby amenities…
Taxation est. · year 1
- Rental income
- $21,350
- − Mortgage interest
- −$13,164
- − Property taxes
- −$648
- − Insurance
- −$1,175
- − Repairs & maintenance
- −$1,708
- − Management
- −$1,708
- − Depreciation
- −$6,836
- Taxable loss
- −$3,890
- Est. tax savings @ 24.0%
- +$934
- After-tax cash flow
- $1,188/yr
For passive investors: Depreciation is non-cash, so a rental often shows a tax loss while cash-flowing — sheltering income. Rental losses are passive: they offset passive income freely, and up to $25,000/yr can offset ordinary (W-2) income if you actively participate and your MAGI is under $100k (phasing out to $0 by $150k); unused losses carry forward. On sale, claimed depreciation is recaptured at up to 25%, and gains may owe capital-gains tax (a 1031 exchange can defer both). Figures are a year-1 estimate at your 24.0% rate — not tax advice; consult a CPA.
Schools (NCES district)
- District
- Volusia
- NCES district ID
- 1201920
- Math proficiency
- 44% ▼ -9.00%
- Reading proficiency
- 49% ▼ -3.00%
- Median HH income
- $42,946
- Composite
- 39.2/100
- National rank
- #4019
- State rank
- #47 of 73 in FL
Livability — Holly Hill
- Score
- 72/100
- State rank
- #325
- US rank
- #5737
Category grades
Schools grade is shown separately in the Schools card above.
Census & demographics
- Census place
- Holly Hill, FL
- County
- Volusia County · 556,871 people
- Metro
- Deltona-Daytona Beach-Ormond Beach, FL
- Population (ZIP)
- 30,955
- Household income
- $56,419
- Rent vs Own
- Severe rent burden
- 1781.0
Population outlook (Volusia County) Hauer SSP2
- Today (2025)
- 572,749 people
- By 2030
- 598,695 · +4.5%
- By 2040
- 644,880 · +12.6%
- By 2050
- 681,451 · +19.0%
- By 2075
- 759,957 · +32.7%
- By 2100
- 778,902 · +36.0%
Race, ethnicity, and origin ACS 2023
- Neighborhood character
- Diverse neighborhood (Simpson 0.63)
- Race & ethnicity
- White 53% Black 27% Hispanic / Latino 10% Two or more races 9% Asian 3%
- Hispanic origin (detail)
- Mexican 2% Puerto Rican 3%
- Common ancestry
- Romanian 2% Lithuanian 2% Slovak 1%
- Foreign-born
- 8% · Canada, Vietnam, Jamaica
- Languages at home
- 86% English-only · Spanish 8% Vietnamese 1% Other Indo-European 1%
Political lean MEDSL · Volusia
- 2024 margin
- Strong R (+21.8) · D 38.7% · R 60.5%
- 2008→2024 swing
- -27.4pp toward R · 2008: 5.7pp · 2024: -21.8pp
- All cycles
- 2024: R+21.8 2020: R+14.1 2016: R+13.1 2012: R+1.2 2008: D+5.7
Not yet ingested
- Civics
- —
Market trends
- HPI YoY
- ▼ -96.62%
- Current HPI
- 1084.54
- Rent YoY
- ▲ 1.01%
- Metro
- Deltona-Daytona Beach-Ormond Beach, FL
- State GDP YoY
- ▲ 3.28%
- F500 in state
- 36
Industry mix (Fortune 500 HQ in FL)
| Industry | F500 HQs | Revenue |
|---|---|---|
| Industrial Technology | 2 | $29B |
|
||
| Insurance | 2 | $17B |
|
||
| Retail | 1 | $60B |
|
||
| Technology Distribution | 1 | $58B |
|
||
| Homebuilding | 1 | $35B |
|
||
| Technology Manufacturing | 1 | $35B |
|
||
Price history
+370.0% since first listed9 events — show timeline
- 2026-05-22 Listed $235,000 Daytona MLS
- 2026-01-21 Sold (Public Records) $150,000 Public Records
- 2022-06-15 Listing Removed — Daytona MLS
- 2022-05-04 Listed $275,000 Daytona MLS
- 2013-02-07 Sold (Public Records) $46,000 Public Records
- 2013-01-18 Sold (MLS) $37,500 Daytona MLS
- 2012-06-12 Listed $46,900 Daytona MLS
- 2008-10-16 Listed $90,000 Daytona MLS
- 2004-09-16 Sold (Public Records) $50,000 Public Records
Property tax history
-0.5%/yrLatest (2025): $648 · +1.4% YoY. Source: county tax records.
Cash-flow waterfall
monthlySold comps — $/sqft
last 12 mo · ≤1 miLoading sold comps…