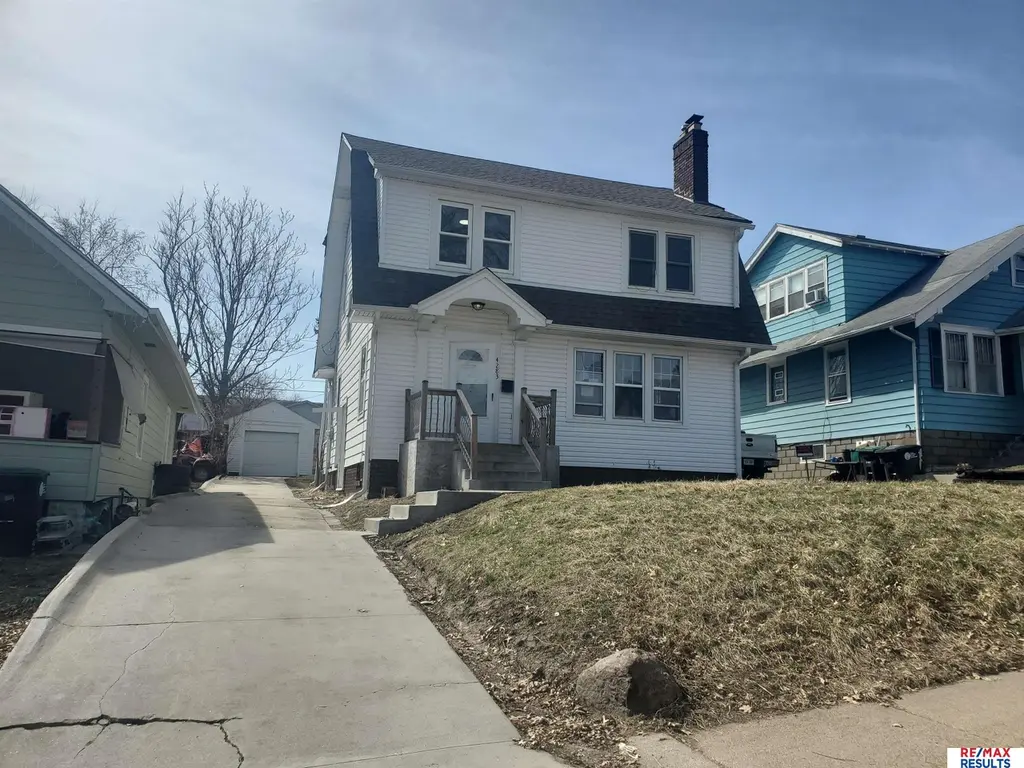
4283 Wirt St · Omaha, NE
Flood risk 1/10 · Minimal
- FEMA flood zone
- X (unshaded)
- Chance of flooding over 30 yrs
- 0.0%
- Est. flood insurance / yr
- $473 – $860
Fire risk 1/10 · Minimal
- Est. fire insurance / yr
- $1,161 – $2,155
Heat risk 3/10 · Minor
- Hot days now (above 104°F)
- 7 days/yr
- Hot days in 30 yrs
- 15 days/yr
Wind risk 2/10 · Minimal
- Chance of severe wind over 30 yrs
- —
Air-quality risk 2/10 · Minimal
- Unhealthy air days now
- 0 days/yr
- Unhealthy air days in 30 yrs
- 1 days/yr
Risk factors via First Street. Map © Google.
Why this score? — see what drove the B+ grade
The composite is a weighted blend of 9 inputs, each scored 0–100. Each bar is that input's sub-score; the figure is the points it added to the 100-point composite (weight × sub-score).
- Cash flow +27.8/30.0
- ARV discount +15.0/15.0
- DSCR +9.8/10.0
- 1% rule +7.4/10.0
- Appreciation +5.0/10.0
- Livability +4.2/5.0
- Rent growth +2.5/5.0
- Condition / age +2.5/5.0
- Schools +2.1/10.0
$134,950
🖨 Deal sheet (PDF) 📄 Offer letter ✓ Due diligence
Listing remarks MLS
This is the perfect first home or investment property for those looking for some easy sweat equity! You will love the hardwood floors throughout the home and under the existing carpet. Cozy living room with fireplace and lots of large windows to let in the natural sunlight. Formal dining room, updated eat-in kitchen and modern bathroom. The 3rd floor loft is perfect for an office, playroom, or storage. Unfinished basement with endless opportunities. Impressive lot with fence and detached garage. Welcome Home!
Key facts
- Large windows
- Formal dining room
- Modern bathroom
Tags
Neighborhood map
What this means for you Summary
Snapshot
- This is a 4-bed/2.0-bath other listed at $135k.
Deal economics
- At list price, monthly cash flow is $411 ($5k/yr) — positive.
- The deal already cash-flows at list — no discount required.
- Meets the 1% rule at list price ($2k rent vs $135k).
- Recommended offer: $127k (6.0% below list) — sets the bar for market timing.
- Cap rate 9.9% vs local median 3.6% in Omaha — top-decile yield for the area; either an underpriced asset or a hidden risk that comps aren't pricing in. Stress-test before assuming the spread holds.
Location & tenants
- Location reads 84/100 on livability (#7 in NE, #663 nationally) — a professional / high-income tenant draw. Strengths: amenities A+, commute A+, cost of living A+; Watch: crime F.
- Omaha Public Schools (urban): math 20% / reading 28% proficiency, ranked #110 of 111 in NE (top 99%) — low school quality limits family demand, transient renter base, plan for 1-2y turnover; 62% free/reduced lunch — lower-income household profile, screen leases tightly.
- Market conditions: 2 active listings in the ZIP; 24 comparable units currently listed for rent nearby; rentals at typical pace (median 24d on market — plan ~3-4 weeks tenant-placement turnaround); 46% of comp listings sitting > 30 days — soft ceiling on asking rent; 4,539 units permitted in Douglas County in 2024 (2,583 in 5+ unit buildings).
Forward outlook
- In year one you build about $5k of equity ($934 loan paydown + $4k appreciation (3.0% local appreciation)).
- Douglas County population projected at +28% by 2050 — long-run rental-demand tailwind backs the buy-and-hold thesis.
- At projected returns (3.0% appreciation + 3.0% rent growth), your $38k cash investment doubles in ~4 years — after that, you're playing with house money.
- By year 7, paydown + projected appreciation supports a ~$32k cash-out refi (75% LTV) — recoverable capital for the next deal without selling this one.
Negotiation context
- It's been on market 89 days — a 6% lower offer ($127k) is reasonable based on typical stale-listing flexibility.
- 14 sale attempts since 23y ago; this cycle's ask has dropped $25k (16%) from the opening price — seller is motivated, your offer sets the floor, not the list.
Risks & watch-outs
- Watch-outs: built in 1925 — expect roof / HVAC / electrical / plumbing capex.
Questions for the listing agent
- It's been on market 89 days. Have you received any prior offers? Is the seller open to a 6% concession, seller financing, or rate buy-down credit?
- Built in 1925 — when were the roof, HVAC, electrical panel, plumbing, and water heater last replaced?
- Why hasn't it sold? Are there any deal-killer items the seller is aware of (foundation, flood, title, zoning, code violations)?
- Is there a deadline driving the sale (1031 exchange, divorce, estate, relocation)? That informs how much negotiation room exists.
- Crime grade is F in this area — have there been break-ins, vandalism, or insurance claims at this property in the last 3 years? What carrier currently insures it and at what premium?
- What's the average days-on-market for RENTAL listings here right now (not sales)? A rising rental-DOM trend means longer vacancies and softer asking-rent achievability than the comps imply.
- What's the recent tenant-quality profile in this submarket — average credit score on applications, eviction rate, late-payment / NSF rate, and stable-employment percentage? A property-management company in the area should have these aggregated.
- How much new for-sale + rental construction is in the pipeline within 1–3 miles? Heavy new supply typically softens prices + rents 12–24 months out; constrained supply supports both.
Investment metrics
- 1% rule
- 1.24% ✓
- Cap rate
- 9.94%
- Cash-on-cash
- 13.04%
- DSCR
- 1.58
- GRM
- 6.7
CMA / ARV
- ARV (median comp)
- $184,124
- List price
- $134,950
- Delta
- -26.71%
- Verdict
- UNDERPRICED
- Comps
- 20 within 1.0 mi
Projected returns pro-forma
3.0% appreciation · 3.0% rent growth · sell at horizon
- IRR
- 19.7%
- Equity multiple
- 2.12×
- Total profit
- $42,415
- Equity at exit
- $60,679
- IRR
- 20.9%
- Equity multiple
- 4.03×
- Total profit
- $114,393
- Equity at exit
- $93,514
Cash invested: $37,786 (down + closing). Projections, not guarantees.
Landlord ↔ Tenant lean methodology
- Overall (STATE)
- 83 Strongly Landlord-Friendly
- State Nebraska
- 83 Strongly Landlord-Friendly · R+13
- County
- — inherits STATE
- City
- — inherits STATE
ZIP-level market 68111-0000
- Active inventory
- 2
- Price-to-rent
- 6.7×
Monthly cashflow live
- Estimated rent
- $1,676 high interval (Pro) →
- Mortgage (P&I)
- −$708
- Tax from tax record
- −$150 /mo · $1,798/yr
- Insurance
- −$56
- HOA
- −$0
- Vacancy / Maint / Mgmt
- −$352
- Net cashflow
- $411
Break-even live
Sensitivity live
| Price | -10% $487 | -5% $449 | +0% $411 | +5% $372 | +10% $334 |
|---|---|---|---|---|---|
| Rent | -10% $278 | -5% $344 | +0% $411 | +5% $477 | +10% $543 |
| Rate | -1.0pp $478 | -0.5pp $445 | base $411 | +0.5pp $376 | +1.0pp $340 |
UW: 25.0% down · 7.5% · 30yr · 1.5% tax · 5.0% vac · 8.0% maint · 8.0% mgmt
Financing live
Cash to close
- Down payment
- $33,738
- Closing costs
- $4,048
- Reserves months
- —
- Total cash needed
- —
Loan-product check · same deal, 3 products live
Conventional
25% down · 7.5% · 30yr
- Down + closing
- —
- Monthly P&I
- —
- Monthly cashflow
- —
- DSCR
- —
- Eligible?
- —
Personal DTI + credit; lowest rate.
DSCR
20% down · 8.5% · 30yr
- Down + closing
- —
- Monthly P&I
- —
- Monthly cashflow
- —
- DSCR
- —
- Eligible?
- —
No personal income docs; deal must DSCR.
Hard money
10% down · 12.0% · 12mo
- Down + closing
- —
- Monthly P&I
- —
- Monthly cashflow
- —
- DSCR
- —
- Eligible?
- —
Short-term bridge; refi at stabilization.
Rent comps 24 comps
| Address | Beds | Baths | Sqft | Rent | $/sqft | DOM | Units | Dist |
|---|---|---|---|---|---|---|---|---|
| 4276 Binney St Omaha, NE | 4.0 | 1.0 | 1358 | $1,495 | $1.10 | 44d | 1 | 0.05mi |
| 3535 N 45th Ave Omaha, NE | 3.0 | 1.0 | 1325 | $1,800 | $1.36 | 44d | 1 | 0.41mi |
| 3002 N 48th Ave Omaha, NE | 4.0 | 2.0 | 1205 | $1,550 | $1.29 | 24d | 1 | 0.41mi |
| 3508 N 47th Ave Omaha, NE | 3.0 | 1.0 | 1425 | $1,600 | $1.12 | 20d | 1 | 0.44mi |
| 4874 Maple St Omaha, NE | 3.0 | 1.0 | 1098 | $1,545 | $1.41 | 44d | 1 | 0.45mi |
| 2914 N 49th Ave Omaha, NE | 3.0 | 1.0 | 1375 | $1,615 | $1.17 | 24d | 1 | 0.54mi |
| 3808 N 48th St Omaha, NE | 3.0 | 2.0 | 1400 | $2,000 | $1.43 | 3d | 1 | 0.64mi |
| 5011 Miami St Omaha, NE | 3.0 | 3.0 | 2180 | $2,200 | $1.01 | 44d | 1 | 0.65mi |
| 4542 Franklin St Unit Labs Omaha, NE | 5.0 | 2.5 | 2000 | $1,900 | $0.95 | 44d | 1 | 0.76mi |
| 4240 Fowler Ave Omaha, NE | 4.0 | 2.0 | 1956 | $1,895 | $0.97 | 24d | 1 | 1.08mi |
| 3204 N 56th St Omaha, NE | 3.0 | 2.0 | 1800 | $1,700 | $0.94 | 11d | 1 | 1.11mi |
| 4707 N 40th Ave Omaha, NE | 3.0 | 1.0 | 1337 | $1,500 | $1.12 | 22d | 1 | 1.13mi |
| 3430 Seward St Omaha, NE | 3.0 | 1.0 | 1371 | $1,695 | $1.24 | 15d | 1 | 1.13mi |
| 3314 Franklin St Omaha, NE | 4.0 | 2.0 | 1635 | $1,600 | $0.98 | 44d | 1 | 1.16mi |
| 4114 N 54th St Omaha, NE | 3.0 | 2.0 | 1683 | $1,745 | $1.04 | 3d | 1 | 1.21mi |
| 2817 N 60th St Unit 2821/02 Omaha, NE | 3.0 | 1.0 | 1188 | $1,045 | $0.88 | 24d | 1 | 1.33mi |
| 2817 N 60th St Unit 2817/02 Omaha, NE | 3.0 | 1.0 | 1188 | $1,500 | $1.26 | 3d | 1 | 1.33mi |
| 5633 Parker St Omaha, NE | 3.0 | 1.5 | 1200 | $1,695 | $1.41 | 44d | 1 | 1.33mi |
| 5610 Seward St Omaha, NE | 4.0 | 2.0 | 1682 | $2,200 | $1.31 | 44d | 1 | 1.38mi |
| 4657 Camden Ave Omaha, NE | 3.0 | 1.0 | 1250 | $1,500 | $1.20 | 44d | 1 | 1.39mi |
| 4806 Webster St Omaha, NE | 3.0 | 2.5 | 1589 | $2,295 | $1.44 | 3d | 1 | 1.42mi |
| 6010 Evans St Omaha, NE | 3.0 | 2.0 | 1196 | $1,850 | $1.55 | 24d | 1 | 1.42mi |
| 4824 Webster St Unit 4824/4824 Omaha, NE | 4.0 | 1.0 | 1317 | $1,050 | $0.80 | 44d | 1 | 1.43mi |
| 5004 Webster St Omaha, NE | 4.0 | 3.0 | 2156 | $2,500 | $1.16 | 44d | 1 | 1.50mi |
Listing history 50 events
-
2026-06-18days on market $134,950 Active 89 DOM
-
2026-06-17days on market $134,950 Active 88 DOM
-
2026-06-16days on market $134,950 Active 87 DOM
-
2026-06-15days on market $134,950 Active 86 DOM
-
2026-06-13days on market $134,950 Active 84 DOM
-
2026-06-10days on market $134,950 Active 81 DOM
-
2026-06-09days on market $134,950 Active 80 DOM
-
2026-06-08days on market $134,950 Active 79 DOM
-
2026-06-07days on market $134,950 Active 78 DOM
-
2026-06-03days on market $134,950 Active 74 DOM
-
2026-06-03days on market $134,950 Active 73 DOM
-
2026-06-01days on market $134,950 Active 72 DOM
-
2026-06-01days on market $134,950 Active 71 DOM
-
2026-04-22price $144,950 514-char remark
Show marketing remark (514 chars)
This is the perfect first home or investment property for those looking for some easy sweat equity! You will love the hardwood floors throughout the home and under the existing carpet. Cozy living room with fireplace and lots of large windows to let in the natural sunlight. Formal dining room, updated eat-in kitchen and modern bathroom. The 3rd floor loft is perfect for an office, playroom, or storage. Unfinished basement with endless opportunities. Impressive lot with fence and detached garage. Welcome Home!
-
2026-03-20$159,900 New 514-char remark
Show marketing remark (514 chars)
This is the perfect first home or investment property for those looking for some easy sweat equity! You will love the hardwood floors throughout the home and under the existing carpet. Cozy living room with fireplace and lots of large windows to let in the natural sunlight. Formal dining room, updated eat-in kitchen and modern bathroom. The 3rd floor loft is perfect for an office, playroom, or storage. Unfinished basement with endless opportunities. Impressive lot with fence and detached garage. Welcome Home!
-
2024-04-23historical
-
2024-04-12status Back On Market
-
2024-03-18status Pending
-
2024-01-29price $179,000
-
2024-01-10$185,000 New
-
2023-12-21historical
-
2023-10-18price $184,999
-
2023-09-29price $189,900
-
2023-08-08$195,000 New
-
2023-04-14soldstatus $1,375,000
-
2021-06-05historical
-
2020-12-03$110,000 Active - New
-
2020-06-20historical
-
2020-03-28price $70,000
-
2020-01-17$67,000 Active - New
-
2020-01-04historical
-
2019-07-03$70,000 Active - New
-
2019-07-01historical
-
2019-03-31price $70,000
-
2018-12-30$65,000 Active - New
-
2018-12-05historical
-
2018-07-04$65,000 Active - New
-
2018-06-07historical
-
2017-12-06$65,000 Active - New
-
2015-04-01historical
-
2014-10-08$49,500 Active
-
2014-08-18historical
-
2014-02-17$59,000
-
2008-05-16soldstatus $23,260
-
2008-03-27historical
-
2007-11-30$33,800
-
2003-10-09soldstatus $60,000
-
2003-09-30soldstatus $60,000
-
2003-08-26historical
-
2003-07-08$62,000
ⓘ Source: listings_history table (triggers on properties + properties_extension) + one-shot
backfill from property_details.listing_events for pre-trigger history.
Tax reassessment forecast NE · Resets to sale price
- Current annual tax
- $1,798 · $150/mo
- Projected year-2 tax
- $2,335 · $195/mo
- Expected delta
- +$537/yr (+$45/mo · 29.9%)
ⓘ Screening estimate from a state-policy table — verify with the county assessor before closing.
Climate risk First Street
- Flood 1/10 Low FEMA zone X (unshaded) · 0% chance over 30 yrs
- Wildfire 1/10 Low
- Heat 3/10 Moderate 7 d/yr ≥104°F today · 15 d/yr by 30 yrs out
- Wind 2/10 Low
- Air quality 2/10 Low 0 unhealthy d/yr today · 1 by 30 yrs out
Nearby sold comps map
Loading sold comps map…
Walkable amenities ~0.75 mi
Loading nearby amenities…
Taxation est. · year 1
- Rental income
- $20,115
- − Mortgage interest
- −$7,559
- − Property taxes
- −$1,798
- − Insurance
- −$675
- − Repairs & maintenance
- −$1,609
- − Management
- −$1,609
- − Depreciation
- −$3,926
- Taxable income
- $2,939
- Est. tax owed @ 24.0%
- −$705
- After-tax cash flow
- $4,221/yr
For passive investors: Depreciation is non-cash, so a rental often shows a tax loss while cash-flowing — sheltering income. Rental losses are passive: they offset passive income freely, and up to $25,000/yr can offset ordinary (W-2) income if you actively participate and your MAGI is under $100k (phasing out to $0 by $150k); unused losses carry forward. On sale, claimed depreciation is recaptured at up to 25%, and gains may owe capital-gains tax (a 1031 exchange can defer both). Figures are a year-1 estimate at your 24.0% rate — not tax advice; consult a CPA.
Schools (NCES district)
- District
- Omaha Public Schools
- NCES district ID
- 3174820
- Math proficiency
- 20% ▼ -10.00%
- Reading proficiency
- 28% ▼ -5.00%
- Median HH income
- $46,039
- Composite
- 20.83/100
- National rank
- #8502
- State rank
- #110 of 111 in NE
Livability — Omaha
- Score
- 84/100
- State rank
- #7
- US rank
- #663
Category grades
Schools grade is shown separately in the Schools card above.
Census & demographics
- Census place
- Omaha, NE
Population outlook (Douglas County) Hauer SSP2
- Today (2025)
- 625,245 people
- By 2030
- 661,613 · +5.8%
- By 2040
- 732,395 · +17.1%
- By 2050
- 801,988 · +28.3%
- By 2075
- 968,637 · +54.9%
- By 2100
- 1,101,871 · +76.2%
Not yet ingested
- Political lean
- —
- Race & ethnicity
- —
- Common origin
- —
- Civics
- —
Market trends
- HPI YoY
- —
- Current HPI
- —
- Rent YoY
- —
- Metro
- —
- State GDP YoY
- ▲ 0.68%
- F500 in state
- 2
Industry mix (Fortune 500 HQ in NE)
| Industry | F500 HQs | Revenue |
|---|---|---|
| Conglomerate | 1 | $371B |
|
||
Price history
+133.8% since first listed37 events — show timeline
- 2026-04-22 Price Changed $144,950 GPRMLS
- 2026-03-20 Listed $159,900 GPRMLS
- 2024-04-23 Listing Removed — GPRMLS
- 2024-04-12 Relisted — GPRMLS
- 2024-03-18 Pending — GPRMLS
- 2024-01-29 Price Changed $179,000 GPRMLS
- 2024-01-10 Listed $185,000 GPRMLS
- 2023-12-21 Listing Removed — GPRMLS
- 2023-10-18 Price Changed $184,999 GPRMLS
- 2023-09-29 Price Changed $189,900 GPRMLS
- 2023-08-08 Listed $195,000 GPRMLS
- 2023-04-14 Sold (Public Records) $1,375,000 Public Records
- 2021-06-05 Listing Removed — GPRMLS
- 2020-12-03 Listed $110,000 GPRMLS
- 2020-06-20 Listing Removed — GPRMLS
- 2020-03-28 Price Changed $70,000 GPRMLS
- 2020-01-17 Listed $67,000 GPRMLS
- 2020-01-04 Listing Removed — GPRMLS
- 2019-07-03 Listed $70,000 GPRMLS
- 2019-07-01 Listing Removed — GPRMLS
- 2019-03-31 Price Changed $70,000 GPRMLS
- 2018-12-30 Listed $65,000 GPRMLS
- 2018-12-05 Listing Removed — GPRMLS
- 2018-07-04 Listed $65,000 GPRMLS
- 2018-06-07 Listing Removed — GPRMLS
- 2017-12-06 Listed $65,000 GPRMLS
- 2015-04-01 Listing Removed — GPRMLS
- 2014-10-08 Listed $49,500 GPRMLS
- 2014-08-18 Listing Removed — GPRMLS
- 2014-02-17 Listed $59,000 GPRMLS
- 2008-05-16 Sold (MLS) $23,260 GPRMLS
- 2008-03-27 Listing Removed — GPRMLS
- 2007-11-30 Listed $33,800 GPRMLS
- 2003-10-09 Sold (Public Records) $60,000 Public Records
- 2003-09-30 Sold (MLS) $60,000 GPRMLS
- 2003-08-26 Listing Removed — GPRMLS
- 2003-07-08 Listed $62,000 GPRMLS
Property tax history
+3.4%/yrLatest (2025): $1,798 · +1.9% YoY. Source: county tax records.
Cash-flow waterfall
monthlySold comps — $/sqft
last 12 mo · ≤1 miLoading sold comps…