 🏗️ New Construction
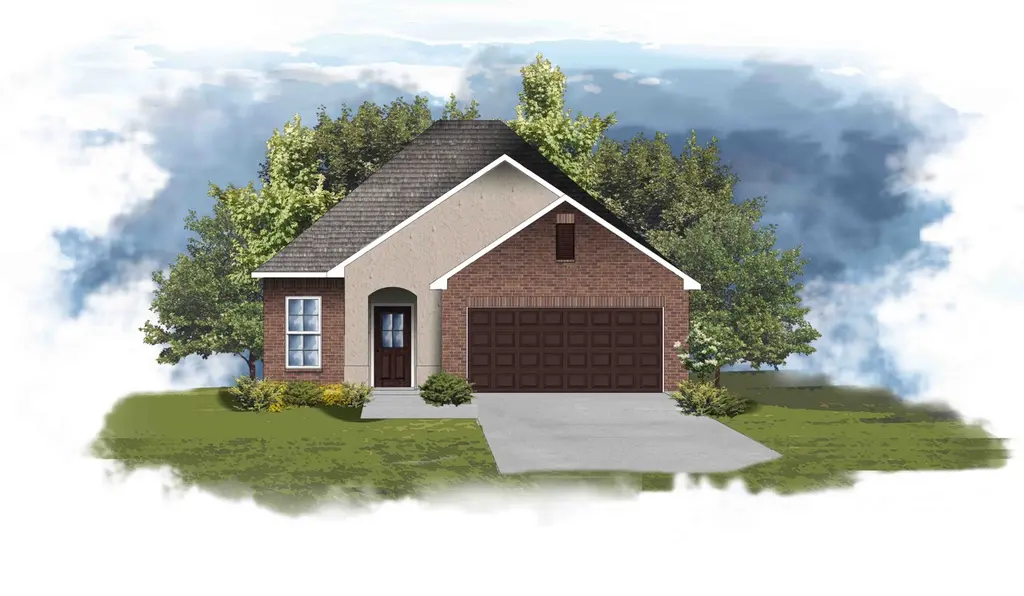
Wells II A Plan · Walker, LA
Flood risk No data
- FEMA flood zone
- —
- Chance of flooding over 30 yrs
- —
- Est. flood insurance / yr
- —
Fire risk No data
- Est. fire insurance / yr
- —
Heat risk No data
- Hot days now (above threshold)
- —
- Hot days in 30 yrs
- —
Wind risk No data
- Chance of severe wind over 30 yrs
- —
Air-quality risk No data
- Unhealthy air days now
- —
- Unhealthy air days in 30 yrs
- —
Risk factors via First Street. Map © Google.
Why this score? — see what drove the D- grade
The composite is a weighted blend of 9 inputs, each scored 0–100. Each bar is that input's sub-score; the figure is the points it added to the 100-point composite (weight × sub-score).
- Cash flow +10.9/30.0
- ARV discount +7.5/15.0
- Schools +4.0/10.0
- Livability +3.8/5.0
- Rent growth +3.5/5.0
- 1% rule +3.2/10.0
- DSCR +3.2/10.0
- Condition / age +1.0/5.0
- Appreciation +0.0/10.0
$236,990
🖨 Deal sheet (PDF) 📄 Offer letter ✓ Due diligence
Listing remarks MLS
- Open Floor Plan - Four Bedrooms, Two Bathrooms - Two Car Garage - Brick, Stucco, and Siding Exterior - Recessed Can Lighting in Kitchen - Walk-In Master Closet - Double Vanity in Master Bath - Separate Master Shower
Key facts
- Double vanity
- Open floor plan
- 2 garage spots
Tags
Neighborhood map
What this means for you Summary
Snapshot
- This is a 4-bed/2.0-bath single-family listed at $237k. Condition is rated poor.
Deal economics
- At list price, monthly cash flow is $-105 ($-1k/yr) — negative.
- To cash-flow at today's rent, offer at most $228k (3.6% below list).
- To meet the 1% rule (rent ≥ 1% of price), the offer needs to be $200k (15.7% below list).
- Recommended offer: $200k (15.7% below list) — sets the bar for 1% rule.
Location & tenants
- Location reads 75/100 on livability (#19 in LA, #3,999 nationally) — a middle-class / working-renter tenant base. Strengths: cost of living A+, housing A+, health & safety A+; Watch: crime F, amenities D-, commute F.
- Livingston Parish (suburban): math 40% / reading 52% proficiency, ranked #13 of 98 in LA (top 13%) — families likely to look elsewhere, expect single-tenant / working-renter base with shorter leases.
- Market conditions: Rents rising (+3.8%/yr); 976 active listings in the ZIP; 12 comparable units currently listed for rent nearby; rentals at typical pace (median 24d on market — plan ~3-4 weeks tenant-placement turnaround); 42% of comp listings sitting > 30 days — soft ceiling on asking rent; solid renter incomes; 794 units permitted in Livingston Parish in 2024 (99 in 5+ unit buildings).
- This rent runs 31% of the median local income ($79k/yr) — at the standard rent-burdened threshold; future hikes will face affordability resistance.
Forward outlook
- Local home prices are declining (-3.0%/yr); year-one equity from $2k of loan paydown is wiped out by about $7k of value loss. Plan a longer hold.
- Livingston County population projected at +27% by 2050 — long-run rental-demand tailwind backs the buy-and-hold thesis.
Negotiation context
- It's been on market 483 days — a 12% lower offer ($209k) is reasonable based on typical stale-listing flexibility.
Questions for the listing agent
- What do current leases actually rent for vs. the listed asking? Can we see a recent rent roll and the last 12 months of T-12 income?
- It's been on market 483 days. Have you received any prior offers? Is the seller open to a 16% concession, seller financing, or rate buy-down credit?
- Have any recent inspections been done? Can we get a copy of the seller's disclosures and any deferred-maintenance estimates?
- Why hasn't it sold? Are there any deal-killer items the seller is aware of (foundation, flood, title, zoning, code violations)?
- Is there a deadline driving the sale (1031 exchange, divorce, estate, relocation)? That informs how much negotiation room exists.
- Schools are A-rated — typically a magnet for longer-tenancy family renters. What's the average tenant stay here, and is there a school-zone premium baked into asking?
- Crime grade is F in this area — have there been break-ins, vandalism, or insurance claims at this property in the last 3 years? What carrier currently insures it and at what premium?
- The area grade is low — what's the realistic commute time and amenity access for the typical tenant pool here? Any planned neighborhood developments (good or bad) we should know about?
- What's the average days-on-market for RENTAL listings here right now (not sales)? A rising rental-DOM trend means longer vacancies and softer asking-rent achievability than the comps imply.
- What's the recent tenant-quality profile in this submarket — average credit score on applications, eviction rate, late-payment / NSF rate, and stable-employment percentage? A property-management company in the area should have these aggregated.
- How much new for-sale + rental construction is in the pipeline within 1–3 miles? Heavy new supply typically softens prices + rents 12–24 months out; constrained supply supports both.
Investment metrics
- 1% rule
- 0.82% ✗
- Cap rate
- 5.78%
- Cash-on-cash
- -1.85%
- DSCR
- 0.92
- GRM
- 10.2
CMA / ARV
- ARV (median comp)
- $243,631
- List price
- $236,990
- Delta
- -2.73%
- Verdict
- FAIR
- Comps
- 20 within 1.0 mi
Show comp detail 12 sales within ~0.75 mi
| Address | Dist | Beds/Ba | Sqft | Sold | Price | $/sf | Match |
|---|---|---|---|---|---|---|---|
| 11465 Rossow Ct | 0.13mi | 3/2.0 (-1) | 1,617 (+4%) | 1mo | $242,000 | $150 | 81 |
| 25729 Raines Ave | 0.41mi | 4/2.0 | 1,568 (+1%) | 1mo | $235,990 | $151 | 78 |
| 25680 Tarver Dr | 0.45mi | 4/2.0 | 1,568 (+1%) | 0mo | $237,660 | $152 | 77 |
| 25692 Tarver Dr | 0.46mi | 4/2.0 | 1,568 (+1%) | 0mo | $236,245 | $151 | 76 |
| 11586 Water View Ave | 0.27mi | 3/2.0 (-1) | 1,613 (+4%) | 1mo | $240,000 | $149 | 75 |
| 25662 Tarver Dr | 0.49mi | 4/2.0 | 1,568 (+1%) | 2mo | $236,110 | $151 | 74 |
| 25730 Raines Ave | 0.41mi | 3/2.0 (-1) | 1,629 (+5%) | 1mo | $243,655 | $150 | 67 |
| 25669 Tarver Dr | 0.49mi | 3/2.0 (-1) | 1,495 (-4%) | 1mo | $239,985 | $161 | 66 |
| 12656 Bald Eagle Dr | 0.56mi | 3/2.0 (-1) | 1,521 (-2%) | 3mo | $268,999 | $177 | 63 |
| 25710 Tarver Dr | 0.48mi | 3/2.0 (-1) | 1,463 (-6%) | 3mo | $228,990 | $157 | 61 |
| 25710 Tarver Dr | 0.48mi | 3/2.0 (-1) | 1,463 (-6%) | 3mo | $228,990 | $157 | 61 |
| 12652 Brown Rd | 0.57mi | 4/2.0 | 1,669 (+8%) | 3mo | $275,000 | $165 | 58 |
Match score weights: distance 35% · size 25% · config 20% · recency 20%. Top-matched comps best support the ARV.
Projected returns pro-forma
-3.0% appreciation · 3.83% rent growth · sell at horizon
- IRR
- -18.4%
- Equity multiple
- 0.35×
- Total profit
- $-44,447
- Equity at exit
- $36,326
- IRR
- -9.2%
- Equity multiple
- 0.41×
- Total profit
- $-40,161
- Equity at exit
- $21,065
Cash invested: $68,217 (down + closing). Projections, not guarantees.
Landlord ↔ Tenant lean methodology
- Overall (STATE)
- 90 Strongly Landlord-Friendly
- State Louisiana
- 90 Strongly Landlord-Friendly · R+12
- County
- — inherits STATE
- City
- — inherits STATE
ZIP-level market 70726
- Rents YoY
- 3.8%
- Active inventory
- 976
- Price-to-rent
- 9.9×
Monthly cashflow live
- Estimated rent
- $1,998 high interval (Pro) →
- Mortgage (P&I)
- −$1,278
- Tax est. 1.5%
- −$305 /mo · $3,654/yr
- Insurance
- −$102
- HOA
- −$0
- Vacancy / Maint / Mgmt
- −$420
- Net cashflow
- $-105
Break-even live
Sensitivity live
| Price | -10% $63 | -5% $-21 | +0% $-105 | +5% $-189 | +10% $-273 |
|---|---|---|---|---|---|
| Rent | -10% $-263 | -5% $-184 | +0% $-105 | +5% $-26 | +10% $53 |
| Rate | -1.0pp $18 | -0.5pp $-43 | base $-105 | +0.5pp $-168 | +1.0pp $-232 |
UW: 25.0% down · 7.5% · 30yr · 1.5% tax · 5.0% vac · 8.0% maint · 8.0% mgmt
Financing live
Cash to close
- Down payment
- $60,908
- Closing costs
- $7,309
- Reserves months
- —
- Total cash needed
- —
Loan-product check · same deal, 3 products live
Conventional
25% down · 7.5% · 30yr
- Down + closing
- —
- Monthly P&I
- —
- Monthly cashflow
- —
- DSCR
- —
- Eligible?
- —
Personal DTI + credit; lowest rate.
DSCR
20% down · 8.5% · 30yr
- Down + closing
- —
- Monthly P&I
- —
- Monthly cashflow
- —
- DSCR
- —
- Eligible?
- —
No personal income docs; deal must DSCR.
Hard money
10% down · 12.0% · 12mo
- Down + closing
- —
- Monthly P&I
- —
- Monthly cashflow
- —
- DSCR
- —
- Eligible?
- —
Short-term bridge; refi at stabilization.
Rent comps 12 comps
| Address | Beds | Baths | Sqft | Rent | $/sqft | DOM | Units | Dist |
|---|---|---|---|---|---|---|---|---|
| 11402 Ashwood Ct Denham Springs, LA | 3.0 | 2.0 | 1331 | $1,750 | $1.31 | 22d | 1 | 0.32mi |
| 11385 Ashwood Ct Denham Springs, LA | 3.0 | 2.0 | 1556 | $1,900 | $1.22 | 44d | 1 | 0.35mi |
| 25717 Raines Ave Dennis Mills, LA | 4.0 | 2.0 | 1568 | $2,200 | $1.40 | 20d | 1 | 0.44mi |
| 25729 Raines Ave Dennis Mills, LA | 4.0 | 2.0 | 1568 | $2,200 | $1.40 | 15d | 1 | 0.44mi |
| 25699 Raines Ave Dennis Mills, LA | 3.0 | 2.0 | 1463 | $1,850 | $1.26 | 44d | 1 | 0.44mi |
| 25699 Raines Ave Dennis Mills, LA | 3.0 | 2.0 | 1463 | $1,850 | $1.26 | 15d | 1 | 0.44mi |
| 25729 Raines Ave Dennis Mills, LA | 4.0 | 2.0 | 1568 | $2,200 | $1.40 | 24d | 1 | 0.44mi |
| 25662 Tarver St , LA | 4.0 | 2.0 | 1570 | $2,000 | $1.27 | 44d | 1 | 0.53mi |
| 24585 Fair Weather Dr Denham Springs, LA | 3.0 | 2.0 | 1451 | $1,850 | $1.27 | 44d | 1 | 0.96mi |
| 11327 Shady Bnd Denham Springs, LA | 4.0 | 2.0 | 1998 | $2,150 | $1.08 | 15d | 1 | 0.98mi |
| 11247 Westwood Ave Denham Springs, LA | 3.0 | 2.0 | 1514 | $1,850 | $1.22 | 44d | 1 | 1.25mi |
| 11342 Woodlore Dr Denham Springs, LA | 3.0 | 2.0 | 1511 | $1,500 | $0.99 | 15d | 1 | 1.42mi |
Listing history 15 events
-
2026-06-18days on market $236,990 Active 483 DOM
-
2026-06-17days on market $236,990 Active 482 DOM
-
2026-06-16days on market $236,990 Active 481 DOM
-
2026-06-15days on market $236,990 Active 480 DOM
-
2026-06-14days on market $236,990 Active 478 DOM
-
2026-06-13days on market $236,990 Active 477 DOM
-
2026-06-10days on market $236,990 Active 475 DOM
-
2026-06-08days on market $236,990 Active 473 DOM
-
2026-06-07days on market $236,990 Active 472 DOM
-
2026-06-03days on market $236,990 Active 468 DOM
-
2026-06-02days on market $236,990 Active 467 DOM
-
2026-06-01days on market $236,990 Active 466 DOM
-
2026-05-31days on market $236,990 Active 465 DOM
-
2026-05-31days on market $236,990 Active 464 DOM
-
2025-02-20$236,990 Active 221-char remark
Show marketing remark (221 chars)
- Open Floor Plan - Four Bedrooms, Two Bathrooms - Two Car Garage - Brick, Stucco, and Siding Exterior - Recessed Can Lighting in Kitchen - Walk-In Master Closet - Double Vanity in Master Bath - Separate Master Shower
ⓘ Source: listings_history table (triggers on properties + properties_extension) + one-shot
backfill from property_details.listing_events for pre-trigger history.
Nearby sold comps map
Loading sold comps map…
Walkable amenities ~0.75 mi
Loading nearby amenities…
Taxation est. · year 1
- Rental income
- $23,982
- − Mortgage interest
- −$13,647
- − Property taxes
- −$3,654
- − Insurance
- −$1,218
- − Repairs & maintenance
- −$1,919
- − Management
- −$1,919
- − Depreciation
- −$7,087
- Taxable loss
- −$5,463
- Est. tax savings @ 24.0%
- +$1,311
- After-tax cash flow
- $52/yr
For passive investors: Depreciation is non-cash, so a rental often shows a tax loss while cash-flowing — sheltering income. Rental losses are passive: they offset passive income freely, and up to $25,000/yr can offset ordinary (W-2) income if you actively participate and your MAGI is under $100k (phasing out to $0 by $150k); unused losses carry forward. On sale, claimed depreciation is recaptured at up to 25%, and gains may owe capital-gains tax (a 1031 exchange can defer both). Figures are a year-1 estimate at your 24.0% rate — not tax advice; consult a CPA.
Condition & rehab AI · 1 photo
This home requires extensive repairs and maintenance, including exterior siding, interior walls, and landscaping. Immediate repairs will significantly improve its resale and rental value.
Repairs flagged
- Major exterior siding — Siding appears to be peeling and in poor condition
- Major interior walls — Paint appears chipped and peeling
- Major roof — No visible damage, but roof condition is unknown
- Major windows — No visible damage, but window condition is unknown
- Major HVAC/mechanicals — No visible damage, but HVAC condition is unknown
- Major landscaping — Landscaping appears overgrown and in poor condition
Value-add opportunities
- Resale exterior siding repair — Repairing peeling siding will improve curb appeal and home value
- Resale interior wall repair — Repairing chipped paint will improve interior appearance and home value
- Both landscaping — Landscaping will improve curb appeal and increase home value
- Rental HVAC maintenance — Maintaining HVAC will improve tenant satisfaction and reduce maintenance costs
Renovation cost estimate screening
| Repair item | Severity | Est. cost |
|---|---|---|
| exterior siding · Siding appears to be peeling and in poor condition | Major | $15,000–50,000 |
| interior walls · Paint appears chipped and peeling | Major | $15,000–50,000 |
| roof · No visible damage, but roof condition is unknown | Major | $15,000–50,000 |
| windows · No visible damage, but window condition is unknown | Major | $15,000–50,000 |
| HVAC/mechanicals · No visible damage, but HVAC condition is unknown | Major | $15,000–50,000 |
| landscaping · Landscaping appears overgrown and in poor condition | Major | $15,000–50,000 |
| Total estimated repair cost · 6 items | $90,000–300,000 |
Value-add ROI direction
- Resale exterior siding repair — Repairing peeling siding will improve curb appeal and home value ↑
- Resale interior wall repair — Repairing chipped paint will improve interior appearance and home value ↑
- Both landscaping — Landscaping will improve curb appeal and increase home value ↑
- Rental HVAC maintenance — Maintaining HVAC will improve tenant satisfaction and reduce maintenance costs ↑
ⓘ Cost ranges are severity-bucket heuristics (US national rule-of-thumb). Get contractor quotes + a written scope before underwriting a rehab budget.
Schools (NCES district)
- District
- Livingston Parish
- NCES district ID
- 2201020
- Math proficiency
- 40% ▼ -38.00%
- Reading proficiency
- 52% ▼ -32.00%
- Median HH income
- $56,755
- Composite
- 40.07/100
- National rank
- #3811
- State rank
- #13 of 98 in LA
Livability — Walker
- Score
- 75/100
- State rank
- #19
- US rank
- #3999
Category grades
Schools grade is shown separately in the Schools card above.
Census & demographics
- County
- Livingston Parish · 87,496 people
- City population
- 23,921
- Metro
- Baton Rouge, LA
- Population (ZIP)
- 63,575
- Household income
- $78,621
- Rent vs Own
- Severe rent burden
- 1211.0
Population outlook (Livingston County) Hauer SSP2
- Today (2025)
- 158,511 people
- By 2030
- 168,241 · +6.1%
- By 2040
- 186,252 · +17.5%
- By 2050
- 201,516 · +27.1%
- By 2075
- 231,217 · +45.9%
- By 2100
- 241,697 · +52.5%
Race, ethnicity, and origin ACS 2023
- Neighborhood character
- Predominantly White (74%)
- Race & ethnicity
- White 74% Black 13% Hispanic / Latino 9% Two or more races 6%
- Hispanic origin (detail)
- Mexican 3%
- Common ancestry
- Lithuanian 9% Serbian 1% Italian 1%
- Foreign-born
- 6% · Canada
- Languages at home
- 91% English-only · Spanish 6% Other Indo-European 1%
Political lean MEDSL · Livingston
- 2024 margin
- Solid R (+68.5) · D 15.1% · R 83.6% · Other 1.3%
- 2008→2024 swing
- +3.4pp toward D · 2008: -71.9pp · 2024: -68.5pp
- All cycles
- 2024: R+68.5 2020: R+70.0 2016: R+72.5 2012: R+70.4 2008: R+71.9
Not yet ingested
- Civics
- —
Market trends
- HPI YoY
- ▼ -104.37%
- Current HPI
- 170.2207
- Rent YoY
- ▲ 3.83%
- Metro
- Baton Rouge, LA
- State GDP YoY
- ▲ 3.29%
- F500 in state
- 10
Industry mix (Fortune 500 HQ in LA)
| Industry | F500 HQs | Revenue |
|---|---|---|
| Telecommunications | 2 | $23B |
|
||
| Utilities | 1 | $12B |
|
||
| Wholesale / Distribution | 1 | $5B |
|
||
| Advertising | 1 | $2B |
|
||
Price history
1 event — show timeline
- 2025-02-20 Listed $236,990 Zillow
Cash-flow waterfall
monthlySold comps — $/sqft
last 12 mo · ≤1 miLoading sold comps…