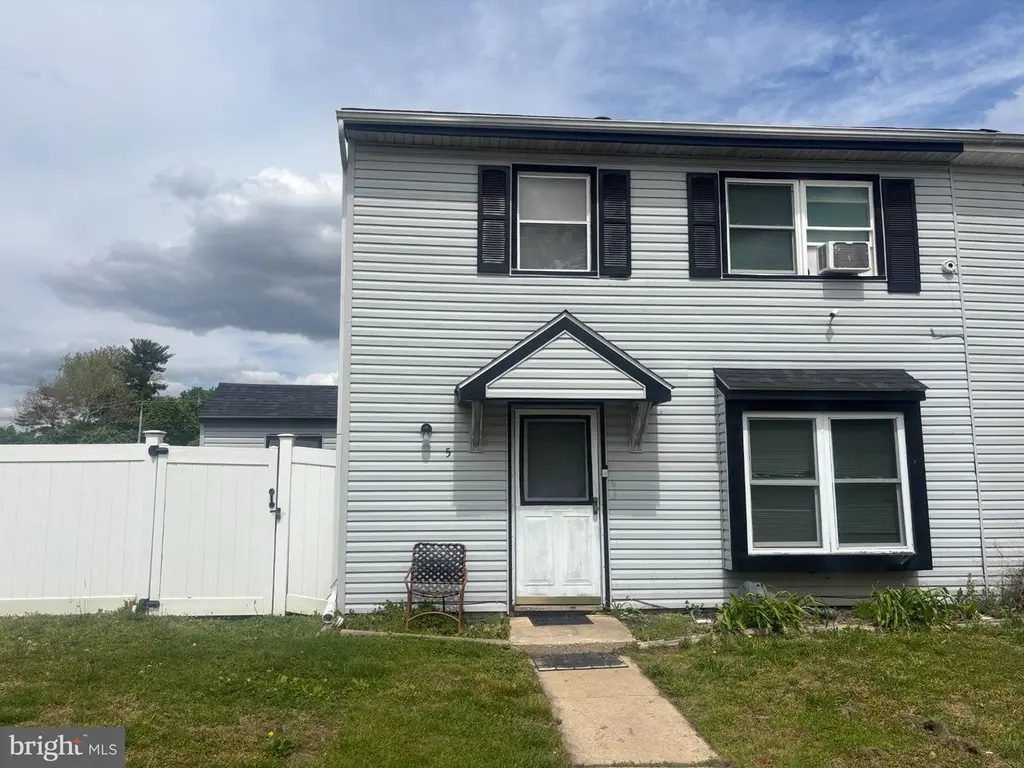
5 Locust Ct · Sicklerville, NJ
Flood risk 1/10 · Minimal
- FEMA flood zone
- X (unshaded)
- Chance of flooding over 30 yrs
- 0.0%
- Est. flood insurance / yr
- $507 – $1,088
Fire risk 4/10 · Minor
- Est. fire insurance / yr
- $526 – $976
Heat risk 7/10 · Major
- Hot days now (above 104°F)
- 7 days/yr
- Hot days in 30 yrs
- 15 days/yr
Wind risk 6/10 · Moderate
- Chance of severe wind over 30 yrs
- 65.0%
Air-quality risk 3/10 · Minor
- Unhealthy air days now
- 2 days/yr
- Unhealthy air days in 30 yrs
- 4 days/yr
Risk factors via First Street. Map © Google.
Why this score? — see what drove the C- grade
The composite is a weighted blend of 9 inputs, each scored 0–100. Each bar is that input's sub-score; the figure is the points it added to the 100-point composite (weight × sub-score).
- Cash flow +21.2/30.0
- ARV discount +7.6/15.0
- DSCR +6.8/10.0
- 1% rule +5.5/10.0
- Rent growth +3.4/5.0
- Livability +2.5/5.0
- Condition / age +2.5/5.0
- Schools +2.3/10.0
- Appreciation +0.0/10.0
$199,900
🖨 Deal sheet 📄 Offer letter ✓ Due diligence
Listing remarks MLS
This Home Shows Real Well, F/P In Lr, Good Closet Space Fenced Yard, Upgraded Exterior, Upgraded Windows, Alarm System, Maintenance Free Exterior, Upgraded Roof, Flat Top Stove, All Offered At A Great Price. Don't Wait!!!!! Bring An Offer, Owner Is Ready To Move,
Key facts
- Two story townhouse
- Living room
- Eat in kitchen
Tags
Property features AI
Finance
- Other: Property manager present; Not in a federal flood zone; Ground rent paid annually
- HOA & community: Monthly HOA fee of $110; HOA covers common area maintenance and trash; Community amenities include basketball courts and common grounds
Exterior
- Parking: Assigned parking (1 space)
- Utilities: Public water; Public sewer; Natural gas available; Electric available; Hot water (natural gas)
- Home design: Condominium; End of row/townhouse; Estimated year built
- Construction: Vinyl siding; Architectural shingle roof; Crawl space foundation
- Exterior features: Sidewalks; Above-grade other structures
Interior
- Kitchen: Dishwasher; Microwave; Electric oven/range; Refrigerator
- Bedrooms: Two bedrooms on the main level
- Flooring: Laminate plank
- Bathrooms: One full bathroom on the main level
- Heating & cooling: Forced air heating (natural gas); Central air conditioning (natural gas cooling fuel)
- Interior features: Tub with shower; Ceiling fans; Eat-in kitchen; Estimated living area
- Laundry & utility: Washer and dryer in unit; Gas dryer
Neighborhood map
What this means for you Summary
Snapshot
- This is a 2-bed/1.0-bath townhouse listed at $200k.
Deal economics
- At list price, monthly cash flow is $289 ($3k/yr) — positive.
- The deal already cash-flows at list — no discount required.
- Meets the 1% rule at list price ($2k rent vs $200k).
- Recommended offer: $197k (1.5% below list) — sets the bar for market timing.
- Cap rate 8.0% vs local median 4.7% in Sicklerville — top-decile yield for the area; either an underpriced asset or a hidden risk that comps aren't pricing in. Stress-test before assuming the spread holds.
Location & tenants
- Location reads: area grade C — affects rentability + tenant quality, not the cash-flow math above.
- Winslow Township School District (suburban): math 11% / reading 36% proficiency, ranked #387 of 472 in NJ (top 82%) — low school quality limits family demand, transient renter base, plan for 1-2y turnover.
- Market conditions: Rents rising (+3.4%/yr); 329 active listings in the ZIP; 1 comparable units currently listed for rent nearby; solid renter incomes; 1,018 units permitted in Camden County in 2024 (509 in 5+ unit buildings).
Forward outlook
- Local home prices are declining (-3.0%/yr); year-one equity from $1k of loan paydown is wiped out by about $6k of value loss. Plan a longer hold.
- Camden County population projected to shrink 8% by 2050 — rents likely to lag national; underwrite the cash flow, not the appreciation.
Negotiation context
- It's been on market 27 days — a 2% lower offer ($197k) is reasonable based on typical stale-listing flexibility.
- 2 sale attempts since 22y ago with the ask held roughly flat each time — persistent listings suggest the price (not the market) is what's stuck; bring a comps-based counter.
- Current owner paid $72k; list at $200k implies a 178% gain — meaningful room to come down on a strong offer.
Risks & watch-outs
- Climate carrying-cost: major wind risk, 65% chance of damaging wind over 30y; extreme-heat days projected 7→15/yr by 2055 (HVAC capex compounding) — expect insurance premiums to compound above CPI over the hold.
Questions for the listing agent
- Built in 1975 — when were the roof, HVAC, electrical panel, plumbing, and water heater last replaced?
- What does the HOA fee cover, when was the last increase, and are there any pending special assessments or reserve-fund shortfalls?
- Is there a deadline driving the sale (1031 exchange, divorce, estate, relocation)? That informs how much negotiation room exists.
- What's the average days-on-market for RENTAL listings here right now (not sales)? A rising rental-DOM trend means longer vacancies and softer asking-rent achievability than the comps imply.
- What's the recent tenant-quality profile in this submarket — average credit score on applications, eviction rate, late-payment / NSF rate, and stable-employment percentage? A property-management company in the area should have these aggregated.
- How much new for-sale + rental construction is in the pipeline within 1–3 miles? Heavy new supply typically softens prices + rents 12–24 months out; constrained supply supports both.
Investment metrics
- 1% rule
- 1.05% ✓
- Cap rate
- 8.03%
- Cash-on-cash
- 6.20%
- DSCR
- 1.28
- GRM
- 7.9
CMA / ARV
- ARV (on-the-fly)
- $200,376
- Comps found
- 12
Show comp detail 12 sales within ~0.75 mi
| Address | Dist | Beds/Ba | Sqft | Sold | Price | $/sf | Match |
|---|---|---|---|---|---|---|---|
| 10 Longbow Ct | 0.05mi | 2/1.0 | 968 (0%) | 3mo | $185,000 | $191 | 95 |
| 15 Lawrence Ct | 0.06mi | 2/1.0 | 968 (0%) | 3mo | $189,900 | $196 | 94 |
| 7 Lyric Ct | 0.14mi | 2/1.0 | 968 (0%) | 1mo | $200,000 | $207 | 93 |
| 3 Linden Ct | 0.14mi | 2/1.0 | 968 (0%) | 3mo | $200,000 | $207 | 91 |
| 9 Linden Ct | 0.13mi | 2/1.0 | 968 (0%) | 4mo | $170,000 | $176 | 90 |
| 7 Lennox Ct | 0.14mi | 2/1.0 | 968 (0%) | 6mo | $212,000 | $219 | 88 |
| 23 Lennox Ct | 0.15mi | 2/1.0 | 968 (0%) | 6mo | $199,500 | $206 | 88 |
| 24 Lennox Ct | 0.15mi | 2/1.0 | 968 (0%) | 6mo | $194,000 | $200 | 88 |
| 21 Locust Ct | 0.02mi | 3/1.0 (+1) | 1,034 (+7%) | 2mo | $220,000 | $213 | 81 |
| 9 Lawrence Ct | 0.09mi | 3/1.0 (+1) | 1,034 (+7%) | 0mo | $234,900 | $227 | 79 |
| 18 Langdon Ct | 0.11mi | 3/1.0 (+1) | 1,034 (+7%) | 3mo | $225,000 | $218 | 76 |
| 13 Lamont Ct | 0.07mi | 3/1.5 (+1) | 1,034 (+7%) | 4mo | $229,999 | $222 | 76 |
Match score weights: distance 35% · size 25% · config 20% · recency 20%. Top-matched comps best support the ARV.
Projected returns pro-forma
-3.0% appreciation · 3.41% rent growth · sell at horizon
- IRR
- -6.3%
- Equity multiple
- 0.77×
- Total profit
- $-13,069
- Equity at exit
- $29,806
- IRR
- 3.9%
- Equity multiple
- 1.29×
- Total profit
- $16,070
- Equity at exit
- $17,284
Cash invested: $55,972 (down + closing). Projections, not guarantees.
Landlord ↔ Tenant lean methodology
- Overall (STATE)
- 21 Tenant-Leaning
- State New Jersey
- 21 Tenant-Leaning · D+6
- County
- — inherits STATE
- City
- — inherits STATE
ZIP-level market 08081
- Rents YoY
- 3.4%
- Active inventory
- 329
- Price-to-rent
- 7.9×
Monthly cashflow live
- Estimated rent
- $2,108 medium interval (Pro) →
- Mortgage (P&I)
- −$1,048
- Tax from tax record
- −$135 /mo · $1,615/yr
- Insurance
- −$83
- HOA
- −$110
- Vacancy / Maint / Mgmt
- −$443
- Net cashflow
- $289
Break-even live
UW: 25.0% down · 7.5% · 30yr · 1.5% tax · 5.0% vac · 8.0% maint · 8.0% mgmt
Financing live
Cash to close
- Down payment
- $49,975
- Closing costs
- $5,997
- Reserves months
- —
- Total cash needed
- —
Loan-product check · same deal, 3 products live
Conventional
25% down · 7.5% · 30yr
- Down + closing
- —
- Monthly P&I
- —
- Monthly cashflow
- —
- DSCR
- —
- Eligible?
- —
Personal DTI + credit; lowest rate.
DSCR
20% down · 8.5% · 30yr
- Down + closing
- —
- Monthly P&I
- —
- Monthly cashflow
- —
- DSCR
- —
- Eligible?
- —
No personal income docs; deal must DSCR.
Hard money
10% down · 12.0% · 12mo
- Down + closing
- —
- Monthly P&I
- —
- Monthly cashflow
- —
- DSCR
- —
- Eligible?
- —
Short-term bridge; refi at stabilization.
Rent comps 1 comps
| Address | Beds | Baths | Sqft | Rent | $/sqft | DOM | Units | Dist |
|---|---|---|---|---|---|---|---|---|
| 3 Lawrence Ct Sicklerville, NJ | 2.0 | 1.0 | 968 | $1,850 | $1.91 | 1d | 1 | 0.13mi |
HOA detail
- Monthly dues
- $110 · $1,320/yr
Listing history 22 events
-
2026-06-18days on market $199,900 Active 27 DOM
-
2026-06-17days on market $199,900 Active 26 DOM
-
2026-06-16days on market $199,900 Active 25 DOM
-
2026-06-15days on market $199,900 Active 24 DOM
-
2026-06-13days on market $199,900 Active 22 DOM
-
2026-06-09days on market $199,900 Active 18 DOM
-
2026-06-08days on market $199,900 Active 17 DOM
-
2026-06-07days on market $199,900 Active 16 DOM
-
2026-06-04days on market $199,900 Active 13 DOM
-
2026-06-03days on market $199,900 Active 12 DOM
-
2026-06-02days on market $199,900 Active 11 DOM
-
2026-06-01days on market $199,900 Active 10 DOM
-
2026-05-31days on market $199,900 Active 9 DOM
-
2026-05-22$199,900 Active
-
2009-11-20soldstatus $72,000
-
2005-02-01soldstatus $54,900
-
2004-12-15soldstatus $54,900 265-char remark
Show marketing remark (265 chars)
This Home Shows Real Well, F/P In Lr, Good Closet Space Fenced Yard, Upgraded Exterior, Upgraded Windows, Alarm System, Maintenance Free Exterior, Upgraded Roof, Flat Top Stove, All Offered At A Great Price. Don't Wait!!!!! Bring An Offer, Owner Is Ready To Move,
-
2004-11-04historical 265-char remark
Show marketing remark (265 chars)
This Home Shows Real Well, F/P In Lr, Good Closet Space Fenced Yard, Upgraded Exterior, Upgraded Windows, Alarm System, Maintenance Free Exterior, Upgraded Roof, Flat Top Stove, All Offered At A Great Price. Don't Wait!!!!! Bring An Offer, Owner Is Ready To Move,
-
2004-04-06$54,900 265-char remark
Show marketing remark (265 chars)
This Home Shows Real Well, F/P In Lr, Good Closet Space Fenced Yard, Upgraded Exterior, Upgraded Windows, Alarm System, Maintenance Free Exterior, Upgraded Roof, Flat Top Stove, All Offered At A Great Price. Don't Wait!!!!! Bring An Offer, Owner Is Ready To Move,
-
1989-08-25soldstatus $44,028
-
1987-01-15soldstatus $42,000
-
1979-03-01soldstatus $28,500
ⓘ Source: listings_history table (triggers on properties + properties_extension) + one-shot
backfill from property_details.listing_events for pre-trigger history.
Tax reassessment forecast NJ · Partial reset (capped growth)
- Current annual tax
- $1,615 · $135/mo
- Projected year-2 tax
- $3,296 · $275/mo
- Expected delta
- +$1,681/yr (+$140/mo · 104.1%)
ⓘ Screening estimate from a state-policy table — verify with the county assessor before closing.
Climate risk First Street
- Flood 1/10 Low FEMA zone X (unshaded) · 0% chance over 30 yrs
- Wildfire 4/10 Moderate
- Heat 7/10 Severe 7 d/yr ≥104°F today · 15 d/yr by 30 yrs out
- Wind 6/10 Major 65% chance of damaging wind over 30 yrs
- Air quality 3/10 Moderate 2 unhealthy d/yr today · 4 by 30 yrs out
Nearby sold comps map
Loading sold comps map…
Walkable amenities ~0.75 mi
Loading nearby amenities…
Taxation est. · year 1
- Rental income
- $25,297
- − Mortgage interest
- −$11,198
- − Property taxes
- −$1,615
- − Insurance
- −$1,000
- − Repairs & maintenance
- −$2,024
- − Management
- −$2,024
- − HOA
- −$1,320
- − Depreciation
- −$5,815
- Taxable income
- $302
- Est. tax owed @ 24.0%
- −$73
- After-tax cash flow
- $3,398/yr
For passive investors: Depreciation is non-cash, so a rental often shows a tax loss while cash-flowing — sheltering income. Rental losses are passive: they offset passive income freely, and up to $25,000/yr can offset ordinary (W-2) income if you actively participate and your MAGI is under $100k (phasing out to $0 by $150k); unused losses carry forward. On sale, claimed depreciation is recaptured at up to 25%, and gains may owe capital-gains tax (a 1031 exchange can defer both). Figures are a year-1 estimate at your 24.0% rate — not tax advice; consult a CPA.
Schools (NCES district)
- District
- Winslow Township School District
- NCES district ID
- 3418060
- Math proficiency
- 11% ▼ -17.00%
- Reading proficiency
- 36% ▼ -5.00%
- Median HH income
- $70,254
- Composite
- 22.65/100
- National rank
- #8057
- State rank
- #387 of 472 in NJ
Livability — Sicklerville
No livability data for this city. (Only ~50 U.S. cities are tracked.)
Census & demographics
- Census place
- Sicklerville, NJ
- County
- Camden County · 407,624 people
- City population
- 50,264
- Metro
- Philadelphia-Camden-Wilmington, PA-NJ-DE-MD
- Population (ZIP)
- 50,264
- Household income
- $105,800
- Rent vs Own
- Severe rent burden
- 979.0
Population outlook (Camden County) Hauer SSP2
- Today (2025)
- 507,964 people
- By 2030
- 502,182 · -1.1%
- By 2040
- 485,602 · -4.4%
- By 2050
- 465,630 · -8.3%
- By 2075
- 419,986 · -17.3%
- By 2100
- 369,492 · -27.3%
Race, ethnicity, and origin ACS 2023
- Neighborhood character
- Diverse neighborhood (Simpson 0.65)
- Race & ethnicity
- White 47% Black 34% Two or more races 9% Hispanic / Latino 9% Asian 4%
- Hispanic origin (detail)
- Puerto Rican 5%
- Common ancestry
- Romanian 6% Slovak 2% Iranian 1%
- Foreign-born
- 8% · Canada, China, South Korea
- Languages at home
- 90% English-only · Spanish 4% Other Indo-European 1% Tagalog/Filipino 1%
Political lean MEDSL · Camden
- 2024 margin
- Strong D (+27.4) · D 63.0% · R 35.5% · Other 1.5%
- 2008→2024 swing
- -8.8pp toward R · 2008: 36.2pp · 2024: 27.4pp
- All cycles
- 2024: D+27.4 2020: D+33.5 2016: D+32.4 2012: D+36.6 2008: D+36.2
Not yet ingested
- Civics
- —
Market trends
- HPI YoY
- ▼ -176.48%
- Current HPI
- 303.1017
- Rent YoY
- ▲ 3.41%
- Metro
- Philadelphia-Camden-Wilmington, PA-NJ-DE-MD
- State GDP YoY
- ▲ 2.05%
- F500 in state
- 34
Industry mix (Fortune 500 HQ in NJ)
| Industry | F500 HQs | Revenue |
|---|---|---|
| Consumer Goods | 3 | $31B |
|
||
| Pharmaceuticals | 2 | $153B |
|
||
| Technology | 2 | $21B |
|
||
| Insurance | 2 | $20B |
|
||
| Healthcare | 2 | $19B |
|
||
| Financial Services | 1 | $70B |
|
||
Price history
+601.4% since first listed9 events — show timeline
- 2026-05-22 Listed $199,900 BRIGHT MLS
- 2009-11-20 Sold (Public Records) $72,000 Public Records
- 2005-02-01 Sold (Public Records) $54,900 Public Records
- 2004-12-15 Sold (MLS) $54,900 BRIGHT MLS
- 2004-11-04 Listing Removed — BRIGHT MLS
- 2004-04-06 Listed $54,900 BRIGHT MLS
- 1989-08-25 Sold (Public Records) $44,028 Public Records
- 1987-01-15 Sold (Public Records) $42,000 Public Records
- 1979-03-01 Sold (Public Records) $28,500 Public Records
Property tax history
-1.2%/yrLatest (2025): $1,615 · +1.9% YoY. Source: county tax records.
Cash-flow waterfall
monthlySold comps — $/sqft
last 12 mo · ≤1 miLoading sold comps…