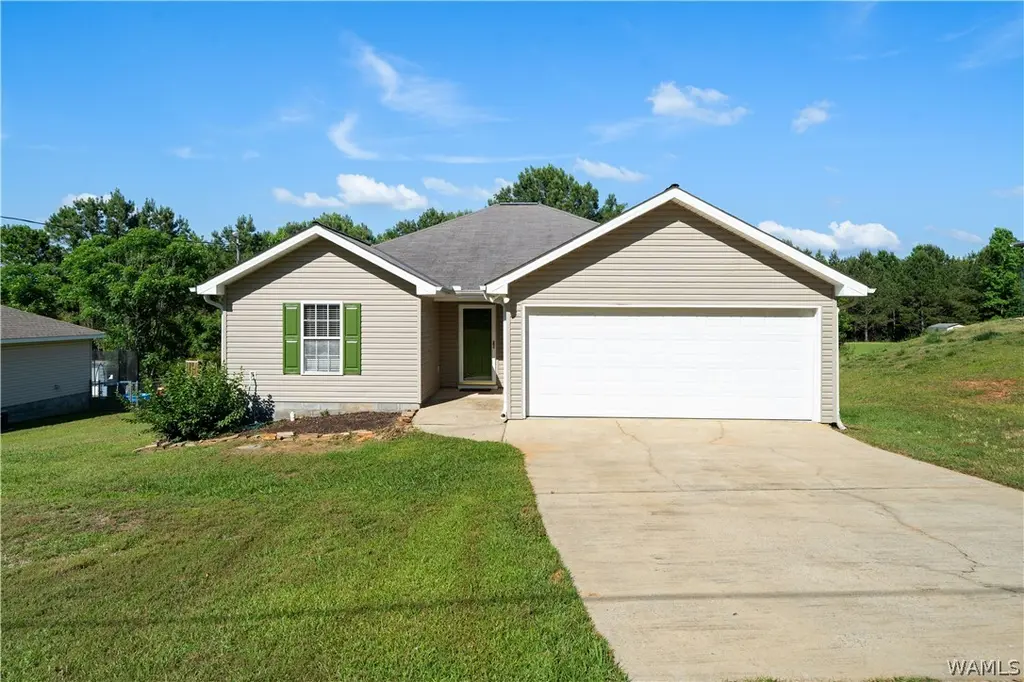
16623 Old Fayette Rd · Tuscaloosa, AL
Flood risk 1/10 · Minimal
- FEMA flood zone
- X (unshaded)
- Chance of flooding over 30 yrs
- 0.0%
- Est. flood insurance / yr
- $507 – $1,088
Fire risk 5/10 · Moderate
- Est. fire insurance / yr
- $916 – $1,700
Heat risk 6/10 · Moderate
- Hot days now (above 108°F)
- 7 days/yr
- Hot days in 30 yrs
- 19 days/yr
Wind risk 6/10 · Moderate
- Chance of severe wind over 30 yrs
- 40.0%
Air-quality risk 2/10 · Minimal
- Unhealthy air days now
- 2 days/yr
- Unhealthy air days in 30 yrs
- 2 days/yr
Risk factors via First Street. Map © Google.
Why this score? — see what drove the F grade
The composite is a weighted blend of 9 inputs, each scored 0–100. Each bar is that input's sub-score; the figure is the points it added to the 100-point composite (weight × sub-score).
- Cash flow +14.6/30.0
- DSCR +4.5/10.0
- Livability +3.9/5.0
- 1% rule +2.9/10.0
- Schools +2.9/10.0
- Rent growth +2.5/5.0
- Condition / age +2.5/5.0
- ARV discount +0.0/15.0
- Appreciation +0.0/10.0
$229,900
🖨 Deal sheet (PDF) 📄 Offer letter ✓ Due diligence
Listing remarks MLS
SOLD BEFORE PUBLISHED
Key facts
- Cozy breakfast nook
- Half-acre lot
- Ample cabinetry
Tags
Property features AI
Finance
- Other: Paved road access; Lot about 0.72 acres; Subdivision: Rebekah's View
Exterior
- Parking: Attached garage; 2 garage spaces; Driveway; Concrete surfaces
- Utilities: Septic tank
- Home design: Single-family residence; One story; Vinyl siding
- Construction: Vinyl siding construction; Composition/shingle roof
- Exterior features: Covered patio
Interior
- Kitchen: Dishwasher; Electric oven; Electric range; Microwave; Refrigerator; Water heater
- Bathrooms: 2 full bathrooms
- Heating & cooling: Electric heating; Heat pump; Ceiling fan cooling
- Interior features: Ceiling fans; Pantry
- Laundry & utility: Laundry closet
Neighborhood map
What this means for you Summary
Snapshot
- This is a 3-bed/1.0-bath single-family listed at $230k.
Deal economics
- At list price, monthly cash flow is $57 ($680/yr) — positive.
- The deal already cash-flows at list — no discount required.
- To meet the 1% rule (rent ≥ 1% of price), the offer needs to be $183k (20.6% below list).
- Recommended offer: $183k (20.6% below list) — sets the bar for 1% rule.
- Cap rate 6.6% vs local median 3.4% in Tuscaloosa — top-decile yield for the area; either an underpriced asset or a hidden risk that comps aren't pricing in. Stress-test before assuming the spread holds.
Location & tenants
- Location reads 77/100 on livability (#9 in AL, #2,909 nationally) — a middle-class / working-renter tenant base. Strengths: amenities A+, health & safety A+, cost of living A; Watch: crime F, employment D-.
- Tuscaloosa County (suburban): math 21% / reading 45% proficiency, ranked #47 of 129 in AL (top 36%) — families likely to look elsewhere, expect single-tenant / working-renter base with shorter leases.
- Zoned schools: Walker Elementary School (math 49% / reading 63%, grade C+, #83 of 627 statewide, top 13%, 760 students, 43% FRL); Northside Middle School (math 22% / reading 49%, grade F, #81 of 257 statewide, top 33%, 405 students, 45% FRL); Northside High School (math 32% / reading 27%, grade F, #70 of 305 statewide, top 27%, 494 students, 50% FRL) — zoned schools at 46% FRL track the district average.
- Market conditions: 242 active listings in the ZIP; solid renter incomes; 622 units permitted in Tuscaloosa County in 2024 (69 in 5+ unit buildings).
Forward outlook
- Local home prices are declining (-3.0%/yr); year-one equity from $2k of loan paydown is wiped out by about $7k of value loss. Plan a longer hold.
- Tuscaloosa County population projected at +26% by 2050 — long-run rental-demand tailwind backs the buy-and-hold thesis.
Negotiation context
- Only 7 days on market — expect competitive offers; lowballing is unlikely to land.
- 4 sale attempts since 11y ago with the ask held roughly flat each time — persistent listings suggest the price (not the market) is what's stuck; bring a comps-based counter.
- Current owner paid $190k; 21% above their basis — modest negotiation headroom, anchor on the comps not their cost.
Risks & watch-outs
- Climate carrying-cost: major wind risk, 40% chance of damaging wind over 30y; moderate wildfire risk; extreme-heat days projected 7→19/yr by 2055 (HVAC capex compounding) — expect insurance premiums to compound above CPI over the hold.
Questions for the listing agent
- Is there a deadline driving the sale (1031 exchange, divorce, estate, relocation)? That informs how much negotiation room exists.
- Crime grade is F in this area — have there been break-ins, vandalism, or insurance claims at this property in the last 3 years? What carrier currently insures it and at what premium?
- The area grade is low — what's the realistic commute time and amenity access for the typical tenant pool here? Any planned neighborhood developments (good or bad) we should know about?
- What's the average days-on-market for RENTAL listings here right now (not sales)? A rising rental-DOM trend means longer vacancies and softer asking-rent achievability than the comps imply.
- What's the recent tenant-quality profile in this submarket — average credit score on applications, eviction rate, late-payment / NSF rate, and stable-employment percentage? A property-management company in the area should have these aggregated.
- How much new for-sale + rental construction is in the pipeline within 1–3 miles? Heavy new supply typically softens prices + rents 12–24 months out; constrained supply supports both.
Investment metrics
- 1% rule
- 0.79% ✗
- Cap rate
- 6.59%
- Cash-on-cash
- 1.06%
- DSCR
- 1.05
- GRM
- 10.5
CMA / ARV
- ARV (on-the-fly)
- $195,223
- Comps found
- 1
Show comp detail 1 sale within ~0.75 mi
| Address | Dist | Beds/Ba | Sqft | Sold | Price | $/sf | Match |
|---|---|---|---|---|---|---|---|
| 16549 Old Fayette Rd | 0.20mi | 4/2.0 (+1) | 1,200 (+3%) | 15mo | $200,000 | $167 | 65 |
Match score weights: distance 35% · size 25% · config 20% · recency 20%. Top-matched comps best support the ARV.
Projected returns pro-forma
-3.0% appreciation · 3.0% rent growth · sell at horizon
- IRR
- -14.7%
- Equity multiple
- 0.48×
- Total profit
- $-33,741
- Equity at exit
- $34,279
- IRR
- -6.1%
- Equity multiple
- 0.61×
- Total profit
- $-25,127
- Equity at exit
- $19,878
Cash invested: $64,372 (down + closing). Projections, not guarantees.
Landlord ↔ Tenant lean methodology
- Overall (STATE)
- 90 Strongly Landlord-Friendly
- State Alabama
- 90 Strongly Landlord-Friendly · R+15
- County
- — inherits STATE
- City
- — inherits STATE
ZIP-level market 35475
- Home prices YoY
- -20.8%
- Active inventory
- 242
- Price-to-rent
- 10.5×
Monthly cashflow live
- Estimated rent
- $1,826 medium interval (Pro) →
- Mortgage (P&I)
- −$1,206
- Tax from tax record
- −$85 /mo · $1,016/yr
- Insurance
- −$96
- HOA
- −$0
- Vacancy / Maint / Mgmt
- −$384
- Net cashflow
- $57
Break-even live
Sensitivity live
| Price | -10% $187 | -5% $122 | +0% $57 | +5% $-8 | +10% $-73 |
|---|---|---|---|---|---|
| Rent | -10% $-88 | -5% $-15 | +0% $57 | +5% $129 | +10% $201 |
| Rate | -1.0pp $172 | -0.5pp $115 | base $57 | +0.5pp $-3 | +1.0pp $-63 |
UW: 25.0% down · 7.5% · 30yr · 1.5% tax · 5.0% vac · 8.0% maint · 8.0% mgmt
Financing live
Cash to close
- Down payment
- $57,475
- Closing costs
- $6,897
- Reserves months
- —
- Total cash needed
- —
Loan-product check · same deal, 3 products live
Conventional
25% down · 7.5% · 30yr
- Down + closing
- —
- Monthly P&I
- —
- Monthly cashflow
- —
- DSCR
- —
- Eligible?
- —
Personal DTI + credit; lowest rate.
DSCR
20% down · 8.5% · 30yr
- Down + closing
- —
- Monthly P&I
- —
- Monthly cashflow
- —
- DSCR
- —
- Eligible?
- —
No personal income docs; deal must DSCR.
Hard money
10% down · 12.0% · 12mo
- Down + closing
- —
- Monthly P&I
- —
- Monthly cashflow
- —
- DSCR
- —
- Eligible?
- —
Short-term bridge; refi at stabilization.
Listing history 12 events
-
2026-05-19$229,900 Active
-
2022-04-29soldstatus $190,000
-
2022-04-28soldstatus $190,000 21-char remark
Show marketing remark (21 chars)
SOLD BEFORE PUBLISHED
-
2022-03-07$190,000 21-char remark
Show marketing remark (21 chars)
SOLD BEFORE PUBLISHED
-
2017-01-27soldstatus $140,000
-
2017-01-25soldstatus $138,900 335-char remark
Show marketing remark (335 chars)
Country setting , close to town, Lake Tuscaloosa, shopping schools, This Magnificent home, move in ready, has 3 bedroom, 2 bath , double pantry, laundry closet, 2 car garage, covered back porch with large back yard for all those family outings , lots of storage, freshly painted. storage building CALL FOR YOUR PRIVATE SHOWING TODAY.
-
2016-08-28$138,900 335-char remark
Show marketing remark (335 chars)
Country setting , close to town, Lake Tuscaloosa, shopping schools, This Magnificent home, move in ready, has 3 bedroom, 2 bath , double pantry, laundry closet, 2 car garage, covered back porch with large back yard for all those family outings , lots of storage, freshly painted. storage building CALL FOR YOUR PRIVATE SHOWING TODAY.
-
2016-01-05soldstatus $132,500
-
2016-01-05soldstatus $141,500
-
2015-11-09$134,900
-
2010-07-01soldstatus $125,386
-
2007-11-02soldstatus $124,000
ⓘ Source: listings_history table (triggers on properties + properties_extension) + one-shot
backfill from property_details.listing_events for pre-trigger history.
Tax reassessment forecast AL · Resets to sale price
- Current annual tax
- $1,016 · $85/mo
- Projected year-2 tax
- $1,016 · $85/mo
- Expected delta
- $0/yr ($0/mo · 0.0%)
ⓘ Screening estimate from a state-policy table — verify with the county assessor before closing.
Climate risk First Street
- Flood 1/10 Low FEMA zone X (unshaded) · 0% chance over 30 yrs
- Wildfire 5/10 Major
- Heat 6/10 Major 7 d/yr ≥108°F today · 19 d/yr by 30 yrs out
- Wind 6/10 Major 40% chance of damaging wind over 30 yrs
- Air quality 2/10 Low 2 unhealthy d/yr today · 2 by 30 yrs out
Nearby sold comps map
Loading sold comps map…
Walkable amenities ~0.75 mi
Loading nearby amenities…
Taxation est. · year 1
- Rental income
- $21,915
- − Mortgage interest
- −$12,878
- − Property taxes
- −$1,016
- − Insurance
- −$1,150
- − Repairs & maintenance
- −$1,753
- − Management
- −$1,753
- − Depreciation
- −$6,688
- Taxable loss
- −$3,323
- Est. tax savings @ 24.0%
- +$797
- After-tax cash flow
- $1,478/yr
For passive investors: Depreciation is non-cash, so a rental often shows a tax loss while cash-flowing — sheltering income. Rental losses are passive: they offset passive income freely, and up to $25,000/yr can offset ordinary (W-2) income if you actively participate and your MAGI is under $100k (phasing out to $0 by $150k); unused losses carry forward. On sale, claimed depreciation is recaptured at up to 25%, and gains may owe capital-gains tax (a 1031 exchange can defer both). Figures are a year-1 estimate at your 24.0% rate — not tax advice; consult a CPA.
Schools (NCES district)
- District
- Tuscaloosa County
- NCES district ID
- 0103390
- Math proficiency
- 21% ▼ -24.00%
- Reading proficiency
- 45% ▲ 2.00%
- Median HH income
- $53,000
- Composite
- 28.88/100
- National rank
- #6641
- State rank
- #47 of 129 in AL
Livability — Tuscaloosa
- Score
- 77/100
- State rank
- #9
- US rank
- #2909
Category grades
Schools grade is shown separately in the Schools card above.
Census & demographics
- County
- Tuscaloosa County · 206,491 people
- City population
- 134,228
- Metro
- Tuscaloosa, AL
- Population (ZIP)
- 20,745
- Household income
- $108,559
- Rent vs Own
- Severe rent burden
- 49.0
Population outlook (Tuscaloosa County) Hauer SSP2
- Today (2025)
- 228,293 people
- By 2030
- 240,551 · +5.4%
- By 2040
- 263,856 · +15.6%
- By 2050
- 286,491 · +25.5%
- By 2075
- 335,783 · +47.1%
- By 2100
- 370,520 · +62.3%
Race, ethnicity, and origin ACS 2023
- Neighborhood character
- Predominantly White (94%)
- Race & ethnicity
- White 94% Black 3% Hispanic / Latino 2% Two or more races 2%
- Common ancestry
- Italian 5% Lithuanian 2% Slovak 1%
- Foreign-born
- 2% · Canada
- Languages at home
- 98% English-only · Spanish 1%
Political lean MEDSL · Tuscaloosa
- 2024 margin
- Strong R (+20.4) · D 39.4% · R 59.8%
- 2008→2024 swing
- -4.4pp toward R · 2008: -16.0pp · 2024: -20.4pp
- All cycles
- 2024: R+20.4 2020: R+14.8 2016: R+19.5 2012: R+17.4 2008: R+16.0
Not yet ingested
- Civics
- —
Market trends
- HPI YoY
- ▼ -59.83%
- Current HPI
- 228.4417
- Rent YoY
- —
- Metro
- Tuscaloosa, AL
- State GDP YoY
- ▲ 2.94%
- F500 in state
- 4
Industry mix (Fortune 500 HQ in AL)
| Industry | F500 HQs | Revenue |
|---|---|---|
| Financial Services | 1 | $8B |
|
||
| Healthcare | 1 | $5B |
|
||
Price history
+85.4% since first listed13 events — show timeline
- 2026-05-26 Pending — WAMLS
- 2026-05-19 Listed $229,900 WAMLS
- 2022-04-29 Sold (Public Records) $190,000 Public Records
- 2022-04-28 Sold (MLS) $190,000 WAMLS
- 2022-03-07 Listed $190,000 WAMLS
- 2017-01-27 Sold (Public Records) $140,000 Public Records
- 2017-01-25 Sold (MLS) $138,900 WAMLS
- 2016-08-28 Listed $138,900 WAMLS
- 2016-01-05 Sold (Public Records) $141,500 Public Records
- 2016-01-05 Sold (MLS) $132,500 WAMLS
- 2015-11-09 Listed $134,900 WAMLS
- 2010-07-01 Sold (Public Records) $125,386 Public Records
- 2007-11-02 Sold (Public Records) $124,000 Public Records
Property tax history
+12.2%/yrLatest (2025): $1,016 · +4.7% YoY. Source: county tax records.
Cash-flow waterfall
monthlySold comps — $/sqft
last 12 mo · ≤1 miLoading sold comps…