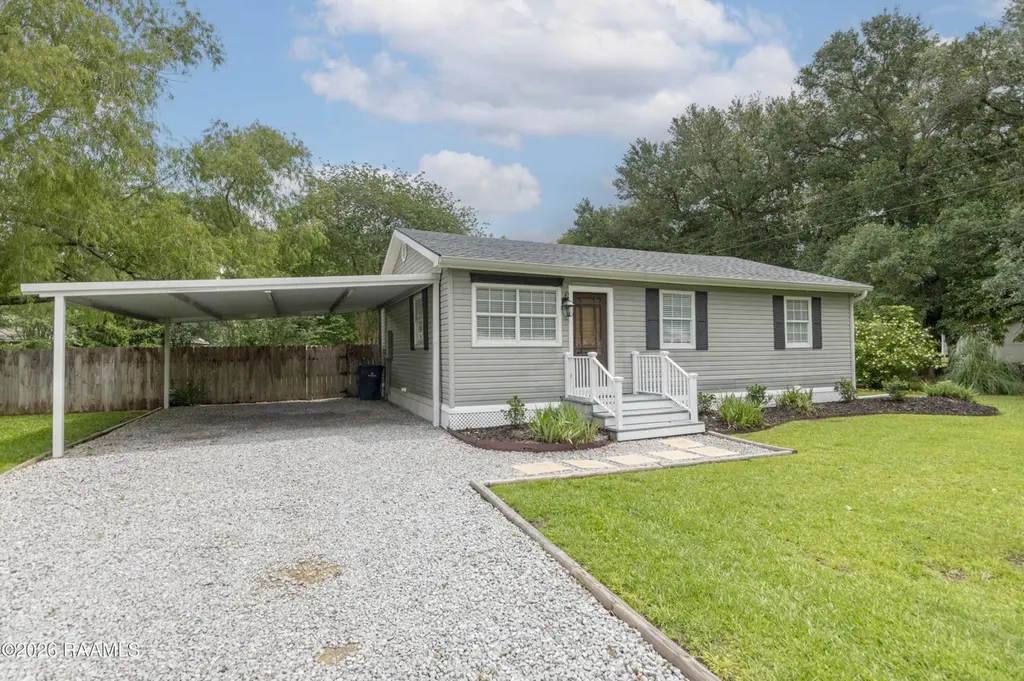
7147 Clyve Rd · Milton, LA
Flood risk 1/10 · Minimal
- FEMA flood zone
- X (unshaded)
- Chance of flooding over 30 yrs
- 0.0%
- Est. flood insurance / yr
- $507 – $1,088
Fire risk 1/10 · Minimal
- Est. fire insurance / yr
- $1,269 – $2,357
Heat risk 9/10 · Severe
- Hot days now (above 108°F)
- 7 days/yr
- Hot days in 30 yrs
- 21 days/yr
Wind risk 9/10 · Severe
- Chance of severe wind over 30 yrs
- 99.0%
Air-quality risk 1/10 · Minimal
- Unhealthy air days now
- 0 days/yr
- Unhealthy air days in 30 yrs
- 0 days/yr
Risk factors via First Street. Map © Google.
Why this score? — see what drove the C- grade
The composite is a weighted blend of 9 inputs, each scored 0–100. Each bar is that input's sub-score; the figure is the points it added to the 100-point composite (weight × sub-score).
- Cash flow +20.1/30.0
- ARV discount +7.5/15.0
- DSCR +6.4/10.0
- 1% rule +4.4/10.0
- Schools +3.9/10.0
- Livability +3.4/5.0
- Rent growth +2.5/5.0
- Condition / age +2.5/5.0
- Appreciation +0.0/10.0
$185,000
🖨 Deal sheet 📄 Offer letter ✓ Due diligence
Listing remarks MLS
This 3 Bedroom 2 Bath home is in a great location. A large deck in back with a hot tub built in. Needs some improvements, great for an investor or a young couple just starting out. Call and schedule a showing today!!
Key facts
- Fenced in yard
- New roof
- 0.41 acre lot
Tags
Property features AI
Exterior
- Parking: Carport (2 covered spaces, total parking for 2)
- Utilities: Septic tank; Electric service: SLEMCO
- Home design: Single-family residence; Garden/Patio style; Dead-end and parish road frontage
- Construction: Vinyl siding with frame construction; Composition roof
- Exterior features: Deck; Shed/storage; Privacy wood fencing
Interior
- Kitchen: Dishwasher; Electric cooktop; Electric stove; Microwave; Refrigerator
- Flooring: Vinyl plank
- Bathrooms: 2 full bathrooms
- Heating & cooling: Central heating (electric); Central air conditioning
- Interior features: Beamed ceilings; Tile countertops; Double-pane windows; Lighting
- Laundry & utility: Electric dryer hookup
Neighborhood map
What this means for you Summary
Snapshot
- This is a 3-bed/2.0-bath single-family listed at $185k.
Deal economics
- At list price, monthly cash flow is $232 ($3k/yr) — positive.
- The deal already cash-flows at list — no discount required.
- To meet the 1% rule (rent ≥ 1% of price), the offer needs to be $175k (5.6% below list).
- Recommended offer: $175k (5.6% below list) — sets the bar for 1% rule.
- Cap rate 7.8% vs local median 4.6% in Milton — top-decile yield for the area; either an underpriced asset or a hidden risk that comps aren't pricing in. Stress-test before assuming the spread holds.
Location & tenants
- Location reads 68/100 on livability (#89 in LA) — a middle-class / working-renter tenant base. Strengths: crime A+, employment A+, housing A+; Watch: amenities F, commute F, health & safety F.
- Vermilion Parish (town): math 40% / reading 53% proficiency, ranked #15 of 98 in LA (top 15%) — families likely to look elsewhere, expect single-tenant / working-renter base with shorter leases.
- Zoned schools: Cecil Picard Elementary School At Maurice (math 61% / reading 68%, grade B, #40 of 646 statewide, top 7%, 845 students, 42% FRL); North Vermilion Middle School (math 47% / reading 53%, grade C, #26 of 218 statewide, top 12%, 656 students, 45% FRL); North Vermilion High School (math 57% / reading 63%, grade C+, #20 of 265 statewide, top 7%, 854 students, 44% FRL).
- Market conditions: 248 active listings in the ZIP; 4 comparable units currently listed for rent nearby; rentals at typical pace (median 21d on market — plan ~3-4 weeks tenant-placement turnaround); solid renter incomes; 228 units permitted in Vermilion Parish in 2024 (0 in 5+ unit buildings).
Forward outlook
- Local home prices are declining (-3.0%/yr); year-one equity from $1k of loan paydown is wiped out by about $6k of value loss. Plan a longer hold.
- Vermilion County population projected at +10% by 2050 — modest demand growth; plan on rents tracking national, not racing it.
Negotiation context
- Only 14 days on market — expect competitive offers; lowballing is unlikely to land.
- 4 sale attempts since 20y ago with the ask held roughly flat each time — persistent listings suggest the price (not the market) is what's stuck; bring a comps-based counter.
- Current owner paid $68k; list at $185k implies a 171% gain — meaningful room to come down on a strong offer.
Risks & watch-outs
- Climate carrying-cost: severe wind risk, 99% chance of damaging wind over 30y; extreme-heat days projected 7→21/yr by 2055 (HVAC capex compounding) — expect insurance premiums to compound above CPI over the hold.
Questions for the listing agent
- Is there a deadline driving the sale (1031 exchange, divorce, estate, relocation)? That informs how much negotiation room exists.
- Schools are D-rated, which usually means shorter tenancies and higher turnover. Who's the typical renter profile here, and what's been the actual vacancy rate?
- What's the average days-on-market for RENTAL listings here right now (not sales)? A rising rental-DOM trend means longer vacancies and softer asking-rent achievability than the comps imply.
- What's the recent tenant-quality profile in this submarket — average credit score on applications, eviction rate, late-payment / NSF rate, and stable-employment percentage? A property-management company in the area should have these aggregated.
- How much new for-sale + rental construction is in the pipeline within 1–3 miles? Heavy new supply typically softens prices + rents 12–24 months out; constrained supply supports both.
Investment metrics
- 1% rule
- 0.94% ✗
- Cap rate
- 7.80%
- Cash-on-cash
- 5.37%
- DSCR
- 1.24
- GRM
- 8.8
CMA / ARV
No comps found within radius.
Projected returns pro-forma
-3.0% appreciation · 3.0% rent growth · sell at horizon
- IRR
- -8.0%
- Equity multiple
- 0.70×
- Total profit
- $-15,281
- Equity at exit
- $27,584
- IRR
- 1.5%
- Equity multiple
- 1.11×
- Total profit
- $5,468
- Equity at exit
- $15,995
Cash invested: $51,800 (down + closing). Projections, not guarantees.
Landlord ↔ Tenant lean methodology
- Overall (STATE)
- 90 Strongly Landlord-Friendly
- State Louisiana
- 90 Strongly Landlord-Friendly · R+12
- County
- — inherits STATE
- City
- — inherits STATE
ZIP-level market 70555
- Home prices YoY
- -29.4%
- Active inventory
- 248
- Price-to-rent
- 8.8×
Monthly cashflow live
- Estimated rent
- $1,746 medium interval (Pro) →
- Mortgage (P&I)
- −$970
- Tax from tax record
- −$100 /mo · $1,203/yr
- Insurance
- −$77
- HOA
- −$0
- Vacancy / Maint / Mgmt
- −$367
- Net cashflow
- $232
Break-even live
UW: 25.0% down · 7.5% · 30yr · 1.5% tax · 5.0% vac · 8.0% maint · 8.0% mgmt
Financing live
Cash to close
- Down payment
- $46,250
- Closing costs
- $5,550
- Reserves months
- —
- Total cash needed
- —
Loan-product check · same deal, 3 products live
Conventional
25% down · 7.5% · 30yr
- Down + closing
- —
- Monthly P&I
- —
- Monthly cashflow
- —
- DSCR
- —
- Eligible?
- —
Personal DTI + credit; lowest rate.
DSCR
20% down · 8.5% · 30yr
- Down + closing
- —
- Monthly P&I
- —
- Monthly cashflow
- —
- DSCR
- —
- Eligible?
- —
No personal income docs; deal must DSCR.
Hard money
10% down · 12.0% · 12mo
- Down + closing
- —
- Monthly P&I
- —
- Monthly cashflow
- —
- DSCR
- —
- Eligible?
- —
Short-term bridge; refi at stabilization.
Rent comps 4 comps
| Address | Beds | Baths | Sqft | Rent | $/sqft | DOM | Units | Dist |
|---|---|---|---|---|---|---|---|---|
| 2339 Robley Dr Lafayette, LA | 3.0 | 2.0 | 1428 | $1,395 | $0.98 | 13d | 1 | 0.86mi |
| 303 Belle Grove Blvd Lafayette, LA | 3.0 | 2.0 | 1700 | $1,700 | $1.00 | 21d | 1 | 1.00mi |
| 706 Picard Rd Unit 20 Lafayette, LA | 2.0 | 1.0 | 950 | $850 | $0.89 | 21d | 1 | 1.26mi |
| 8550 Cat Rd Unit B Maurice, LA | 3.0 | 2.0 | 1324 | $1,650 | $1.25 | 43d | 1 | 1.42mi |
Listing history 14 events
-
2026-06-07statusdays on market $185,000 Pending 14 DOM
-
2026-06-03days on market $185,000 Active 12 DOM
-
2026-06-02days on market $185,000 Active 11 DOM
-
2026-06-01days on market $185,000 Active 10 DOM
-
2026-05-31days on market $185,000 Active 9 DOM
-
2026-05-30days on market $185,000 Active 8 DOM
-
2026-05-21$185,000 Active
-
2025-10-28historical Contingent (Show)
-
2025-10-24price $184,995
-
2025-10-14$190,000 Active
-
2015-11-01soldstatus $68,224 216-char remark
Show marketing remark (216 chars)
This 3 Bedroom 2 Bath home is in a great location. A large deck in back with a hot tub built in. Needs some improvements, great for an investor or a young couple just starting out. Call and schedule a showing today!!
-
2015-09-22$41,473 216-char remark
Show marketing remark (216 chars)
This 3 Bedroom 2 Bath home is in a great location. A large deck in back with a hot tub built in. Needs some improvements, great for an investor or a young couple just starting out. Call and schedule a showing today!!
-
2006-12-05soldstatus $107,000
-
2006-09-05$108,500
ⓘ Source: listings_history table (triggers on properties + properties_extension) + one-shot
backfill from property_details.listing_events for pre-trigger history.
Tax reassessment forecast LA · Resets to sale price
- Current annual tax
- $1,203 · $100/mo
- Projected year-2 tax
- $1,203 · $100/mo
- Expected delta
- $0/yr ($0/mo · 0.0%)
ⓘ Screening estimate from a state-policy table — verify with the county assessor before closing.
Climate risk First Street
- Flood 1/10 Low FEMA zone X (unshaded) · 0% chance over 30 yrs
- Wildfire 1/10 Low
- Heat 9/10 Extreme 7 d/yr ≥108°F today · 21 d/yr by 30 yrs out
- Wind 9/10 Extreme 99% chance of damaging wind over 30 yrs
- Air quality 1/10 Low 0 unhealthy d/yr today · 0 by 30 yrs out
Nearby sold comps map
Loading sold comps map…
Walkable amenities ~0.75 mi
Loading nearby amenities…
Taxation est. · year 1
- Rental income
- $20,949
- − Mortgage interest
- −$10,363
- − Property taxes
- −$1,203
- − Insurance
- −$925
- − Repairs & maintenance
- −$1,676
- − Management
- −$1,676
- − Depreciation
- −$5,382
- Taxable loss
- −$276
- Est. tax savings @ 24.0%
- +$66
- After-tax cash flow
- $2,845/yr
For passive investors: Depreciation is non-cash, so a rental often shows a tax loss while cash-flowing — sheltering income. Rental losses are passive: they offset passive income freely, and up to $25,000/yr can offset ordinary (W-2) income if you actively participate and your MAGI is under $100k (phasing out to $0 by $150k); unused losses carry forward. On sale, claimed depreciation is recaptured at up to 25%, and gains may owe capital-gains tax (a 1031 exchange can defer both). Figures are a year-1 estimate at your 24.0% rate — not tax advice; consult a CPA.
Schools (NCES district)
- District
- Vermilion Parish
- NCES district ID
- 2201800
- Math proficiency
- 40% ▼ -38.00%
- Reading proficiency
- 53% ▼ -32.00%
- Median HH income
- $45,115
- Composite
- 39.37/100
- National rank
- #3974
- State rank
- #15 of 98 in LA
Livability — Milton
- Score
- 68/100
- State rank
- #89
- US rank
- #9617
Category grades
Schools grade is shown separately in the Schools card above.
Census & demographics
- County
- Vermilion Parish · 8,759 people
- City population
- 24
- Metro
- Lafayette, LA
- Population (ZIP)
- 8,759
- Household income
- $76,213
- Rent vs Own
- Severe rent burden
- 46.0
Population outlook (Vermilion County) Hauer SSP2
- Today (2025)
- 64,095 people
- By 2030
- 65,915 · +2.8%
- By 2040
- 68,985 · +7.6%
- By 2050
- 70,804 · +10.5%
- By 2075
- 73,897 · +15.3%
- By 2100
- 71,793 · +12.0%
Race, ethnicity, and origin ACS 2023
- Neighborhood character
- Predominantly White (82%)
- Race & ethnicity
- White 82% Black 8% Two or more races 5% Hispanic / Latino 4% Asian 3%
- Common ancestry
- Lithuanian 25% Romanian 3% Italian 1%
- Foreign-born
- 2% · Vietnam
- Languages at home
- 93% English-only · French/Haitian/Cajun 4% Vietnamese 2% Spanish 1%
Political lean MEDSL · Vermilion
- 2024 margin
- Solid R (+63.8) · D 17.6% · R 81.4% · Other 1.1%
- 2008→2024 swing
- -16.3pp toward R · 2008: -47.5pp · 2024: -63.8pp
- All cycles
- 2024: R+63.8 2020: R+61.9 2016: R+59.6 2012: R+52.8 2008: R+47.5
Not yet ingested
- Civics
- —
Market trends
- HPI YoY
- ▼ -55.61%
- Current HPI
- 133.7146
- Rent YoY
- —
- Metro
- Lafayette, LA
- State GDP YoY
- ▲ 3.29%
- F500 in state
- 10
Industry mix (Fortune 500 HQ in LA)
| Industry | F500 HQs | Revenue |
|---|---|---|
| Telecommunications | 2 | $23B |
|
||
| Utilities | 1 | $12B |
|
||
| Wholesale / Distribution | 1 | $5B |
|
||
| Advertising | 1 | $2B |
|
||
Price history
+70.5% since first listed8 events — show timeline
- 2026-05-21 Listed $185,000 AcadianaMLS
- 2025-10-28 Contingent — AcadianaMLS
- 2025-10-24 Price Changed $184,995 AcadianaMLS
- 2025-10-14 Listed $190,000 AcadianaMLS
- 2015-11-01 Sold (MLS) $68,224 AcadianaMLS
- 2015-09-22 Listed $41,473 AcadianaMLS
- 2006-12-05 Sold (MLS) $107,000 AcadianaMLS
- 2006-09-05 Listed $108,500 AcadianaMLS
Property tax history
+2.1%/yrLatest (2025): $1,203 · -0.1% YoY. Source: county tax records.
Cash-flow waterfall
monthlySold comps — $/sqft
last 12 mo · ≤1 miLoading sold comps…