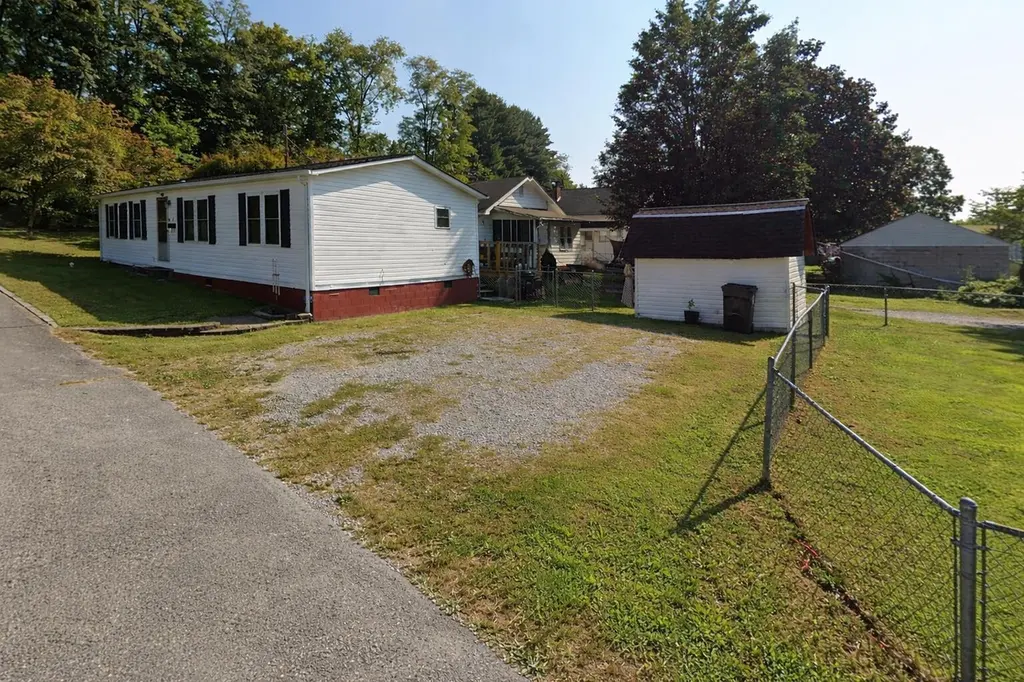
401 Lee St · Corbin, KY
Flood risk 1/10 · Minimal
- FEMA flood zone
- X (unshaded)
- Chance of flooding over 30 yrs
- 0.0%
- Est. flood insurance / yr
- $473 – $860
Fire risk 3/10 · Minor
- Est. fire insurance / yr
- $839 – $1,559
Heat risk 4/10 · Minor
- Hot days now (above 100°F)
- 7 days/yr
- Hot days in 30 yrs
- 20 days/yr
Wind risk 2/10 · Minimal
- Chance of severe wind over 30 yrs
- 4.0%
Air-quality risk 2/10 · Minimal
- Unhealthy air days now
- 0 days/yr
- Unhealthy air days in 30 yrs
- 1 days/yr
Risk factors via First Street. Map © Google.
Why this score? — see what drove the C grade
The composite is a weighted blend of 9 inputs, each scored 0–100. Each bar is that input's sub-score; the figure is the points it added to the 100-point composite (weight × sub-score).
- Cash flow +21.2/30.0
- ARV discount +7.5/15.0
- DSCR +6.8/10.0
- Appreciation +5.9/10.0
- 1% rule +5.6/10.0
- Schools +3.8/10.0
- Livability +3.5/5.0
- Rent growth +2.5/5.0
- Condition / age +2.5/5.0
$129,900
🖨 Deal sheet (PDF) 📄 Offer letter ✓ Due diligence
Listing remarks
Conveniently located in the city of Corbin and priced to sell! This well-maintained manufactured home offers 3 bedrooms and 2 bathrooms and is close to schools, shopping, and everyday conveniences.
Key facts
- 6,969 sq ft lot
- Built 1991
- Listed 95 days
Property features AI
Finance
- Other: Located in the City Limits subdivision, Whitley County; Directions: From Kentucky St or Main St in Corbin, turn onto Fourth St; home on corner of Lee and Fourth St
Exterior
- Utilities: Public sewer
- Home design: Single building with 1,248 total building area
- Construction: Vinyl siding exterior; Block foundation
- Exterior features: Public water; Not on waterfront
Interior
- Bedrooms: 2 total rooms (includes bedrooms and other living spaces)
- Flooring: Carpet
- Bathrooms: 2 full bathrooms
- Heating & cooling: Heat pump; Central air
- Interior features: Carpet flooring; No fireplace
Neighborhood map
What this means for you Summary
Snapshot
- This is a 3-bed/2.0-bath manufactured listed at $130k.
Deal economics
- At list price, monthly cash flow is $189 ($2k/yr) — positive.
- The deal already cash-flows at list — no discount required.
- Meets the 1% rule at list price ($1k rent vs $130k).
- Recommended offer: $118k (9.0% below list) — sets the bar for market timing.
- Cap rate 8.0% vs local median 3.4% in Corbin — top-decile yield for the area; either an underpriced asset or a hidden risk that comps aren't pricing in. Stress-test before assuming the spread holds.
Location & tenants
- Location reads 69/100 on livability (#179 in KY) — a middle-class / working-renter tenant base. Strengths: cost of living A+, housing A+, crime A-; Watch: amenities F, commute F, employment F.
- Corbin Independent (town): math 42% / reading 50% proficiency, ranked #20 of 165 in KY (top 12%) — families likely to look elsewhere, expect single-tenant / working-renter base with shorter leases.
- Zoned schools: Corbin Primary (math 42% / reading 32%, grade F, #255 of 676 statewide, top 42%, 769 students, 60% FRL); Corbin Middle School (math 46% / reading 56%, grade C, #20 of 217 statewide, top 10%, 646 students, 58% FRL); Corbin High School (math 22% / reading 42%, grade F, #97 of 254 statewide, top 46%, 829 students, 53% FRL).
- Market conditions: 331 active listings in the ZIP; 1 comparable units currently listed for rent nearby; 65 units permitted in Whitley County in 2024 (0 in 5+ unit buildings).
Forward outlook
- In year one you build about $3k of equity ($898 loan paydown + $2k appreciation (1.8% local appreciation)).
- Whitley County population projected to shrink 8% by 2050 — rents likely to lag national; underwrite the cash flow, not the appreciation.
- At projected returns (1.8% appreciation + 3.0% rent growth), your $36k cash investment doubles in ~6 years — after that, you're playing with house money.
- By year 10, paydown + projected appreciation supports a ~$32k cash-out refi (75% LTV) — recoverable capital for the next deal without selling this one.
Negotiation context
- It's been on market 95 days — a 9% lower offer ($118k) is reasonable based on typical stale-listing flexibility.
- 2 sale attempts since 19y ago; this cycle's ask has dropped $20k (13%) from the opening price — seller is motivated, your offer sets the floor, not the list.
- Current owner paid $47k; list at $130k implies a 176% gain — meaningful room to come down on a strong offer.
Questions for the listing agent
- It's been on market 95 days. Have you received any prior offers? Is the seller open to a 9% concession, seller financing, or rate buy-down credit?
- Why hasn't it sold? Are there any deal-killer items the seller is aware of (foundation, flood, title, zoning, code violations)?
- Is there a deadline driving the sale (1031 exchange, divorce, estate, relocation)? That informs how much negotiation room exists.
- Schools are B-rated — typically a magnet for longer-tenancy family renters. What's the average tenant stay here, and is there a school-zone premium baked into asking?
- What's the average days-on-market for RENTAL listings here right now (not sales)? A rising rental-DOM trend means longer vacancies and softer asking-rent achievability than the comps imply.
- What's the recent tenant-quality profile in this submarket — average credit score on applications, eviction rate, late-payment / NSF rate, and stable-employment percentage? A property-management company in the area should have these aggregated.
- How much new for-sale + rental construction is in the pipeline within 1–3 miles? Heavy new supply typically softens prices + rents 12–24 months out; constrained supply supports both.
Investment metrics
- 1% rule
- 1.06% ✓
- Cap rate
- 8.03%
- Cash-on-cash
- 6.22%
- DSCR
- 1.28
- GRM
- 7.9
CMA / ARV
No comps found within radius.
Projected returns pro-forma
1.82% appreciation · 3.0% rent growth · sell at horizon
- IRR
- 10.2%
- Equity multiple
- 1.54×
- Total profit
- $19,779
- Equity at exit
- $50,007
- IRR
- 13.3%
- Equity multiple
- 2.76×
- Total profit
- $63,948
- Equity at exit
- $71,078
Cash invested: $36,372 (down + closing). Projections, not guarantees.
Landlord ↔ Tenant lean methodology
- Overall (STATE)
- 83 Strongly Landlord-Friendly
- State Kentucky
- 83 Strongly Landlord-Friendly · R+16
- County
- — inherits STATE
- City
- — inherits STATE
ZIP-level market 40701
- Home prices YoY
- 0.6%
- Active inventory
- 331
- Price-to-rent
- 7.9×
Monthly cashflow live
- Estimated rent
- $1,375 medium interval (Pro) →
- Mortgage (P&I)
- −$681
- Tax est. 1.5%
- −$162 /mo · $1,948/yr
- Insurance
- −$54
- HOA
- −$0
- Vacancy / Maint / Mgmt
- −$289
- Net cashflow
- $189
Break-even live
Sensitivity live
| Price | -10% $278 | -5% $233 | +0% $189 | +5% $144 | +10% $99 |
|---|---|---|---|---|---|
| Rent | -10% $80 | -5% $134 | +0% $189 | +5% $243 | +10% $297 |
| Rate | -1.0pp $254 | -0.5pp $222 | base $189 | +0.5pp $155 | +1.0pp $121 |
UW: 25.0% down · 7.5% · 30yr · 1.5% tax · 5.0% vac · 8.0% maint · 8.0% mgmt
Financing live
Cash to close
- Down payment
- $32,475
- Closing costs
- $3,897
- Reserves months
- —
- Total cash needed
- —
Loan-product check · same deal, 3 products live
Conventional
25% down · 7.5% · 30yr
- Down + closing
- —
- Monthly P&I
- —
- Monthly cashflow
- —
- DSCR
- —
- Eligible?
- —
Personal DTI + credit; lowest rate.
DSCR
20% down · 8.5% · 30yr
- Down + closing
- —
- Monthly P&I
- —
- Monthly cashflow
- —
- DSCR
- —
- Eligible?
- —
No personal income docs; deal must DSCR.
Hard money
10% down · 12.0% · 12mo
- Down + closing
- —
- Monthly P&I
- —
- Monthly cashflow
- —
- DSCR
- —
- Eligible?
- —
Short-term bridge; refi at stabilization.
Rent comps 1 comps
| Address | Beds | Baths | Sqft | Rent | $/sqft | DOM | Units | Dist |
|---|---|---|---|---|---|---|---|---|
| 1003 W 5th St Corbin, KY | 3.0 | 1.0 | 1186 | $1,375 | $1.16 | 45d | 1 | 0.25mi |
Listing history 23 events
-
2026-06-21days on market $129,900 Active 95 DOM
-
2026-06-21days on market $129,900 Active 94 DOM
-
2026-06-18days on market $129,900 Active 92 DOM
-
2026-06-17days on market $129,900 Active 91 DOM
-
2026-06-16days on market $129,900 Active 90 DOM
-
2026-06-15days on market $129,900 Active 89 DOM
-
2026-06-13days on market $129,900 Active 87 DOM
-
2026-06-12days on market $129,900 Active 86 DOM
-
2026-06-09days on market $129,900 Active 83 DOM
-
2026-06-08days on market $129,900 Active 82 DOM
-
2026-06-07pricedays on market $129,900 Active 81 DOM
-
2026-06-04days on market $139,900 Active 77 DOM
-
2026-06-02days on market $139,900 Active 76 DOM
-
2026-06-01days on market $139,900 Active 75 DOM
-
2026-05-31days on market $139,900 Active 74 DOM
-
2026-05-31days on market $139,900 Active 73 DOM
-
2026-05-05price $139,900
-
2026-03-18$149,900 Active
-
2021-02-26soldstatus $47,000
-
2010-12-01soldstatus $49,500
-
2008-04-08soldstatus $45,500
-
2008-03-13historical
-
2007-09-14$59,900
ⓘ Source: listings_history table (triggers on properties + properties_extension) + one-shot
backfill from property_details.listing_events for pre-trigger history.
Climate risk First Street
- Flood 1/10 Low FEMA zone X (unshaded) · 0% chance over 30 yrs
- Wildfire 3/10 Moderate
- Heat 4/10 Moderate 7 d/yr ≥100°F today · 20 d/yr by 30 yrs out
- Wind 2/10 Low 4% chance of damaging wind over 30 yrs
- Air quality 2/10 Low 0 unhealthy d/yr today · 1 by 30 yrs out
Nearby sold comps map
Loading sold comps map…
Walkable amenities ~0.75 mi
Loading nearby amenities…
Taxation est. · year 1
- Rental income
- $16,500
- − Mortgage interest
- −$7,276
- − Property taxes
- −$1,948
- − Insurance
- −$650
- − Repairs & maintenance
- −$1,320
- − Management
- −$1,320
- − Depreciation
- −$3,779
- Taxable income
- $207
- Est. tax owed @ 24.0%
- −$50
- After-tax cash flow
- $2,213/yr
For passive investors: Depreciation is non-cash, so a rental often shows a tax loss while cash-flowing — sheltering income. Rental losses are passive: they offset passive income freely, and up to $25,000/yr can offset ordinary (W-2) income if you actively participate and your MAGI is under $100k (phasing out to $0 by $150k); unused losses carry forward. On sale, claimed depreciation is recaptured at up to 25%, and gains may owe capital-gains tax (a 1031 exchange can defer both). Figures are a year-1 estimate at your 24.0% rate — not tax advice; consult a CPA.
Schools (NCES district)
- District
- Corbin Independent
- NCES district ID
- 2101320
- Math proficiency
- 42% ▼ -19.00%
- Reading proficiency
- 50% ▼ -13.00%
- Median HH income
- $36,928
- Composite
- 38.19/100
- National rank
- #4259
- State rank
- #20 of 165 in KY
Livability — Corbin
- Score
- 69/100
- State rank
- #179
- US rank
- #8891
Category grades
Schools grade is shown separately in the Schools card above.
Census & demographics
- Census place
- Corbin, KY
- Population (ZIP)
- 29,767
Population outlook (Whitley County) Hauer SSP2
- Today (2025)
- 35,362 people
- By 2030
- 34,807 · -1.6%
- By 2040
- 33,525 · -5.2%
- By 2050
- 32,550 · -8.0%
- By 2075
- 29,555 · -16.4%
- By 2100
- 24,308 · -31.3%
Race, ethnicity, and origin ACS 2023
- Neighborhood character
- Predominantly White (95%)
- Race & ethnicity
- White 95% Two or more races 3% Hispanic / Latino 1%
- Common ancestry
- Serbian 2% Slovak 2% Italian 1%
- Foreign-born
- 1% · Canada
- Languages at home
- 99% English-only · Spanish 1%
Political lean MEDSL · Whitley
- 2024 margin
- Solid R (+69.3) · D 14.8% · R 84.2% · Other 1.0%
- 2008→2024 swing
- -21.7pp toward R · 2008: -47.7pp · 2024: -69.3pp
- All cycles
- 2024: R+69.3 2020: R+65.2 2016: R+67.2 2012: R+57.8 2008: R+47.7
Not yet ingested
- Civics
- —
Market trends
- HPI YoY
- ▲ 1.82%
- Current HPI
- 294.7961
- Rent YoY
- —
- Metro
- —
- State GDP YoY
- ▲ 1.81%
- F500 in state
- 4
Industry mix (Fortune 500 HQ in KY)
| Industry | F500 HQs | Revenue |
|---|---|---|
| Healthcare | 1 | $118B |
|
||
| Food / Beverage | 1 | $7B |
|
||
Price history
+133.6% since first listed7 events — show timeline
- 2026-05-05 Price Changed $139,900 ImagineMLS
- 2026-03-18 Listed $149,900 ImagineMLS
- 2021-02-26 Sold (Public Records) $47,000 Public Records
- 2010-12-01 Sold (Public Records) $49,500 Public Records
- 2008-04-08 Sold (Public Records) $45,500 Public Records
- 2008-03-13 Listing Removed — ImagineMLS
- 2007-09-14 Listed $59,900 ImagineMLS
Property tax history
-0.7%/yrLatest (2024): $163 · -3.8% YoY. Source: county tax records.
Cash-flow waterfall
monthlySold comps — $/sqft
last 12 mo · ≤1 miLoading sold comps…